Please help the NWS spread these messages on social media! Everyone is welcome to use the text and images provided below to help the NWS build a Weather-Ready Nation.
Facebook
Haboob. Funny name, dangerous weather phenomenon. Learn about them and other examples of weird weather in this short video: youtu.be/vuk6gvq7Nwk #wxscience
Twitter
Haboob. Funny name, dangerous weather phenomenon. Learn about them and other examples of weird weather in this short video: youtu.be/vuk6gvq7Nwk #wxscience
Facebook
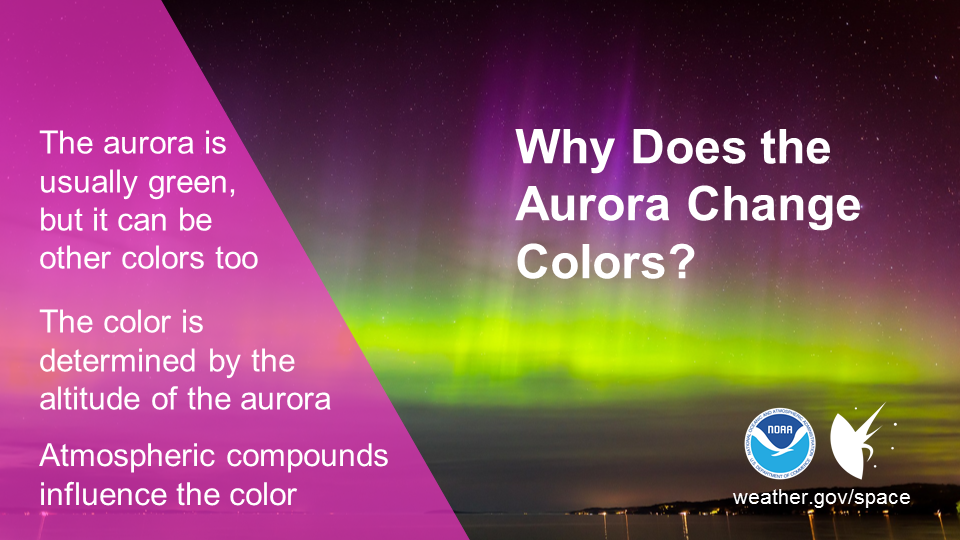
The aurora borealis is usually green in color, although it can also appear to be a range of other colors, including red, blue, pink and purple. The color of the aurora is determined by the altitude in which it appears. Different atmosphere compounds (such as Nitrogen and Oxygen) are found at different altitudes. When charged particles from the Sun enter our atmosphere, they interact with those compounds, and the aurora is the visible result. Depending on which compounds are being excited by the Sun’s charged particles, different colors will result. Learn more at https://pwg.gsfc.nasa.gov/polar/telecons/archive/PR_E-PO/Aurora_flyer/aurora-flyer_p2.doc.pdf
Twitter
Changing colors of the aurora? It’s elemental, my dear Watson!! https://pwg.gsfc.nasa.gov/polar/telecons/archive/PR_E-PO/Aurora_flyer/aurora-flyer_p2.doc.pdf #SpaceWeather
|
Facebook
Frost can be annoying to scrape off your car, but did you ever think about how it got there? Watch this video for a little #FrostScience: youtu.be/HBn1oSWu2nE
Twitter
Frost can be annoying to scrape off your car, but did you ever think about how it got there? Watch this video for a little #FrostScience: youtu.be/HBn1oSWu2nE
Facebook
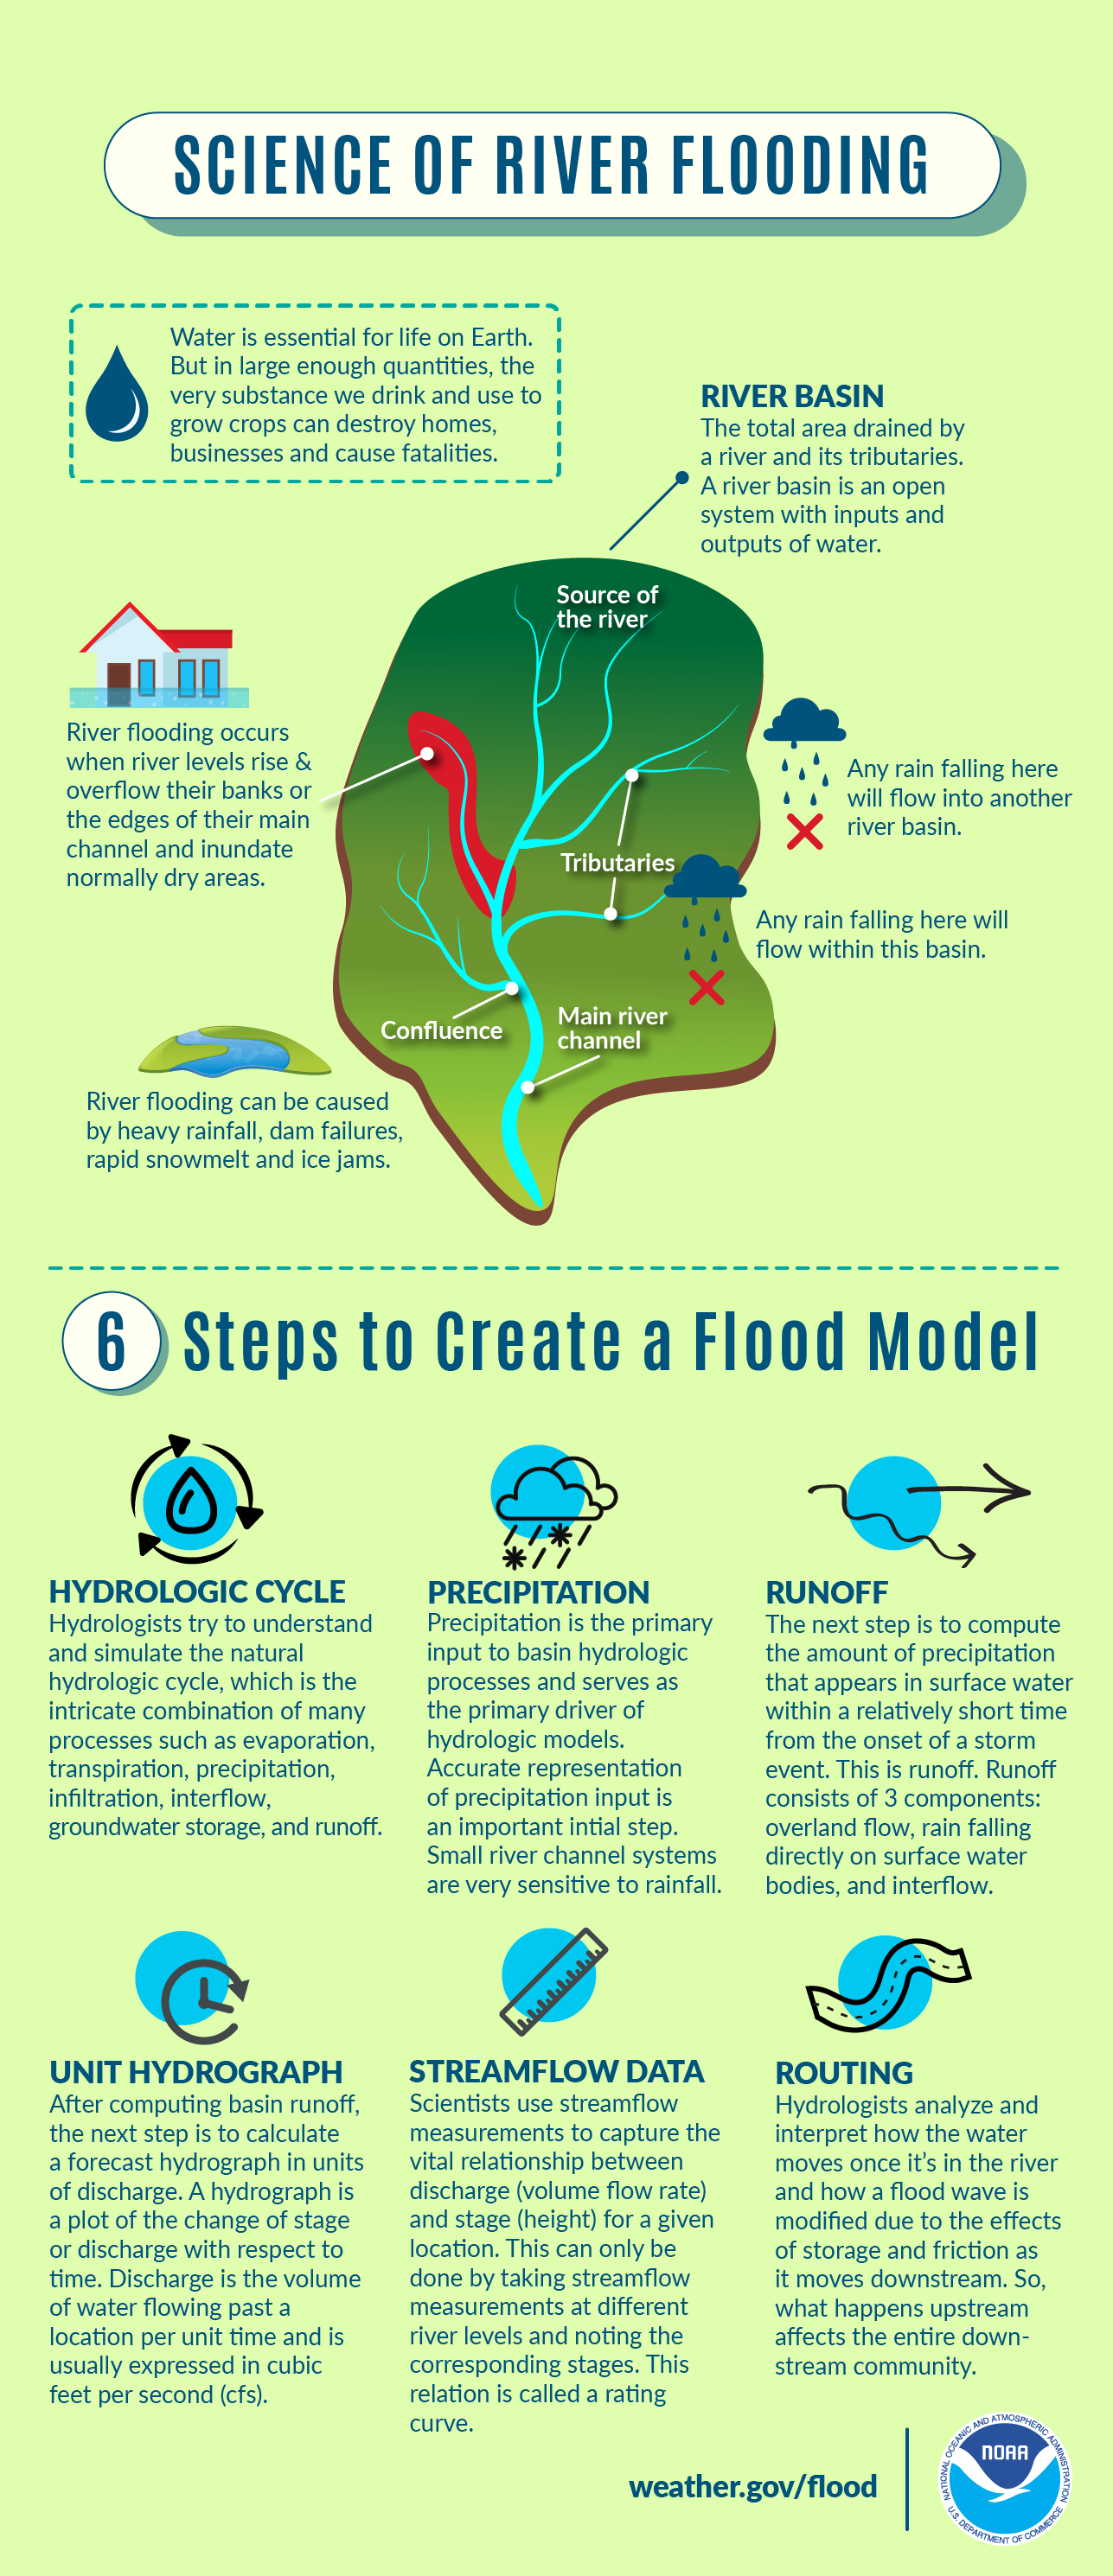
Water is essential for life on Earth. But in large enough quantities, the very substance we drink and use to grow crops can destroy homes, businesses, and cause fatalities. Learn all about the science of river flooding in the infographic below, and visit weather.gov/flood for flood safety tips. #FloodScience
Twitter
Learn all about the science of river flooding with this graphic, and visit weather.gov/flood for flood safety tips. #FloodScience
|
Facebook
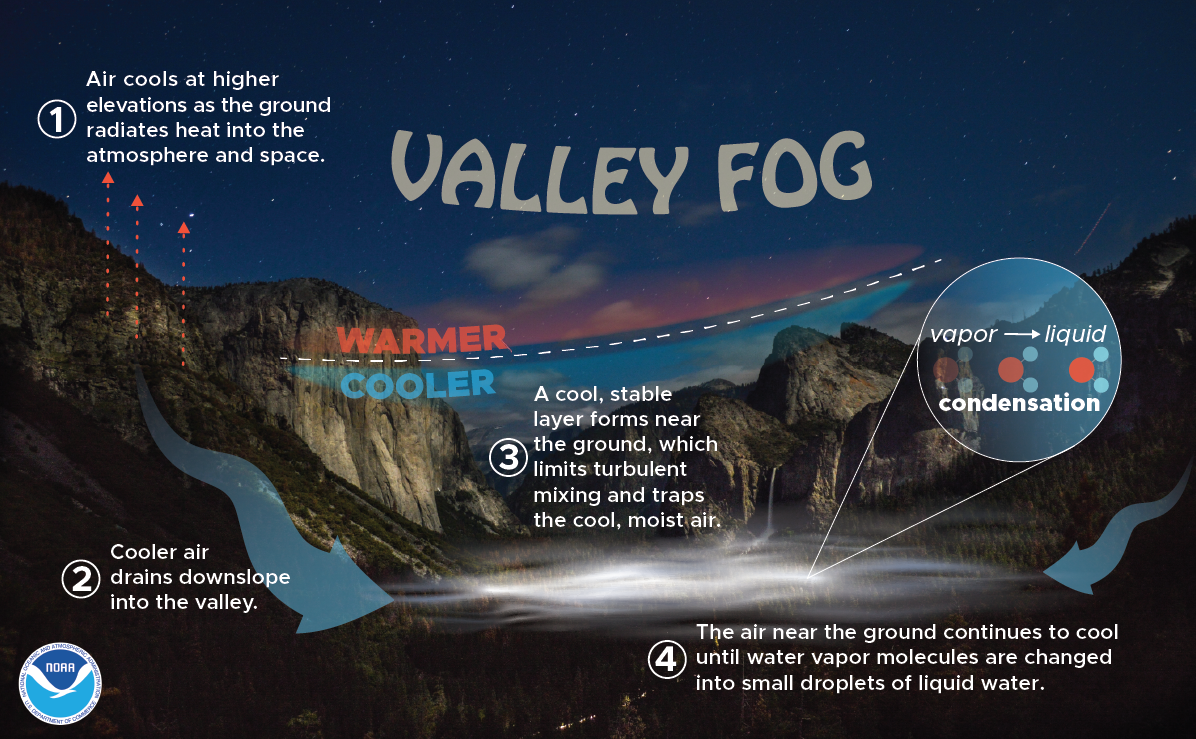
Do you know how valley fog is created? First, air at higher elevations cools down, which then drains downslope into the valley. From there, a cool, stable layer forms near the ground, which limits turbulent mixing and traps the cool, moist air. Finally, the air near the ground continues to cool until water vapor molecules are changed into small droplets of liquid water. weather.gov/safety/fog-mountain-valley #FogScience
Twitter
Looking down on the clouds? Do you know how valley fog is created? weather.gov/safety/fog-mountain-valley #FogScience
|
Facebook
Fog limits visibility, delays air travel, brings danger to the roads, and makes things generally spooky. But, how does it form? Watch this short video: youtu.be/QkRqjcO1ROk #FogScience
Twitter
Fog limits visibility, delays air travel, brings danger to the roads, and makes things generally spooky. But, how does it form? Watch this short video: youtu.be/QkRqjcO1ROk #FogScience
Facebook
Wind is a part of weather we experience all the time, but why does it actually happen? This video covers the basics: youtu.be/kb9oRYUzlwQ #WindScience
Twitter
A gentle breeze or a roaring gale, wind is a part of weather we experience all the time, but why does it actually happen? This video covers the basics: youtu.be/kb9oRYUzlwQ #WindScience
Facebook
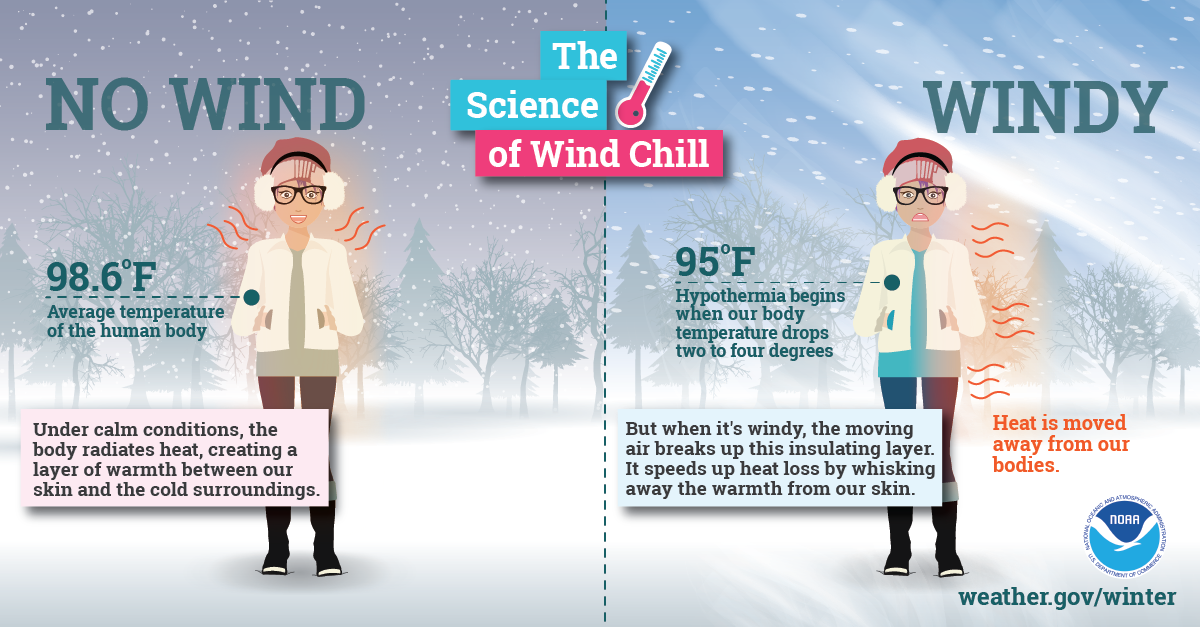
Extremely cold air comes every winter in at least part of the country and affects millions of people across the United States. The arctic air, together with brisk winds, can lead to dangerously cold wind chill values. weather.gov/safety/cold-wind-chill-chart #WinterScience
Twitter
Arctic air, together with brisk winds, can lead to dangerously cold wind chill values. weather.gov/safety/cold-wind-chill-chart #WinterScience
|
Facebook
Santa Ana winds are strong downslope winds that blow through the mountain passes in Southern California. They are created over the Great Basin region from high-pressure air masses, which then blow down towards sea level. These winds, which can easily exceed 40 miles per hour (18 m/s), are warm and dry and can severely exacerbate brush or forest fires, especially under drought conditions. For more info, visit https://earthobservatory.nasa.gov/NaturalHazards/view.php?id=10727. #WindScience
Twitter
Santa Ana winds are notorious for creating dangerous fire conditions. Learn how here: https://earthobservatory.nasa.gov/NaturalHazards/view.php?id=10727 #WindScience

|
Facebook
Do you know what to watch for when severe weather threatens? Check out NWS Skywarn. Help keep your community safe by volunteering to become a trained storm spotter for NOAA's National Weather Service. Potential volunteers should visit nws.noaa.gov/skywarn/ and contact their local NWS office. #CitizenScience
Twitter
Let’s learn about #NWSCitizenScience opportunities! Become a trained Skywarn storm spotter and help keep your community safe! nws.noaa.gov/skywarn/ #CitizenScience
|
Facebook
Ever wanted to take rain or snow measurements? Join CoCoRaHS or Community Collaborative Rain, Hail, and Snow Network. This volunteer network of observers measure precipitation from their backyard. Any age can volunteer. Data is used by NWS meteorologists to help with forecasts. www.cocorahs.org
Twitter
Ever wanted to take rain or snow measurements? Learn more about #NWSCitizenScience and join CoCoRaHS today! Cocorahs.org #CitizenScience
|
Facebook
Check out mPING (Meteorological Phenomena Identification Near the Ground) project. Weird name, cool app! You can report the type of precipitation you see where you are. No need to measure! Use the free mobile app to send reports anonymously. Reports are automatically recorded into a database, which improves weather computer models. The information is even used by road maintenance operations and the aviation industry to diagnose areas of icing. mping.nssl.noaa.gov #CitizenScience
Twitter
Check out mPING! Weird name, cool app for #CitizenScience! Report weather types via the mPing app and help improve weather model forecasts! mping.nssl.noaa.gov #NWSCitizenScience
|
Facebook
The NWS Cooperative Observer Program (COOP) is truly the Nation's weather and climate observing network of, by and for the people. With over 8,700 volunteer observers, this program has existed since 1890 and is one of the few programs that measures snowfall and its water equivalent. Help #NWSCitizenScience and become a COOP! You can help support warnings, forecasts, and build a climatological database! For more information, visit weather.gov/media/nws/dapm_opl.pdf
Twitter
Join NWS COOP! The NWS Cooperative Observer Program (COOP) is truly the Nation's weather and climate observing network of, by and for the people. Help support warnings, forecasts & build a climatological database! weather.gov/media/nws/dapm_opl.pdf #NWSCitizenScience
|

