Winter 2013-14 ended up going off the deep end. The snow and cold arrived the second half of November, and December was rather cold, and then it got really cold. A persistent upper ridge along the west coast allowed the trough aloft, with a northwest flow, to persist over the Midwest and Great Lakes. We now have all heard of the “Polar Vortex”. This was the core of the coldest air in North America and brought true arctic air to the area. It is common to have a northwest flow in the winter, but it is unusual to have the pattern consistently hold almost every day the entire winter east of the Rockies. Here is some temperature info for the winter (Dec13-Feb14), just in case you needed convincing!
|
Temperature (F)
|
2013-14 |
Rank |
2012-13 |
Normal |
Record/Season |
2013-14 Days Zero or Below/Rank |
Most Zero & Below/Year |
|
Toledo |
20.4 |
5 |
30.0 |
27.8 |
17.7/1977-78 |
25/3 |
29/1962-63 |
|
Mansfield |
23.4 |
9 |
30.8 |
27.8 |
17.6/1976-77 |
14/8 |
27/1976-77 |
|
Cleveland |
25.4 |
22 |
32.0 |
30.3 |
19.7/1976-77 |
11/11* |
28/1976-77 |
|
Akron-Canton |
25.0 |
20 |
31.6 |
28.5 |
20.4/1976-77 |
11/10* |
24/1976-77 |
|
Youngstown |
23.7 |
8 |
30.6 |
28.1 |
19.0/1976-77 |
16/3 |
25/1976-77 |
|
Erie, PA |
24.4 |
17 |
32.4 |
29.3 |
20.5/1976-77 |
10/10* |
14/1978-79 |
*Tied with other winters. Note that rank/duration varies for each climate site.
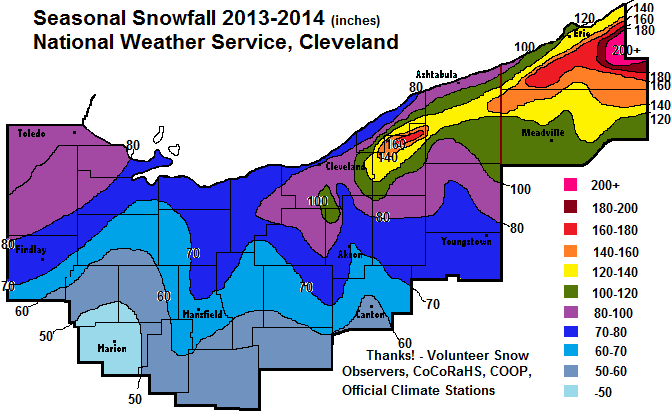
Winter 2013-’14 brought numerous moderate to heavy snows across the Midwest and central Great Lakes. Toledo shared in the bountiful snow and recorded the all-time snowiest winter (for the date) at 86.3 inches. This crushed the old record of 73.1 inches (1977-78)! Lake effect snow was not particularly heavy, especially given the cold weather, mainly because Lake Erie was frozen by the second week of January. Early in the winter, the wind was often southwest. This limited the heaviest lake effect snow to western New York and Erie County, Pennsylvania. Elsewhere, snowfall was well above normal: in the top ten snowiest winters for many areas due to the persistent cold. Snow cover was persistent which helped contribute to and enhance the cold.
| 2013-2014 | Oct 13 | Nov 13 | Dec 13 | Jan 14 | Feb 14 | Mar 14 | Apr 14 | May 14 | Total 2013-14 |
| Toledo | 0 | 0.5 | 11.2 | 40.2 | 21.6 | 11.8 | 1.0 | 0.0 | 86.3 |
| Mansfield | T | 1.5 | 16.4 | 19.6 | 16.3 | 10.5 | 1.0 | 0.0 | 65.3 |
| Cleveland | T | 4.7 | 17.1 | 23.7 | 23.8 | 15.1 | 1.3 | 0.0 | 86.1 |
| Akron-Canton | T | 10.7 | 12.5 | 19.1 | 17.0 | 9.7 | 0.9 | 0.0 | 69.9 |
| Youngstown | 1.2 | 12.9 | 20.5 | 23.0 | 23.4 | 7.9 | 1.2 | 0.0 | 90.1 |
| Erie PA | 0.3 | 15.3 | 48.0 | 28.1 | 29.0 | 17.6 | 1.2 | 0.0 | 139.5 |

