|
Meteorology
|
Upper air features from the morning of May 31, 1985 gave classic indications of a significant severe weather event across eastern Ohio and western Pennsylvania. At 850 mb (or around 4500 feet above sea level), very warm and moist air was surging northward into the Ohio Valley ahead of an unseasonably strong cold front and “dry line” over the western Great Lakes and Midwest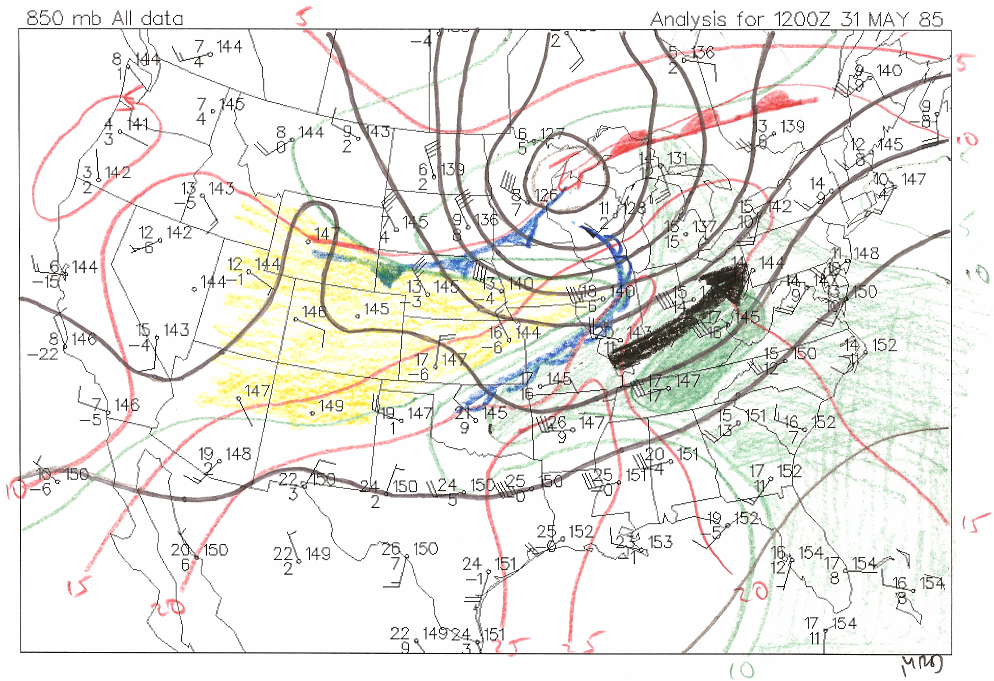 (Figure 1). Temperatures over the Ohio Valley Region that morning were around 15C, with dew points 13 to 16C. Even warmer temperatures were ready to surge northward from the lower Mississippi Valley, where temperatures at 850 mb were close to 25C. These warm and moist 850 mb temperatures combined with cold temperatures aloft allowed for strong instability that afternoon and evening (Showalter Index –8C and Total Total Values 55-60), causing thunderstorms to
 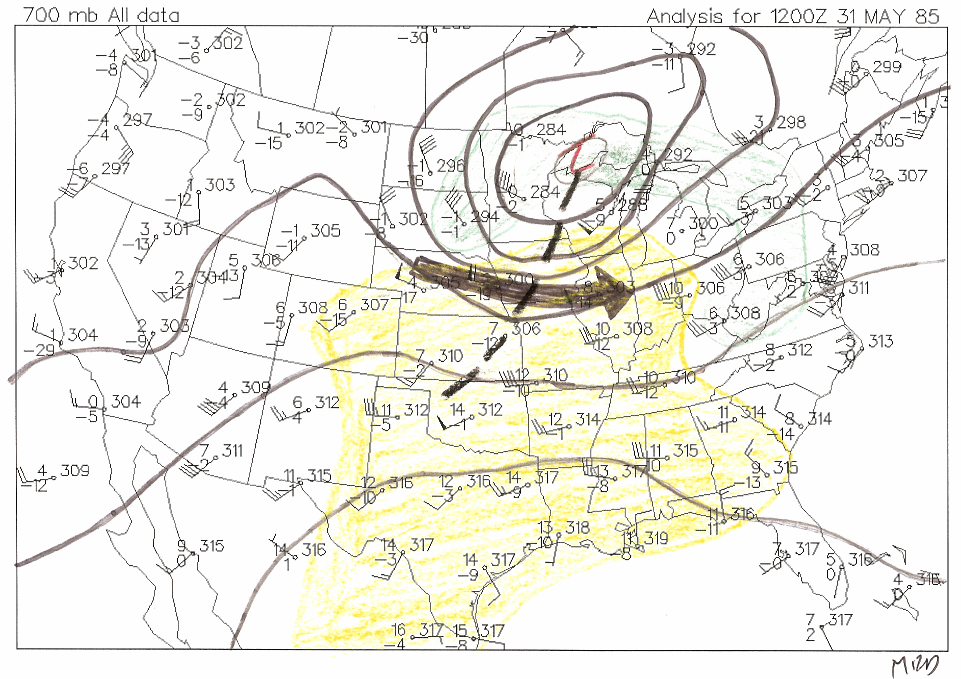 develop along the cold front, which was in eastern Ohio by evening.
At 700 mb (or about 10000 feet above sea level), the main severe weather feature that stood out was the very dry air aloft…extending back into the southern plains (Figure 2). This “dry air punch” is a classic signature in severe weather outbreaks, and is usually seen in significant severe weather outbreaks in the region. Also note the 50+ knot wind speeds from Indiana west through Nebraska. This is also another signature in severe weather across the region.
Finally, at 500 mb (or about 18000 feet above sea level), note the trough axis over the upper Midwest (Figure 3). Also note that the upper level trough was “negatively tilted”. Negatively tilted upper level troughs suggest that very strong lift is possible east of the trough axis. Finally, notice that strong winds in excess of 80 knots immediately ahead of the trough from Iowa to northern Lake Michigan. The combination of strong westerly winds aloft and a strong southwesterly low level jet at 850 mb (and southerly winds at the surface) allowed for increased “spin” over eastern Ohio and western Pennsylvania that afternoon, allowing for increased tornado potential.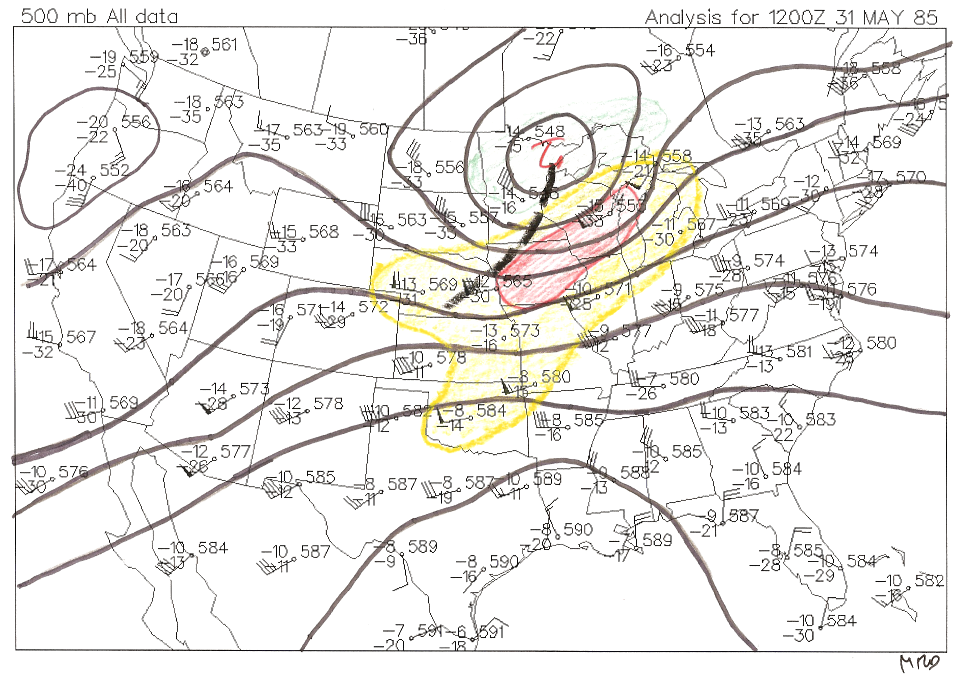 ne last note: The 12 UTC Thermodynamic Diagram (Skew-T) from Dayton, Ohio (Figure 4 -
courtesy Plymouth State College), showed an elevated unstable and mixed layer, with nearly dry adiabatic lapse rates (~13C/km) between 750 mb and 550 mb. Research has shown that this signature on the Skew-T diagram is also a good indicator of significant severe weather.
(Note: All data courtesy Plymouth State College. Hand analysis of data by the National Weather Service in Cleveland.)

