|
River Crests | Rainfall | Rainfall Facts | Meteorology | Photos | Other Links
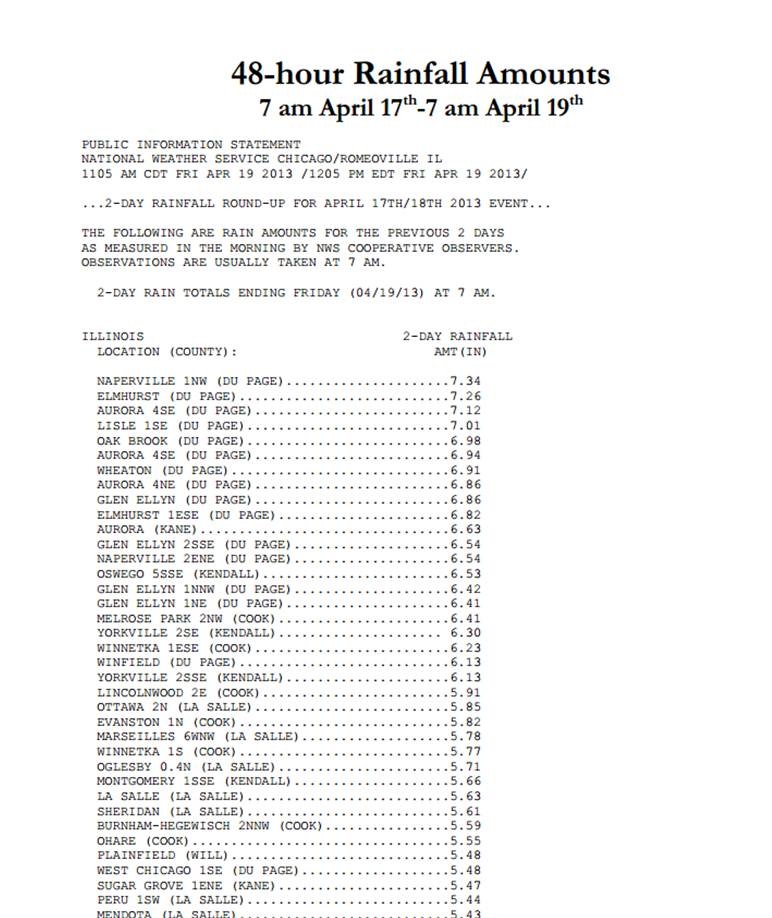
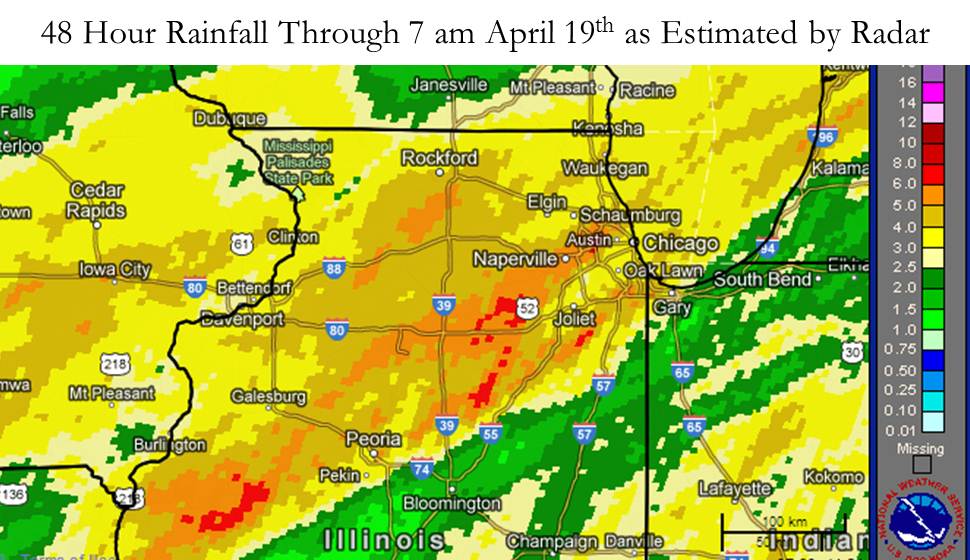
PUBLIC INFORMATION STATEMENT
NATIONAL WEATHER SERVICE CHICAGO IL
237 AM CDT FRI APR 19 2013 /337 AM EDT FRI APR 19 2013/

...INCREDIBLE APRIL 2013 RAINFALL STATS FOR CHICAGO AND ROCKFORD...

ROCKFORD SET ANOTHER DAILY RECORD RAINFALL TOTAL ON
THURSDAY...WITH 1.62 INCHES. THE PREVIOUS RECORD WAS 0.78 INCHES
IN 1912. THE TWO DAY RAINFALL TOTAL OF 4.68 INCHES IS THE SECOND
HIGHEST TWO DAY TOTAL ON RECORD SINCE 1905 FOR ROCKFORD...NEXT TO
5.83 INCHES ON APRIL 20-21 1973. FURTHERMORE...7.53 INCHES OF RAIN
HAVE FALLEN DURING THE MONTH...WHICH ALREADY MAKES THIS THE
FOURTH WETTEST APRIL ON RECORD. THE 7.53 INCHES OF RAIN IS ALSO
MORE THAN DOUBLE THE NORMAL 3.35 INCHES FOR THE ENTIRE MONTH OF
APRIL. IN ADDITION...15.89 INCHES OF PRECIPITATION HAVE FALLEN
ALREADY IN 2013...WHILE JUST 23.35 INCHES FELL IN ALL OF 2012.

IN CHICAGO...THE 3.54 INCHES OF RAIN ON THURSDAY DID NOT SET A NEW
DAILY RECORD...BUT IT WAS THE SECOND RAINIEST APRIL DAY ON
RECORD...UNDER THE 3.83 INCHES ON APRIL 18 1975. THE TWO DAY TOTAL
OF 5.55 INCHES SHATTERS THE PREVIOUS RECORD TWO DAY TOTAL IN THE
MONTH OF APRIL FOR CHICAGO. THE PREVIOUS RECORD TWO DAY TOTAL
OCCURRED APRIL 4-5 1947. THE 7.83 INCHES OF RAIN THAT HAVE FALLEN
THIS MONTH ALREADY MAKES THIS THE THIRD WETTEST APRIL ON
RECORD...AND JUST 0.01 INCH UNDER THE SECOND WETTEST APRIL OF
1975. THE 7.83 INCHES OF RAIN IS ALSO MORE THAN DOUBLE THE 3.38
INCHES THAT IS NORMAL FOR THE ENTIRE MONTH OF APRIL. IN
ADDITION...16.42 INCHES OF PRECIPITATION HAVE ALREADY BEEN
RECORDED IN 2013...WHILE 26.91 FELL IN ALL OF 2012.

$$

RC
This was a classic setup for heavy rain across not only the immediate area but across eastern and southern Iowa, northern Missouri, and parts of lower Michigan. When predicting and analyzing heavy rainfall, research and forecasting experience have shown these elements as critical:
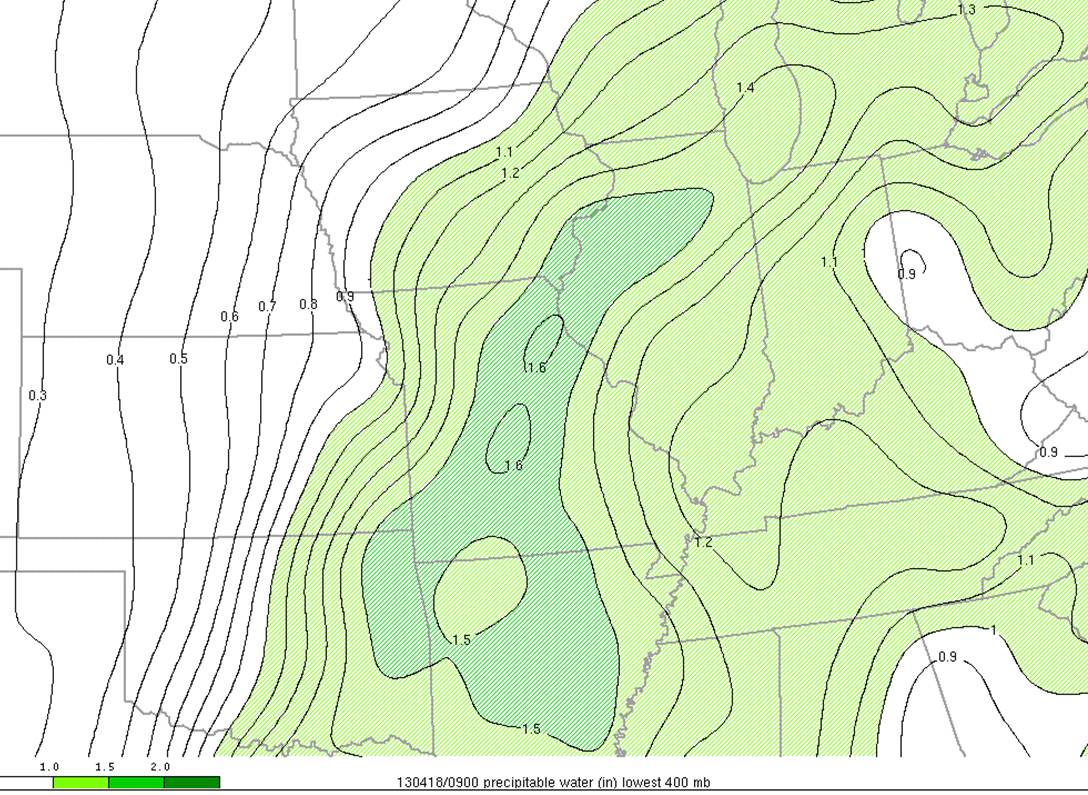
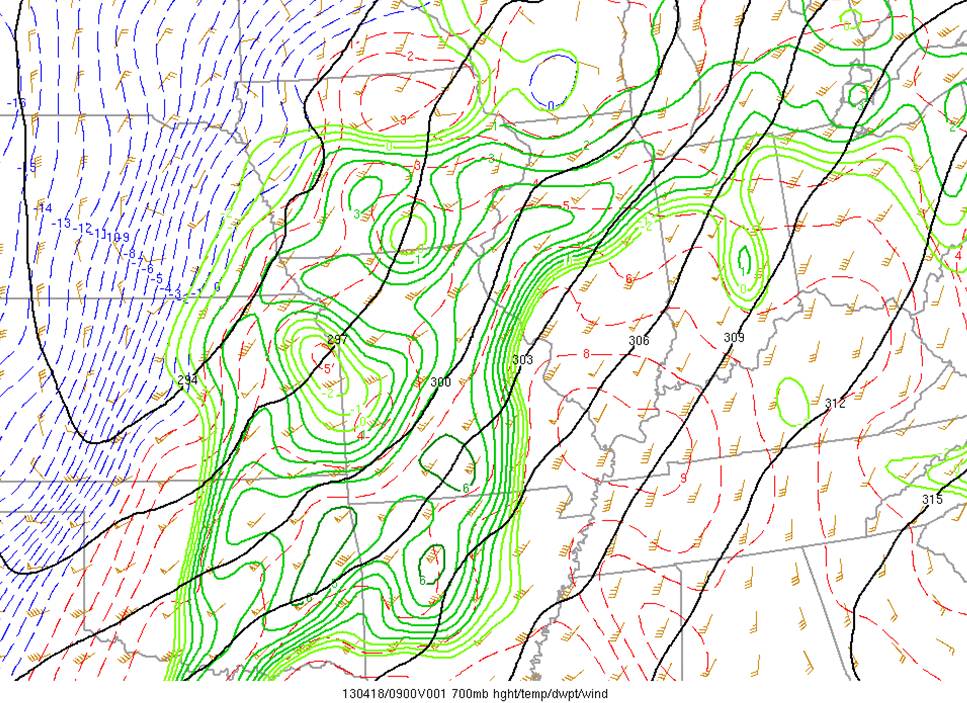
All of these were established over the region from late afternoon on the 17th through the morning of the 18th, which was truly the heart of the heaviest rainfall. This also was all coming on the heels of an inherently wet ground from rounds of rain earlier in the week (see below). In terms of moisture content/concentration, here is a look at deep layer moisture (precipitable water) and 700 mb dew points.
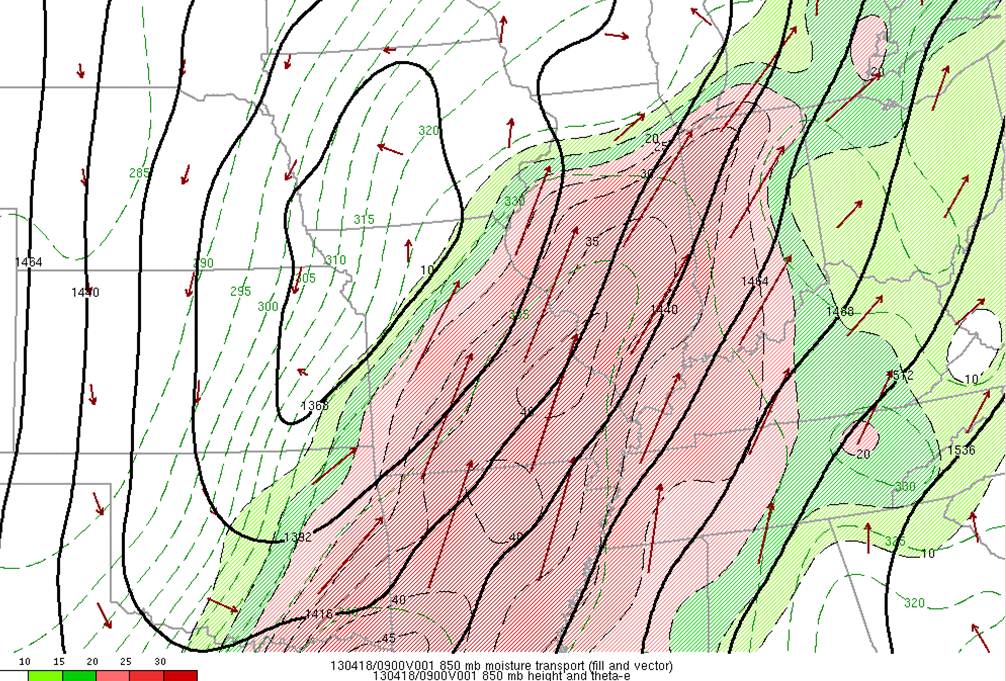
The atmosphere, much like a wash cloth, can literally be "rung out". In fact, precipitable water above basically means if the atmospheric column above that point was "rung out", then that is how much rain would fall. So why did we receive 4-7 inches of rain when precipitable waters were around an inch and a half? That is because the moisture which condensed through lift and fell through precipitation was continuously replenished. The means of replenishment were a low-level jet from the Gulf of Mexico region, which often is the case for heavy rain events in this area. One variable that can quantify the degree of moisture movement is moisture transport, which basically is the magnitude of moisture multiplied by the wind speeds. This is a look at that variable at 850mb (~5,000 ft).
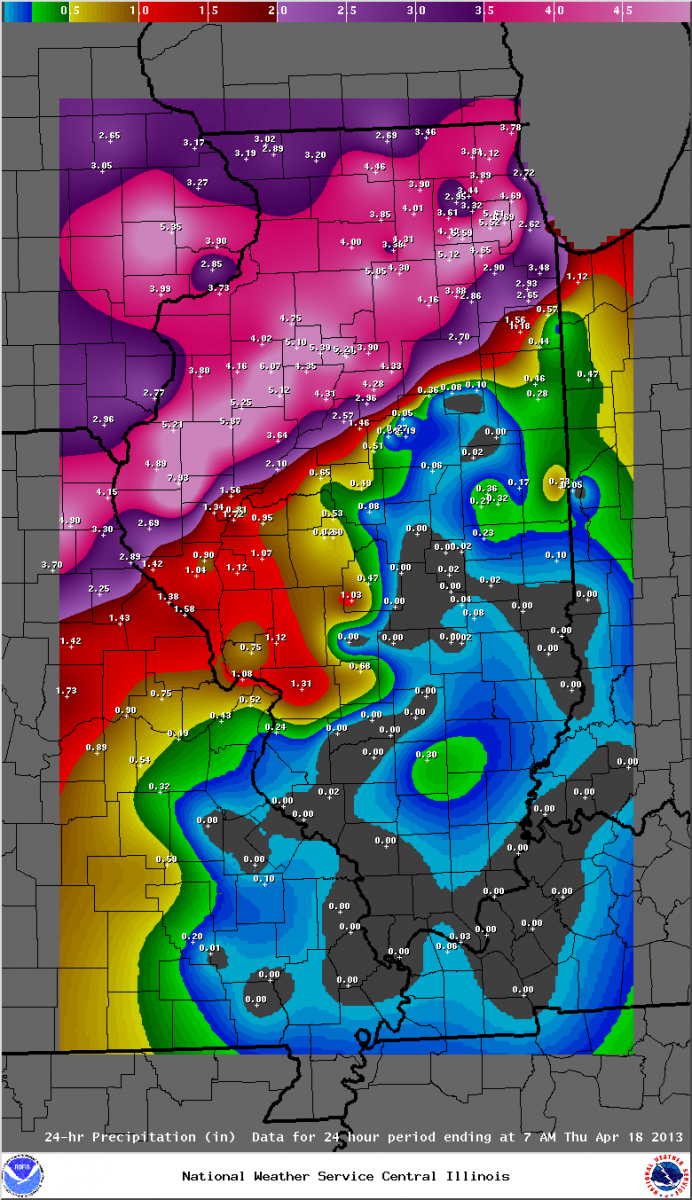
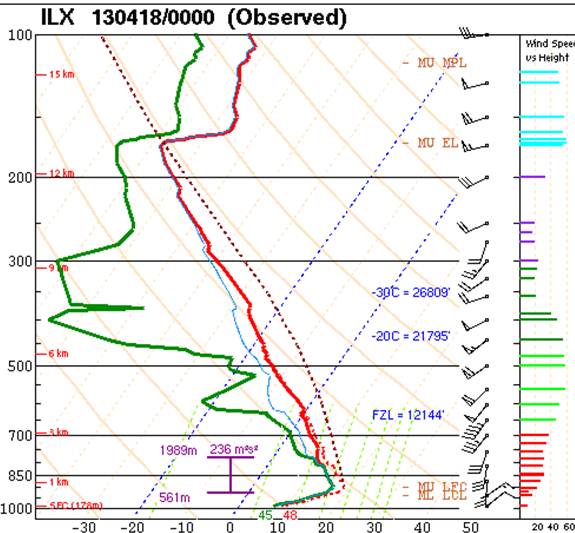
Note in the above image how the moisture transport quantities (shown in contours or vectors) rapidly diminish in a small area across northern Illinois. This is a direct representation of moisture convergence or a focus for moisture pooling. This focus was along a stationary front aloft, or a "battle zone" between the warmer air to the south and cooler air to the north. Such a focus can not only help to develop precipitation by causing convergence and lift, but also cause it to be persistent if the focus itself does not shift. Such was the case during the night of April 17th and into the morning of the 18th. Important to push a heavy rain event into a major flash flood event is rainfall rate. While rates can simply be enhanced by rainfall droplet concentration alone (an artifact of moisture concentration/content discussed above), thunderstorms can often play a key role. Storms were plentiful in this event, especially on the night of the 17th. There were over 10,000 cloud-to-ground lightning strikes across the state of Illinois on Wednesday night! Under these were heavier precipitation rates at or in excess of one inch per hour. The magnitude and concentration of moisture in the atmosphere can simply be more when the atmosphere is warmer. Meteorologists look for "warm cloud processes" when saturation is seen through a deep layer above freezing. Here is a look at the weather balloon launch data from Lincoln, IL on the evening of the 17th. This captures the upstream atmosphere into northern Illinois that night. Note that much of the layer below the 12,000 ft freezing level is saturated.
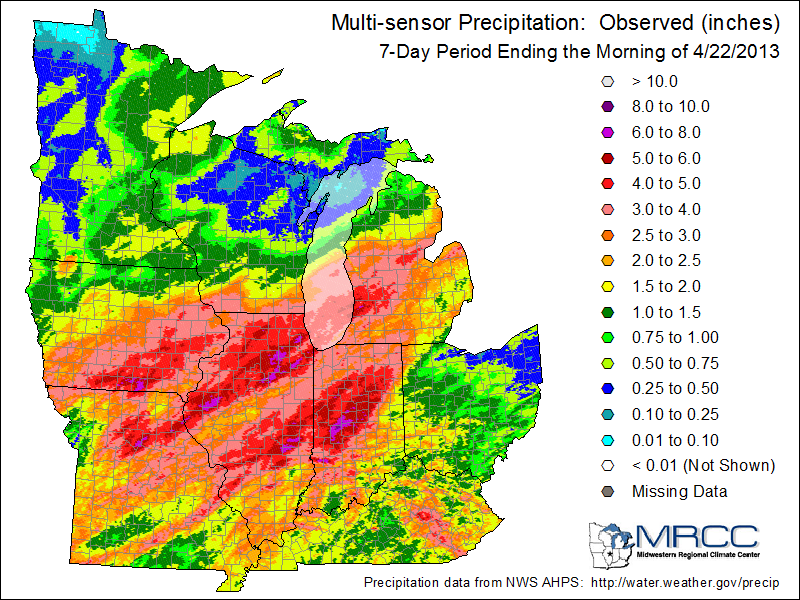
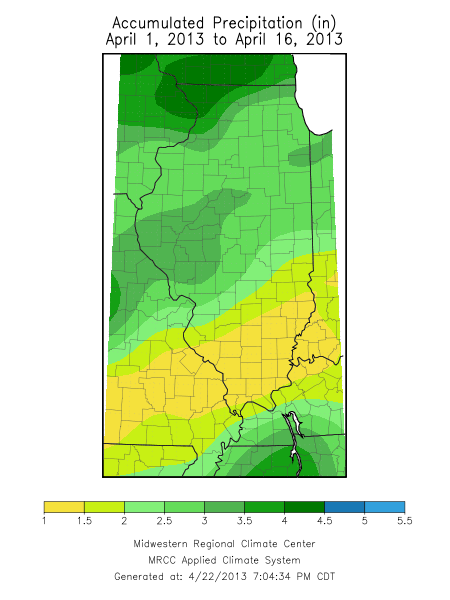
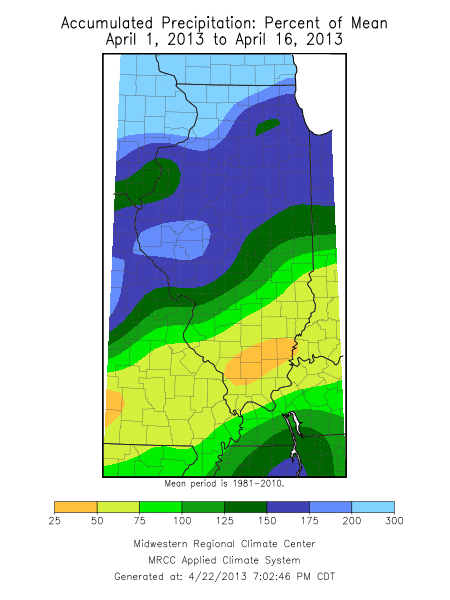
The ground has already been somewhat primed due to a wet pattern earlier in April, particularly during the 8th-11th. Here is a look at precipitation during the first half of April across Illinois.
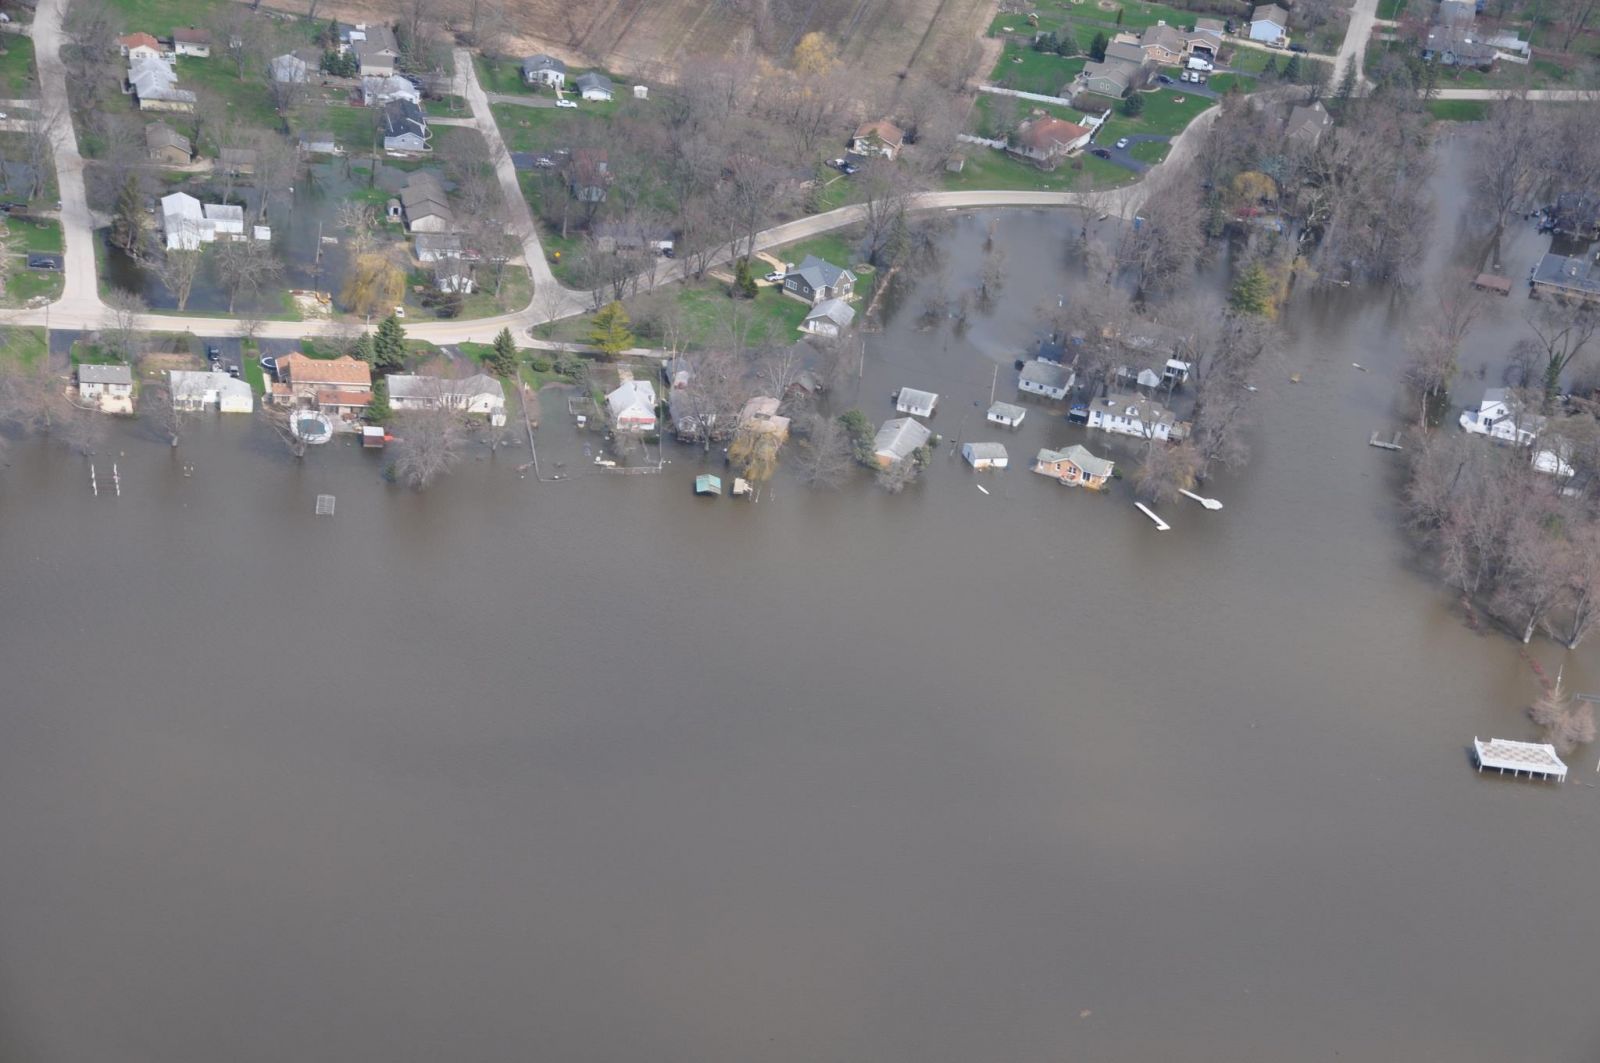
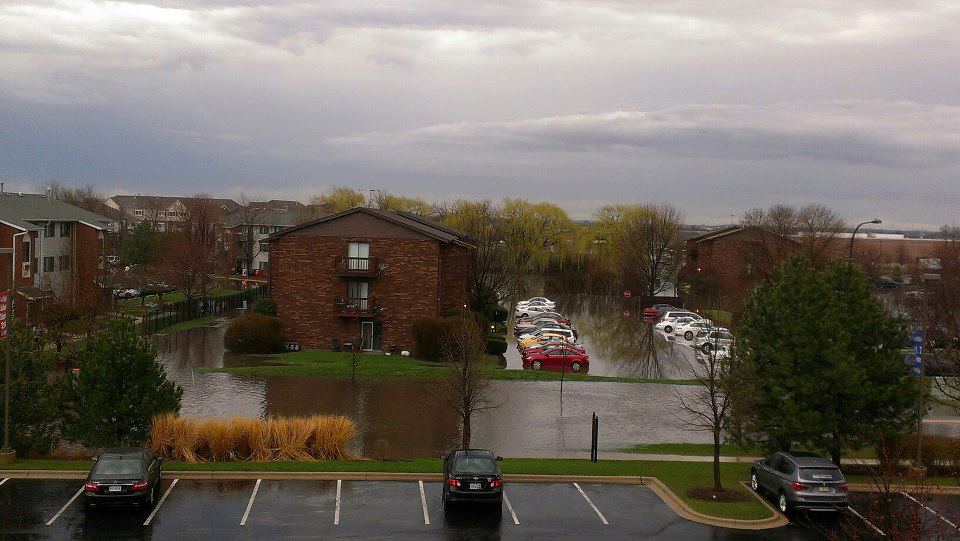
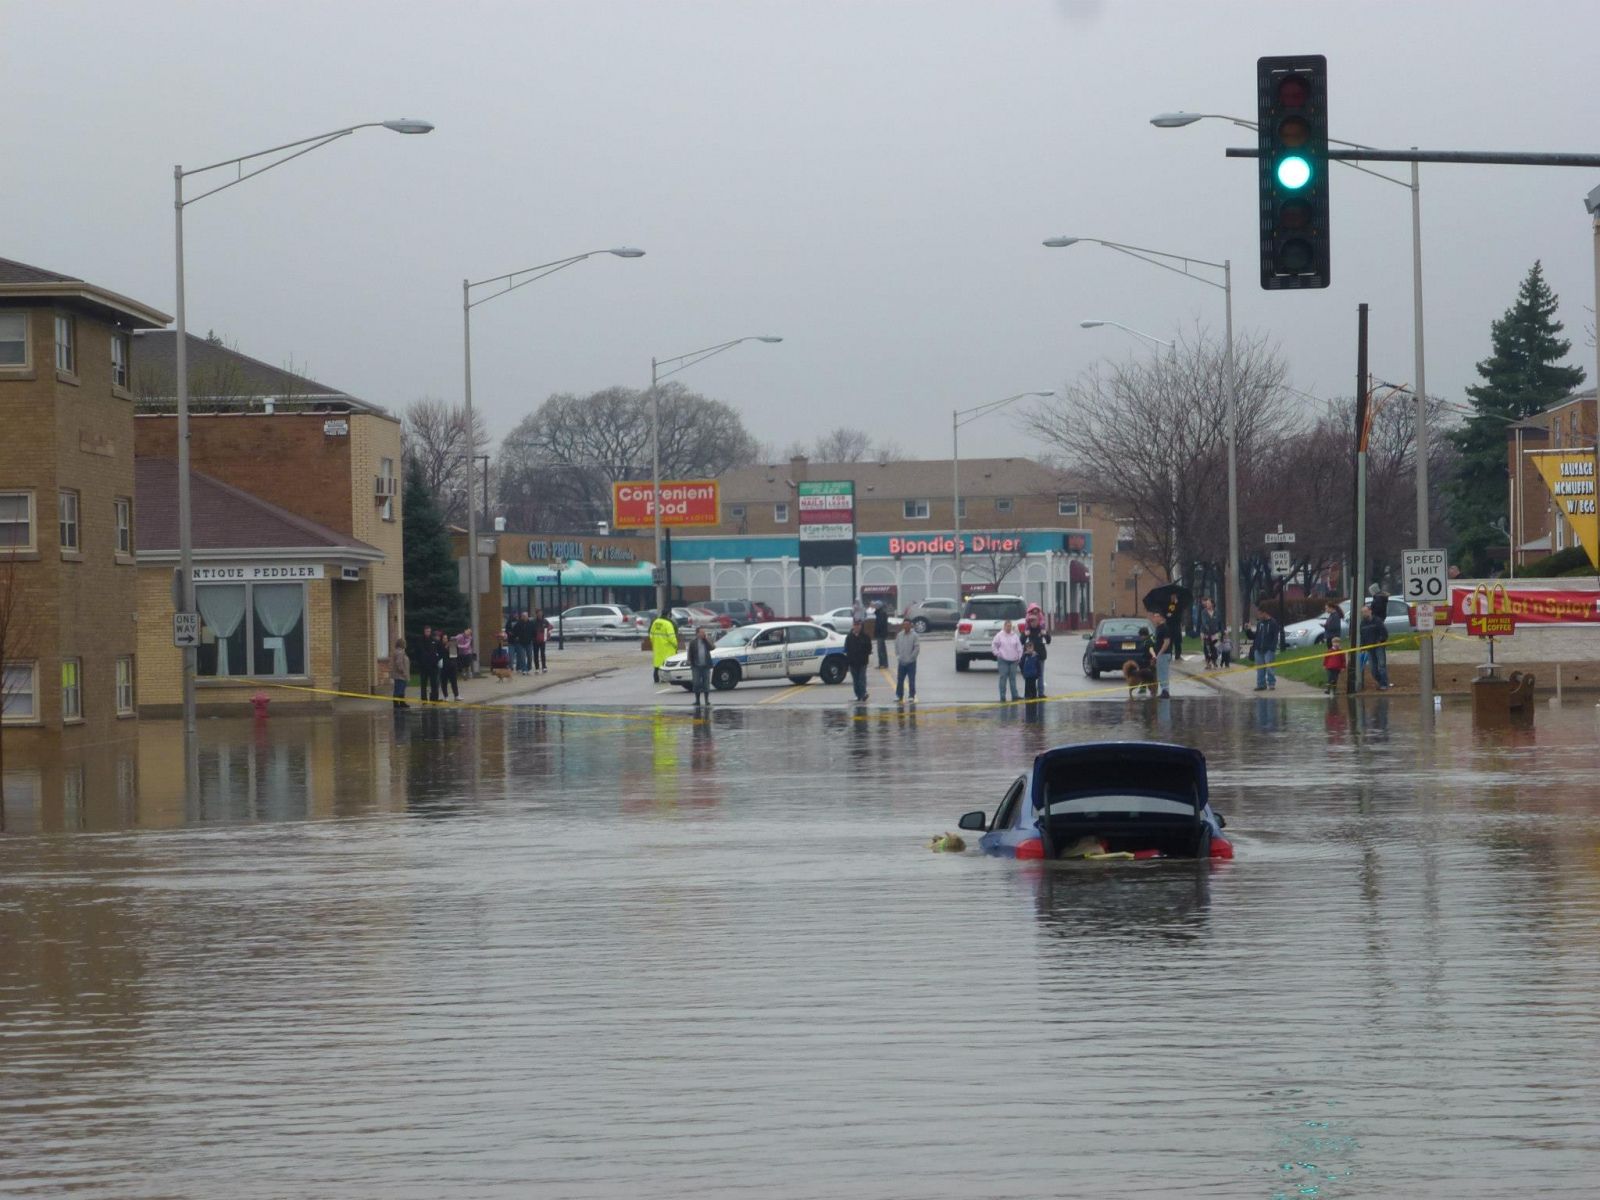
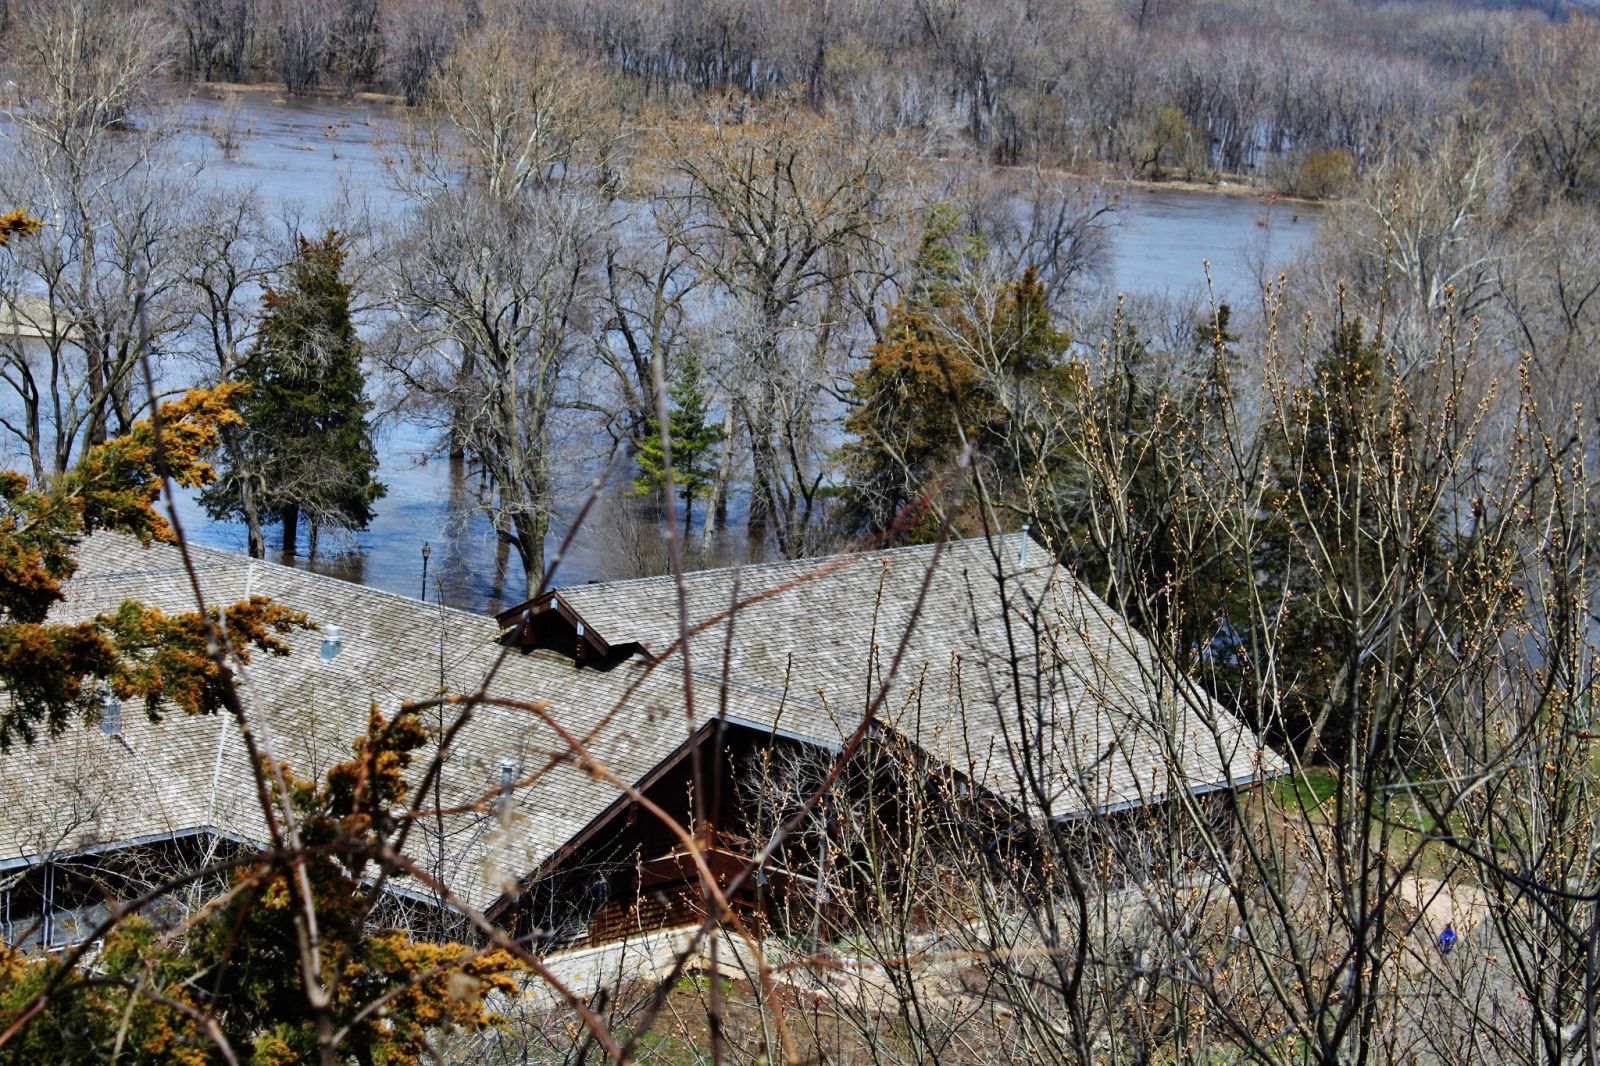
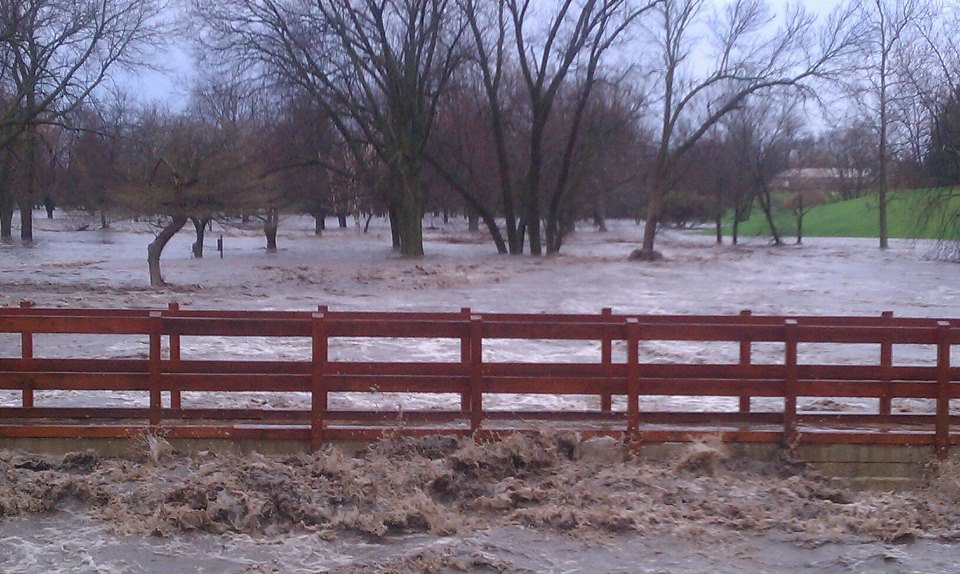
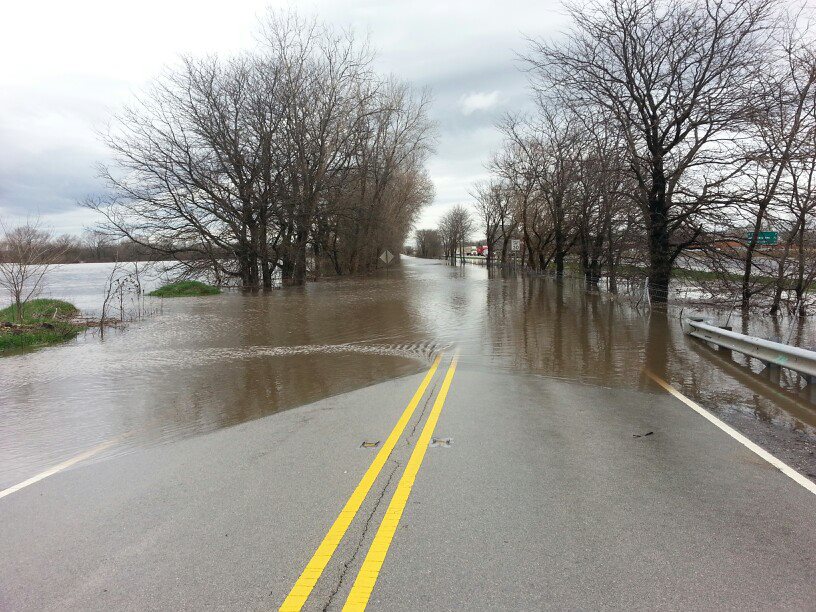
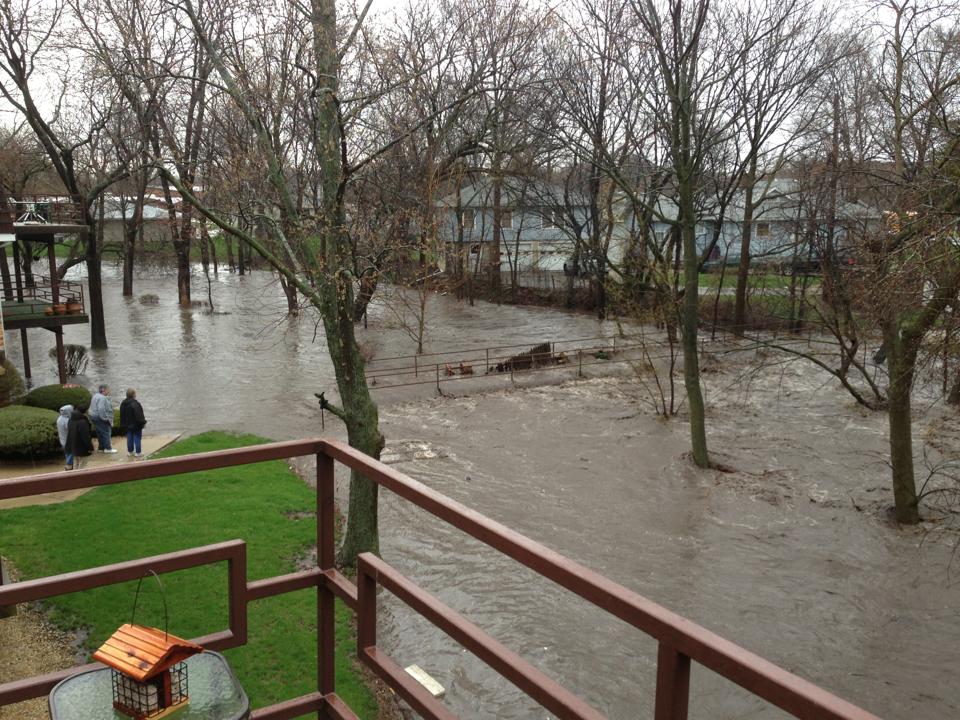
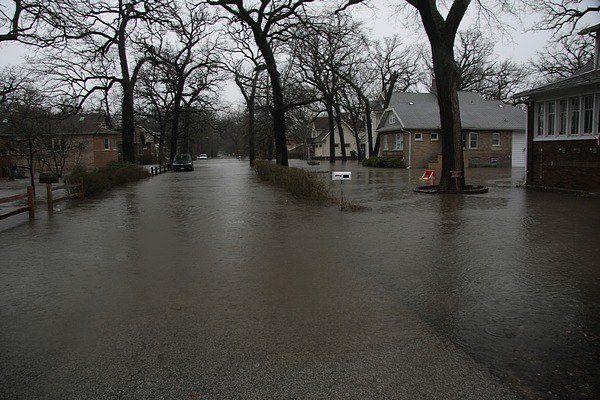
Click to go to NWS Chicago Facebook Page Flood Photo Album
|
||||||||||||||||||||||||||||||||||||||||||||||||||||||||||||||||||||||||||||||||||||||||||||||||||||||||||||||||||||||||||||||||||


 Follow us on YouTube