Fast Facts | Overview | Historical Context | Snowfall Map | Amounts | Photos | Service
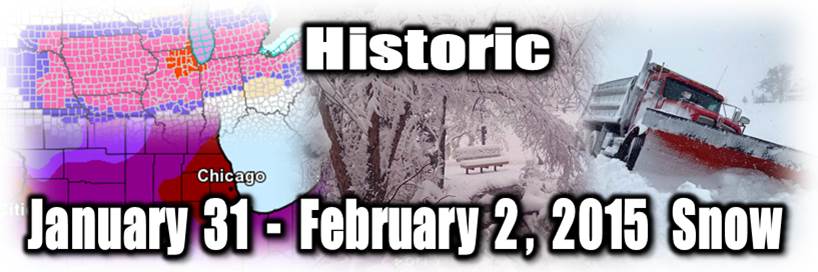
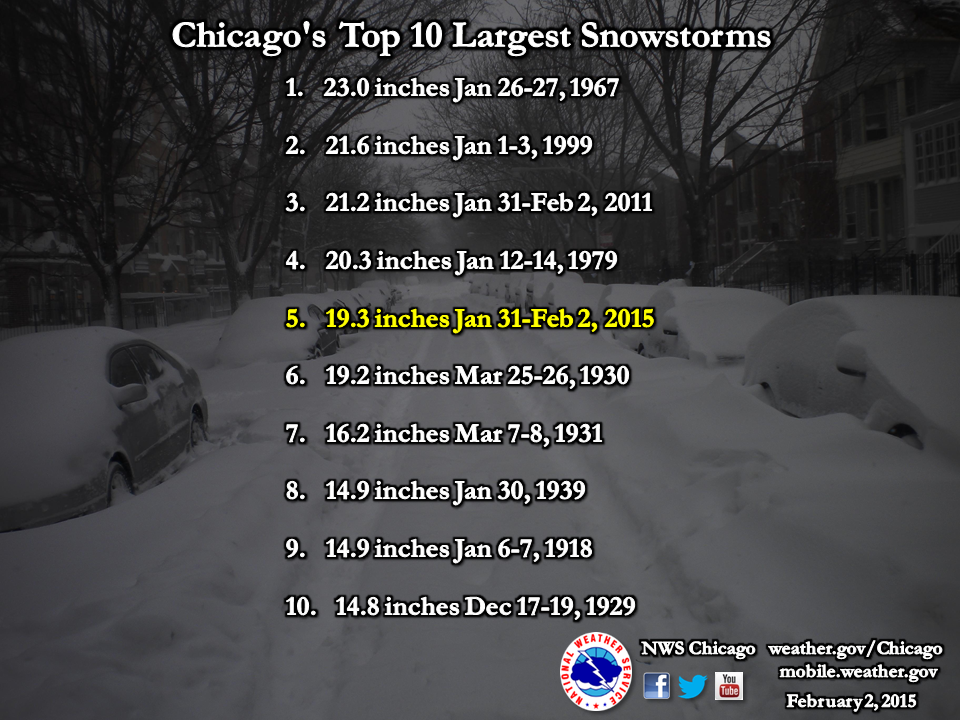
Chicago saw 19.3" of snow at O'Hare which ranks as #5 out of all snowfall events for Chicago. The 16.2 inches recorded on February 1st were the most ever for any February day in Chicago. The snow total on February 1st also made it the 4th snowiest day in any month on record in the city. Likewise, the 0.87" of liquid-equivalent precipitation was a record for the day, exceeding the 0.77" measured on 1 February 2011. There were 33 consecutive hourly observations in which snow was reported at O'Hare.
NWS Chicago saw 15.3" of snow and the Midway Airport 3SW Cooperative observer saw 19.2" of snow.
Across northern Illinois and northwest Indiana the winter of 2014-2015 had been relatively quiet through the end of January with only a handful of light snow events. As of January 30th, Rockford had received only 11.8 inches of snow for the season, while Chicago had received only 15.5 inches. However, starting on the evening of Saturday January 31st and continuing through Sunday February 1st in Rockford and into Monday the 2nd in Chicago, both locations received more snow in just over a day than they had all season.
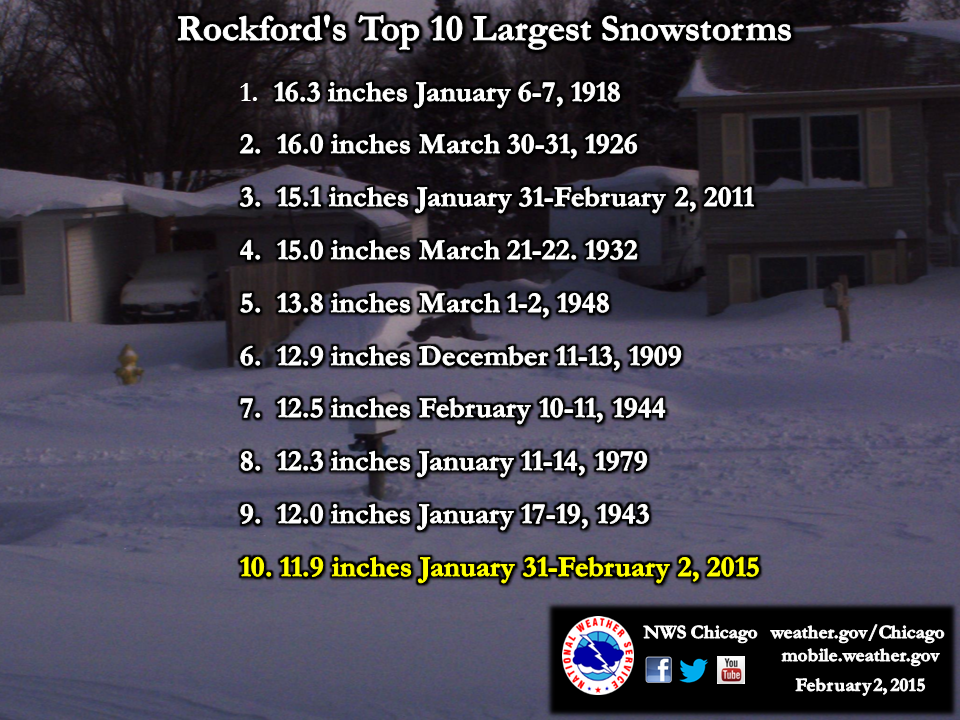
The 16.2 inches recorded at O'Hare just during the hours of February 1st (out of 19.3 inches total) were the most ever for any February day in Chicago. The 10.5 inches recorded on February 1st at Rockford (out of 11.9 inches total) ranked #2 all time for the date and #3 all time for any February day in Rockford. For the event as a whole, the 19.3 inches at O'Hare ranks as #5 out of all snow events in Chicago, while the 11.9 inches at Rockford ranks as #10 overall for that city.
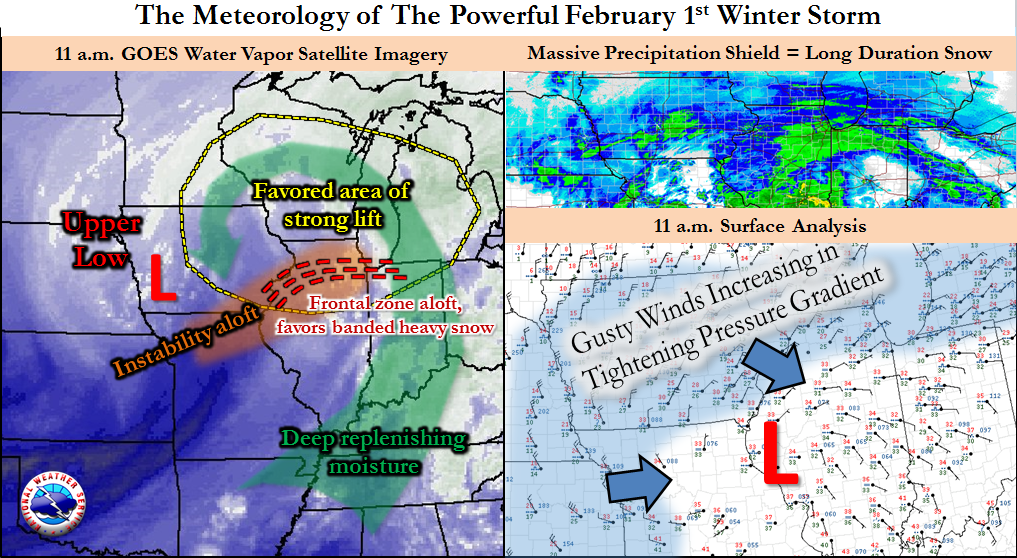
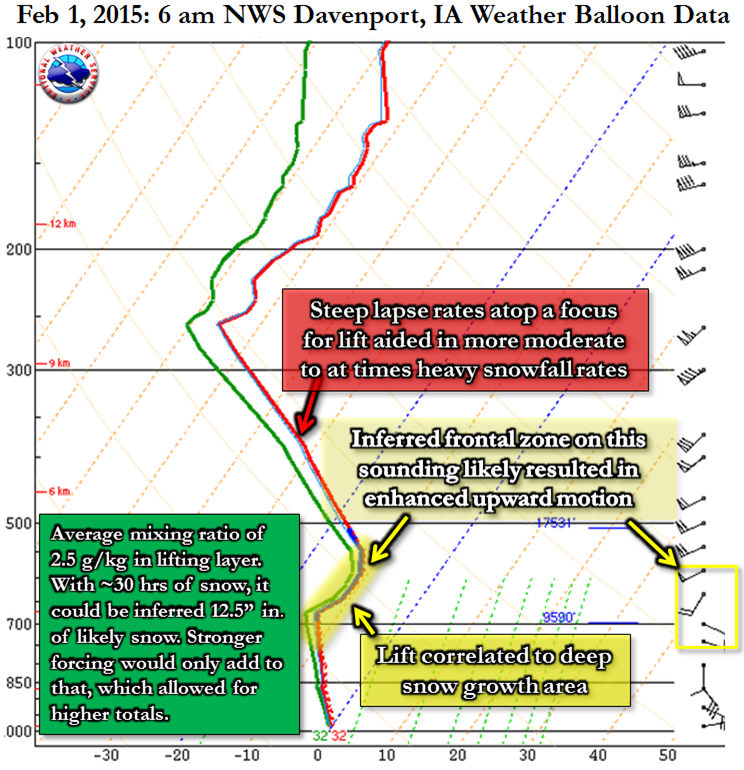
Several ingredients came together to produce this significant snowfall total. A deepening center of low pressure lifting from the Southern Plains through the Ohio Valley pulled rich moisture out of the tropical Pacific Ocean and the Gulf of Mexico and wrapped it into cold Arctic air. Early in the event the relatively mild surface temperatures in the 30s kept snow-to-liquid ratios on the lower end of the spectrum, or close to 10-to-1. As the event progressed and colder air spread into the region, the snow evolved from wet and heavy to very light and fluffy as ratios eventually increased to 30-to-1 or higher. At O'Hare the liquid precipitation total of 0.87" on Sunday was a record for February 1st, exceeding the previous record of 0.77" measured during the Groundhog Day Blizzard of 2011. Had snow-to-liquid ratios been higher earlier in this event, snowfall totals could have approached or exceeded those from the 2011 event.
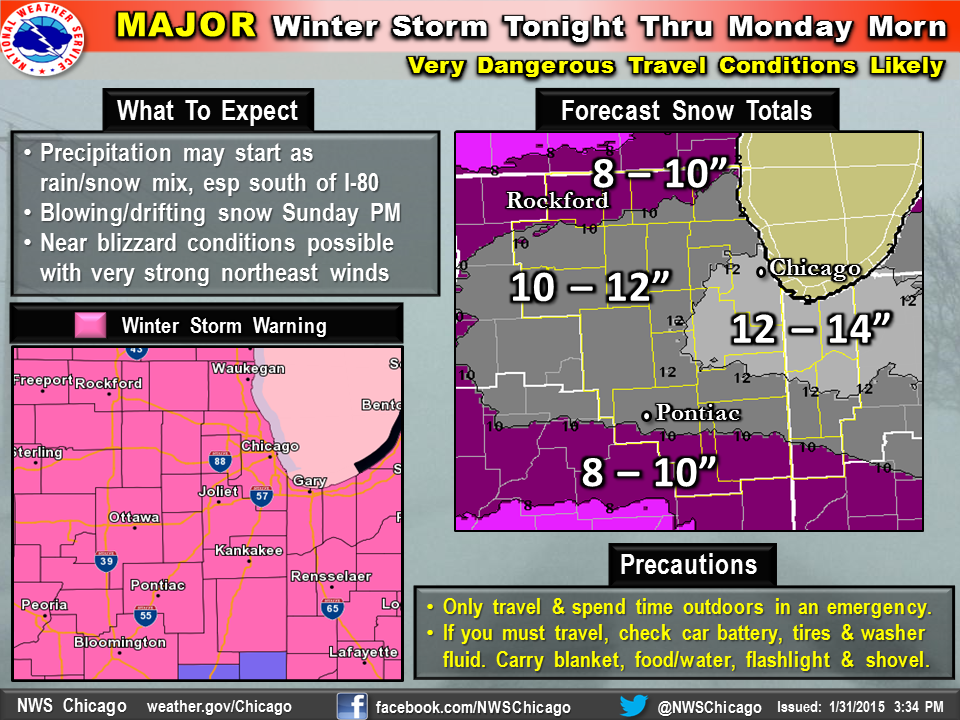
A tightening pressure gradient around the low center as it moved from central Illinois into central Indiana also supported strong and gusty northeast winds later Sunday afternoon into the evening, producing a period of blizzard to near blizzard conditions with gusts over 35 mph and visibilities around 1/4 mile or less in many locations.
|
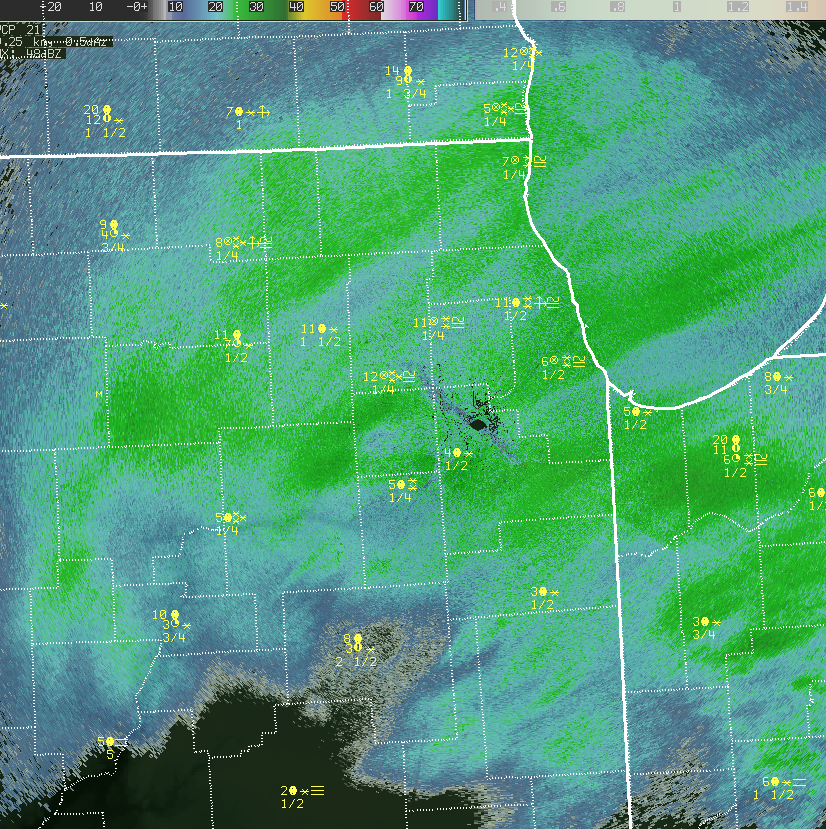
Regional Radar Loop Through Duration of the Event |
 |
|
A rich moisture plume is noted from the eastern Pacific into the Midwest, with even some Gulf of Mexico moisture tapped later in the day Saturday. High moisture values for a system this far north helped to produce a very persistent, long duration, and overall efficient snowfall all the way through early Monday morning. |
|
GOES Water Vapor Imagery from January 31st: 6 am - 4 pm |
 |
|
A rich moisture plume is noted from the eastern Pacific into the Midwest, with even some Gulf of Mexico moisture tapped later in the day Saturday. High moisture values for a system this far north helped to produce a very persistent, long duration, and overall efficient snowfall all the way through early Monday morning. |
Storm Total Ranking
Chicago: #5
Rockford: #10
|
Chicago |
Rockford |
|
|
|
Calendar Day Ranking for all February
Chicago: #1
Rockford: #3
|
Chicago |
Rockford |
1 16.2 2/ 1/2015
2 13.6 2/ 1/2011
3 12.6 2/ 9/2010
4 11.1 2/18/2000
5 11.0 2/ 3/1896
6 10.8 2/ 3/1901
7 9.7 2/10/1981
8 9.3 2/ 6/1978
9 9.1 2/ 6/1895
10 8.9 2/ 9/1885
|
1 11.5 2/ 6/1911
2 10.9 2/ 1/2011
3 10.5 2/ 1/2015
4 9.7 2/ 6/2008
5 9.6 2/18/2000
  6     8.0    2/26/1912,  2/18/1908,
               2/19/1898,  2/13/1896
10 7.6 2/25/1994
|
Calendar Day Ranking All-Time
Chicago: #4
Rockford: #9
|
Chicago |
Rockford |
|
1 18.6 1/ 2/1999 2 16.5 1/13/1979 3 16.4 1/26/1967 4 16.2 2/ 1/2015 5 14.9 1/30/1939 6 14.4 1/ 6/1918 7 13.6 2/ 1/2011, 3/25/1930 9 12.6 2/ 9/2010 10 11.5 3/ 2/1954
|
1 13.5 3/31/1926
2 13.0 3/ 2/1948
3 12.0 3/23/1897, 1/25/1895
5 11.5 2/ 6/1911
6 11.0 3/21/1932
7 10.9 2/ 1/2011
8 10.6 12/15/1987
9 10.5 2/ 1/2015
10 10.4 3/29/1972
|
Comparing the Top 5 Snowstorms in Chicago

|
Local Snowfall Map (click to enlarge) |
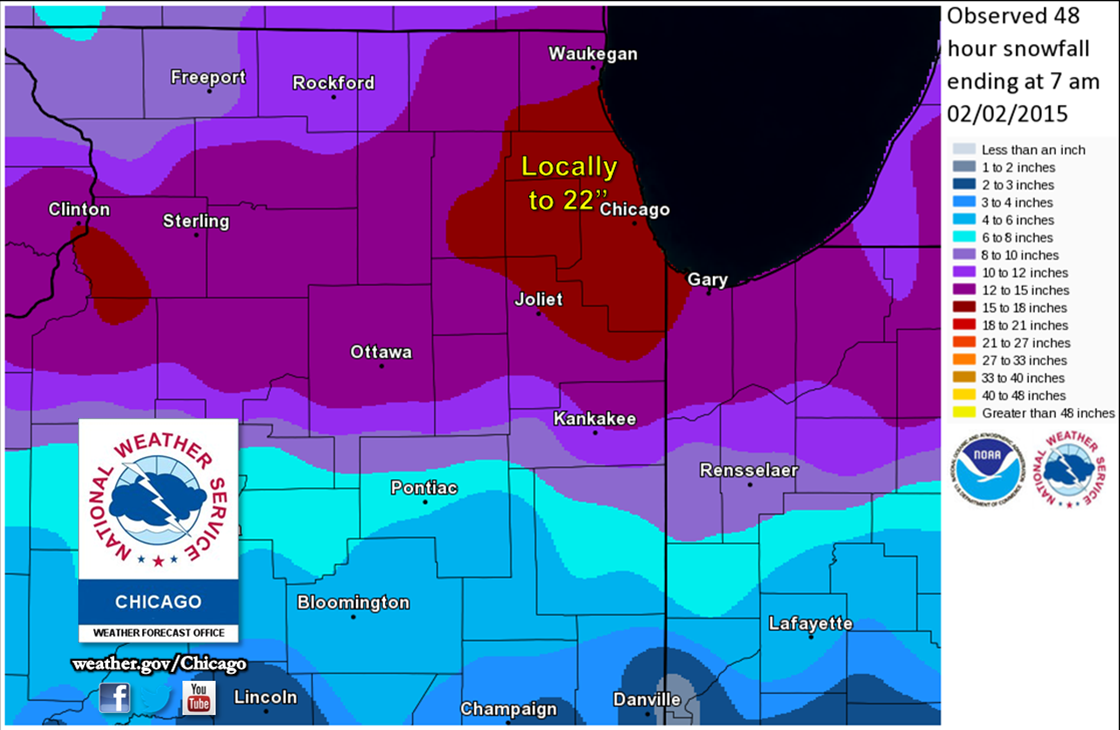 |
| 15-18" were reported around the Chicago metro area with locally higher totals. |
|
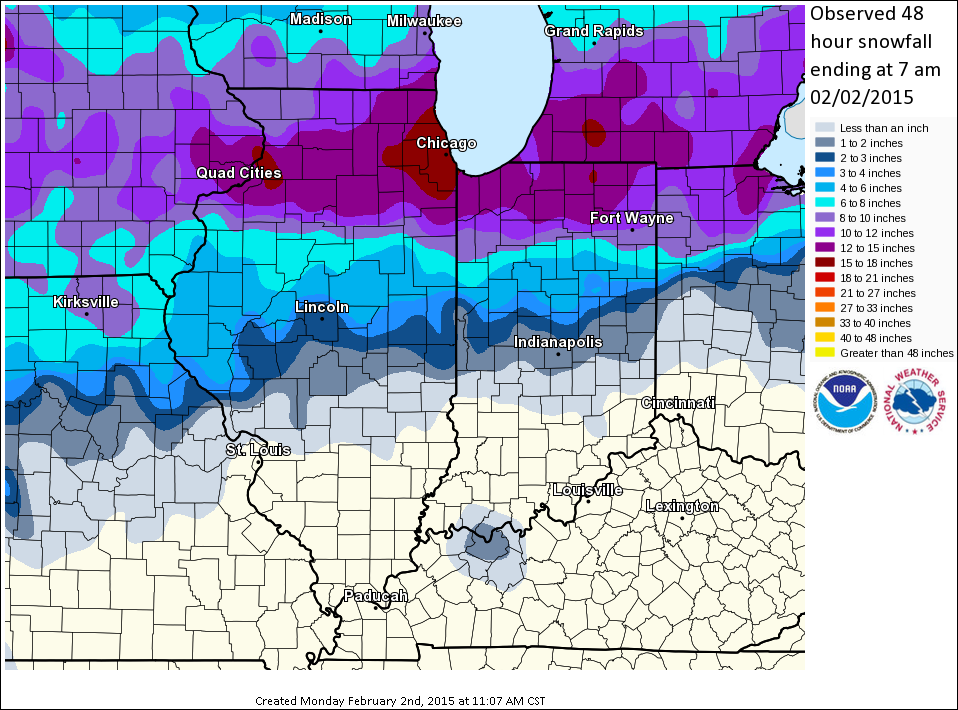
Regional Snowfall Map (click to enlarge) |
 |
|
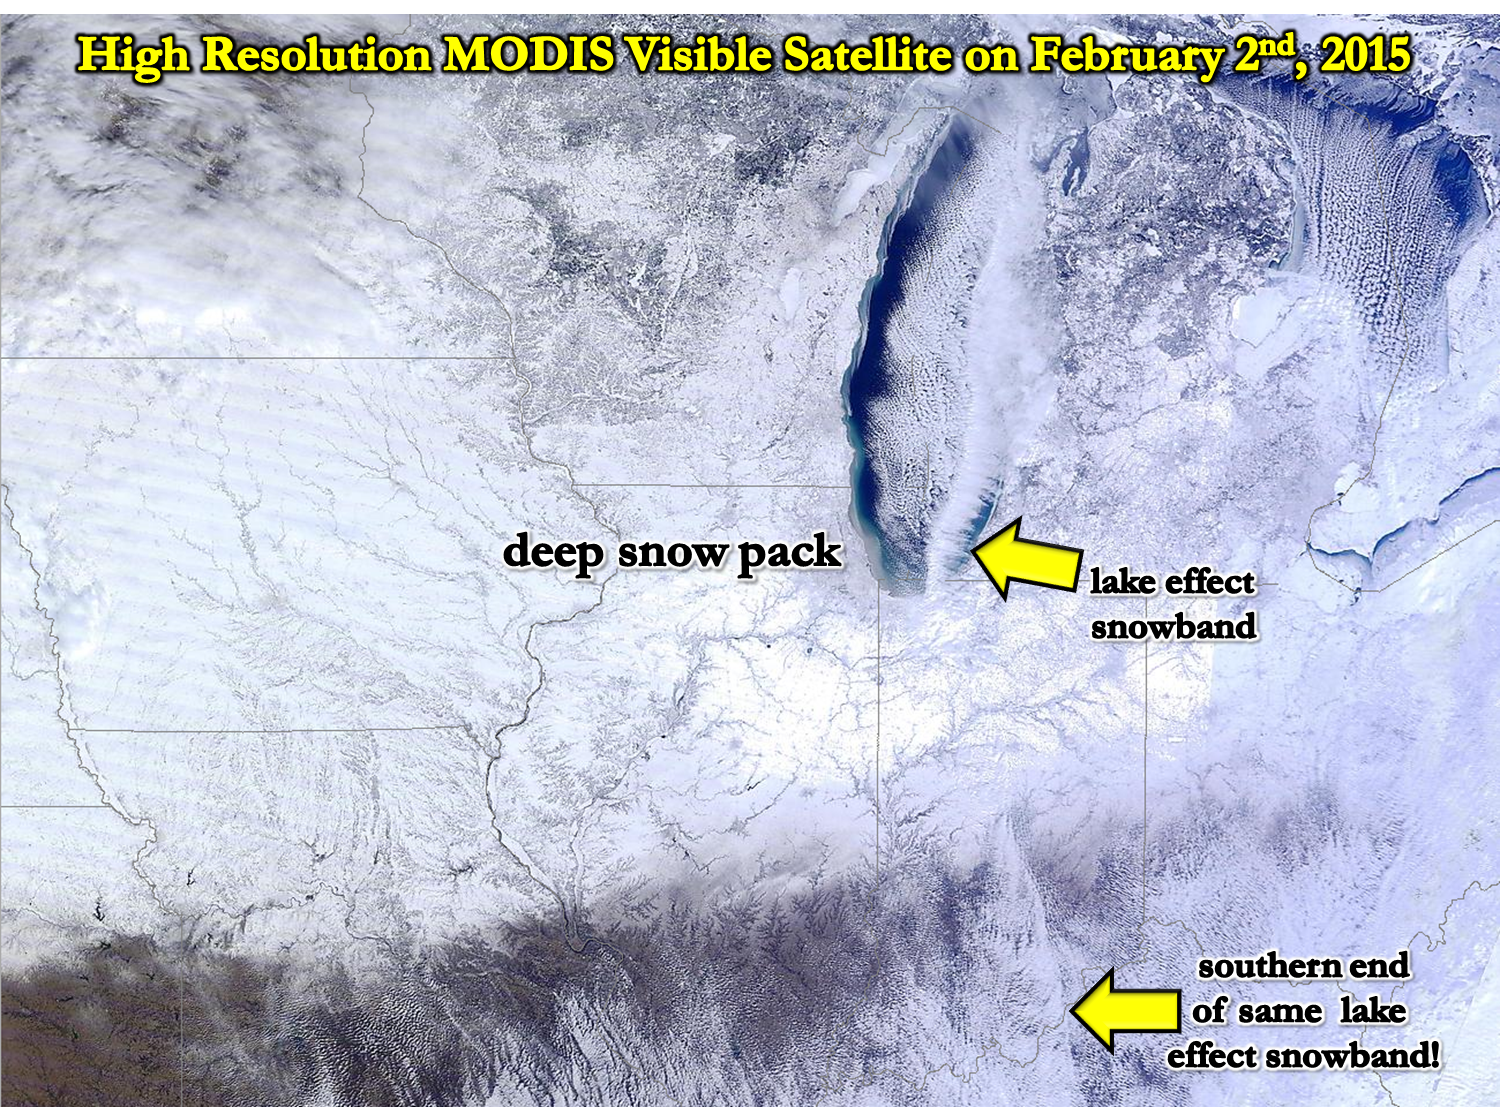
MODIS Visible Satellite Image Showing Extent of Snow |
|
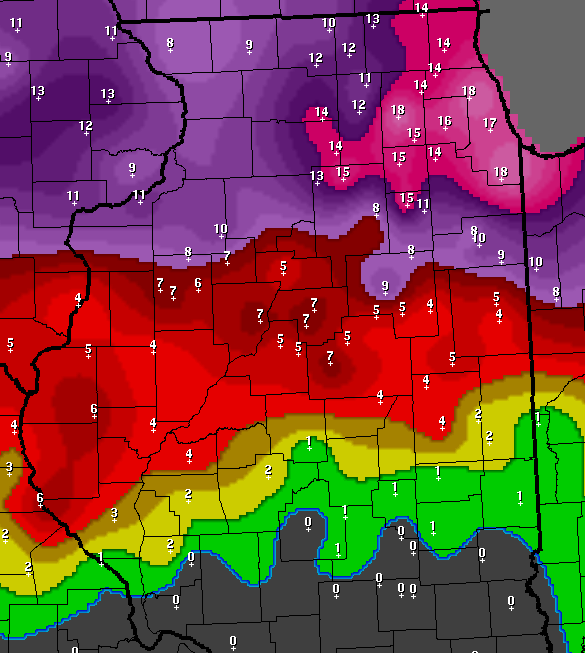
February 2nd Morning Snow Depth |
 |
 |
This visible satellite image to the above left shows the deep snow pack blanketing the area in the wake of the winter storm. Also, the lake effect snow band that resulted in the highest totals in the area being in Cook, Lake IL, and DuPage counties, can clearly be seen extending into northwest Indiana. This brought occasional moderate to heavy snow to Porter County into the late morning of February 2nd. Most interestingly, strong convergence (winds of opposing directions coming together) allowed the band to extend all the way through Indiana into northern Kentucky!
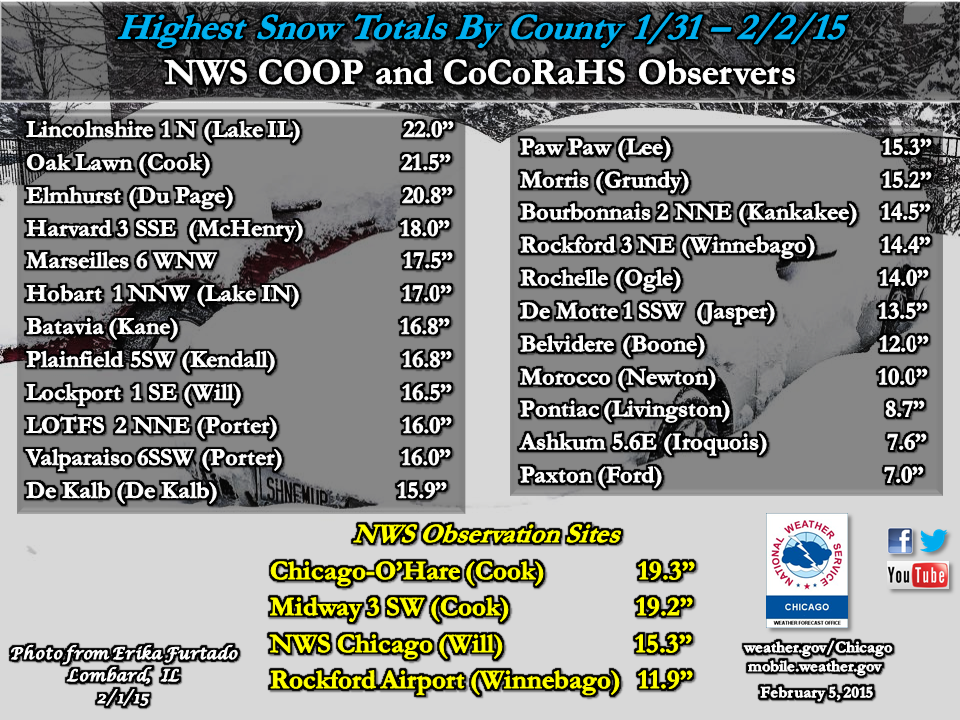
Snowfall Amounts and Maximum Observed Wind Gusts
|
 |
 |
Text Listing of COOP & CoCoRaHS Observers Snowfall Amounts: PDF
Spotter Snowfall Reports: PDF
Maximum Observed Wind Gusts During the Winter Storm: PDF
|
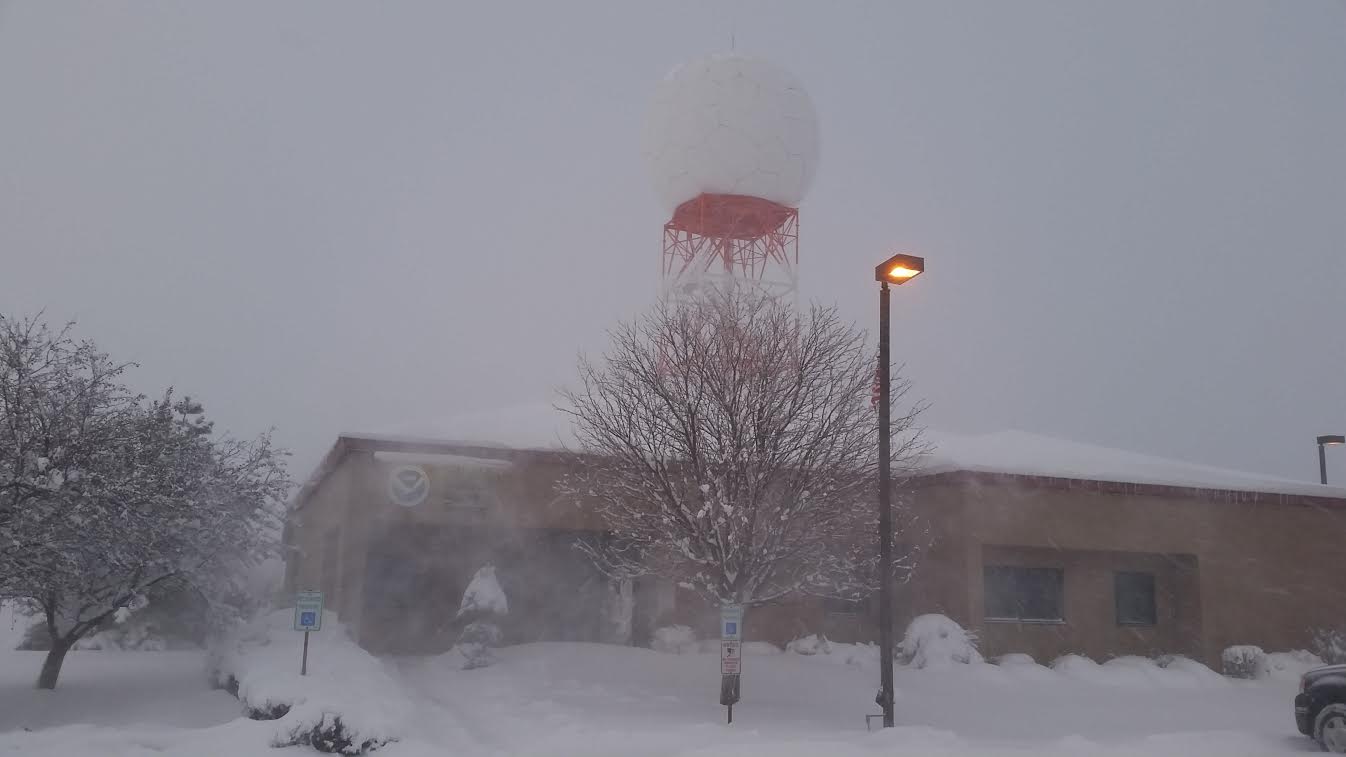
Low Visibility at NWS Chicago on Feb 1st |
Low Visibility at NWS Chicago on Feb 1st |
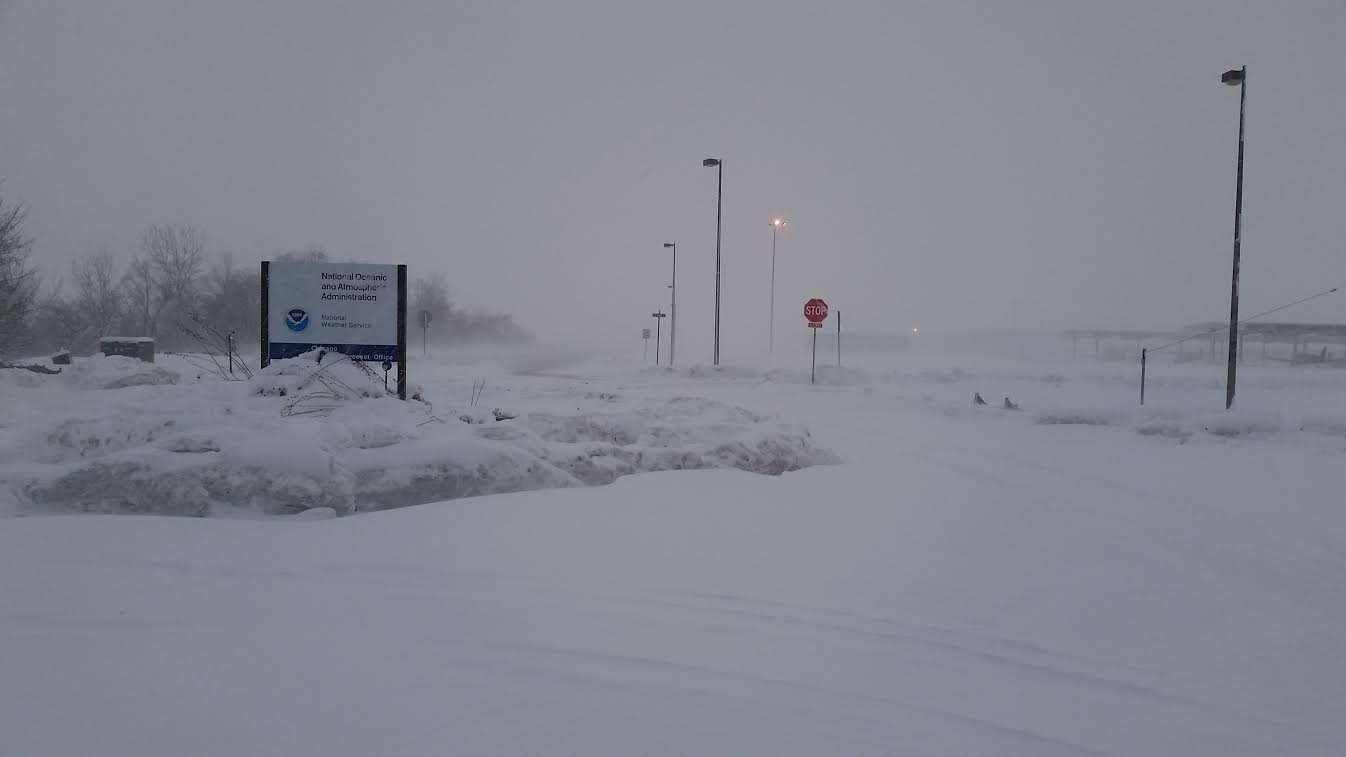
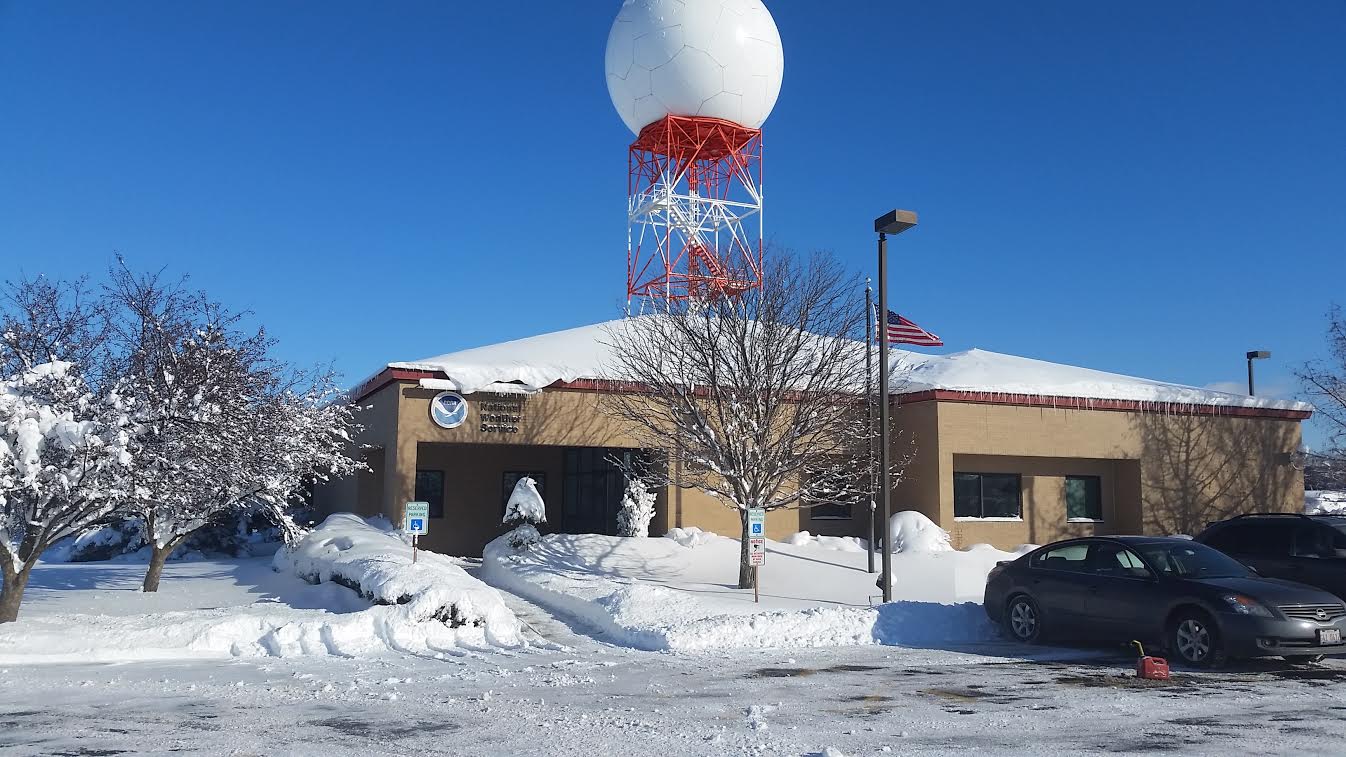
Deep Snow Cover at NWS Chicago on Feb 2nd |
 |
 |
 |
Winter Storm Photo Album on Facebook
|
|
 |


 Follow us on YouTube