
A coastal storm continues to bring heavy rain, coastal flooding, high surf, dangerous rip currents, and gusty winds to the East Coast into early Tuesday. A heavy rain and flash flood risk continues for the Southwest/Four Corners region with lingering tropical moisture through Monday. Typhoon remnants are causing strong winds, heavy rain, and coastal flooding across western Alaska through Monday. Read More >
|
El Niño and Washington DC-Baltimore Winters
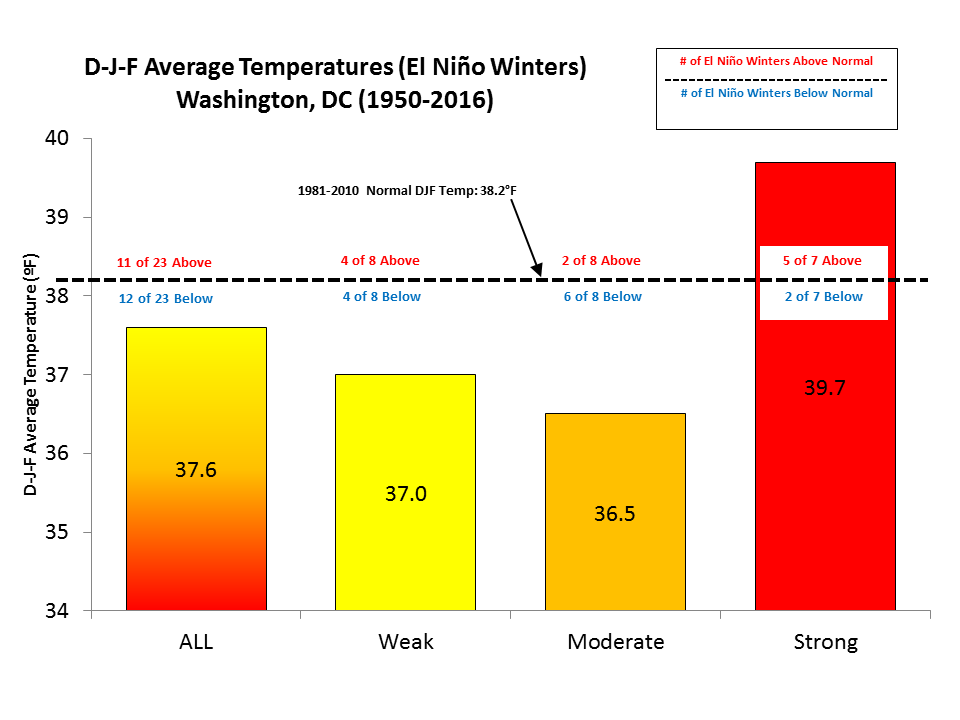
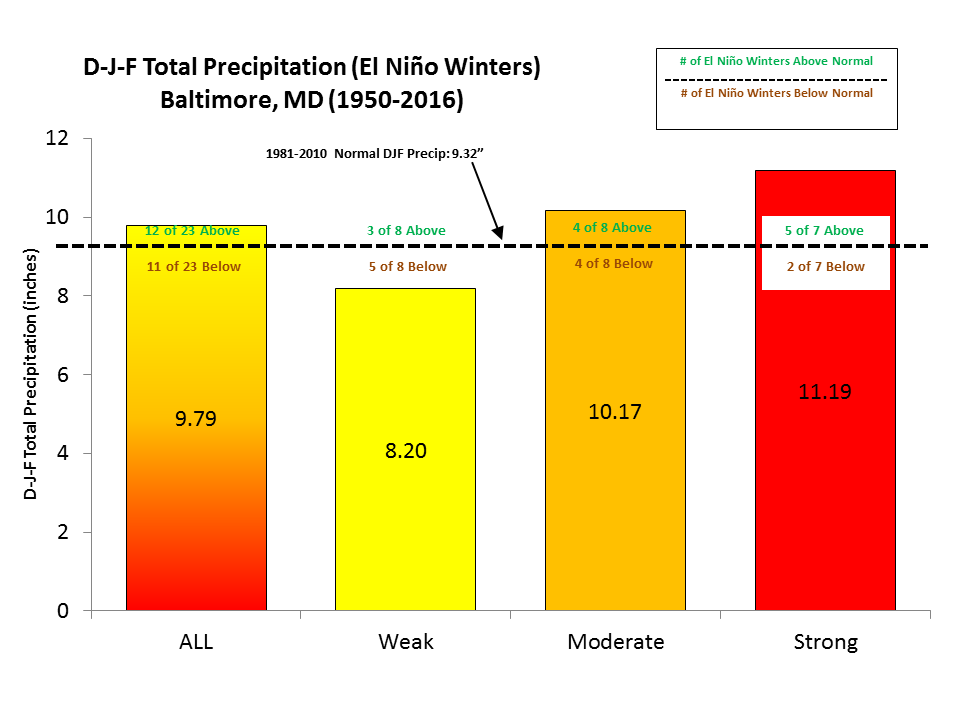
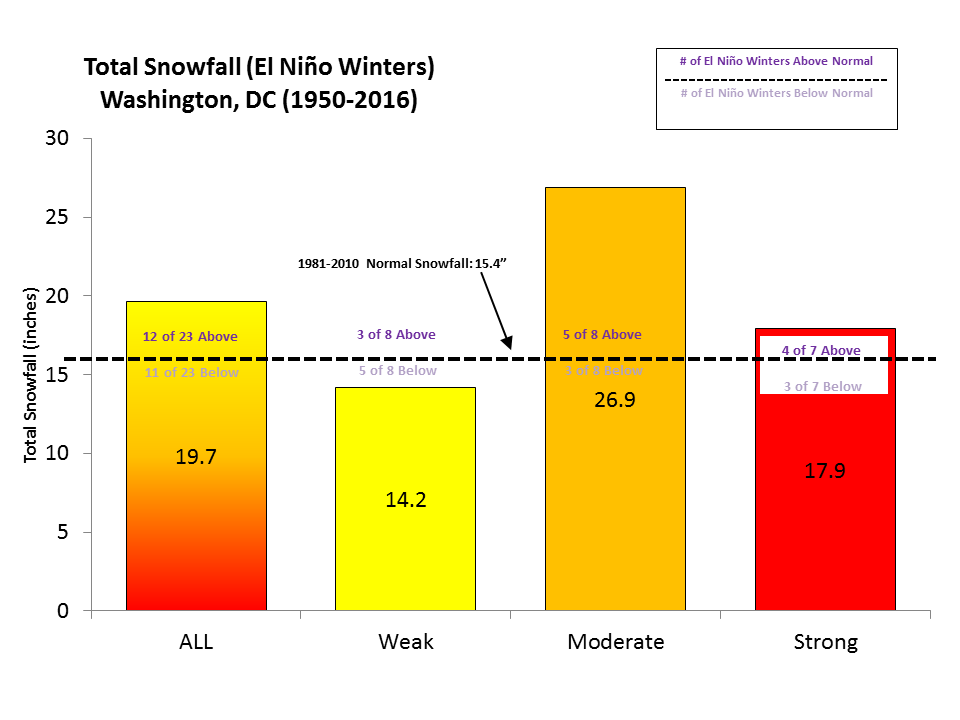
El Niño, which is a climate phenomenon characterized by unusually warm ocean temperatures in the central and eastern tropical Pacific Ocean, can influence the winter weather across the United States. Looking back at past winters since 1950, approximately 23 winters were influenced by an El Niño episode. The figures below are composites of average December, January and February (DJF) temperatures and precipitation, as well as seasonal snowfall at Washington, D.C. and Baltimore. During El Niño years (independent of strength of episode), both DJF temperatures and precipitation averaged near normal while seasonal snowfall averaged above normal. These composites are further broken down by the strength (weak, moderate and strong) of the El Niño episode. Based on the small dataset, there appears to be some historical correlation between the strength of the warming in the equatorial Pacific Ocean (i.e., El Niño episode) and seasonal temperatures, precipitation, and snowfall locally at Washington D.C. and Baltimore. Weak El Niño winters averaged below normal temperatures and precipitation, while strong El Niño episodes averaged above normal temperatures and precipitation. On average, the stronger the El Niño episode, the warmer and wetter the winters have been. These findings can partly be linked to a stronger than normal sub-tropical jet that typically occurs during moderate to strong El Niño winters, which would favor more active storm systems from the south that draw warm, moist air northward as opposed to the drier Alberta clippers from the northwest. Seasonal snowfall averaged above normal, especially for moderate El Niño episodes.
Not all El Niño winters are alike as many other shorter [e.g., North Atlantic Oscillation (NAO), Pacific-North American Pattern(PNA)] and longer term climate patterns influence the local weather. For example, the moderate El Niño episode during the 2009-10 winter was associated with record-breaking seasonal snowfall in the mid-Atlantic region. Although it might seem (based on the 2009-10 winter) that all moderate El Niño winters in Washington D.C. and Baltimore are linked to above normal snowfall, these atmospheric quantities have been variable each winter. Of the seven strong El Niño winters since 1950, four have been associated with well above normal snowfall while snowfall was virtually absent in the other three winters. The box and whisker plots below show the variability in snowfall during El Niño winters. The top of the boxes represent the 75th percentile value, meaning 75 percent of winters had snowfall amounts less than that value. The bottom of the boxes represent the 25th percentile, meaning 25 percent of winters had snowfall amounts less than that value. The top and bottom of the lines represent the maximum and minimum observed winter snowfall values, respectively. The stars show the median snowfall amounts.
|


 Coastal Flood
 FAQ
FAQ