...Highlights of 2017...
Notice: The Lander observations were not available from August 1st through September 23rd during the reconstruction of Lander's Hunt Field runway. Data for this period is missing for the annual summary, but may be restored by the National Centers for Environmental Information (NCEI) at a later date.
Daily Records: Record Low Temperatures: Rank - Driest to Wettest One Day Precipitation Records: January: 0.46" on the 23rd. * 63 months of September and 16 months of Octobers on record with no snowfall. One Day Snowfall Records (inches): 94.2
Temperature
Precipitation
Snowfall
Wind

Element
Jan
Feb
Mar
Apr
May
Jun
Jul
Aug
Sep
Oct
Nov
Dec
Year
Average High
22.2
39.0
54.0
53.9
65.1
79.1
89.0
M
M
58.1
49.4
33.8
M
Mean High (1981-2010 Normals)
33.1
36.5
47.4
56.4
66.5
77.5
86.8
85.0
72.8
58.5
42.8
31.8
58.0
Average Low
2.3
17.1
29.5
31.0
39.7
48.4
56.4
M
M
29.4
25.1
10.2
M
Mean Low (1981-2010 Normals)
10.2
13.9
23.6
31.3
40.1
48.4
55.6
54.3
44.4
32.7
19.7
9.6
32.1
Average Temperature
12.2
28.1
41.8
42.4
52.4
63.8
72.7
M
M
43.8
37.3
22.0
M
Mean Temp (1981-2010 Normals)
21.7
25.2
35.5
43.9
53.3
63.0
71.2
69.6
58.6
45.6
31.2
20.7
45.1
Departure from Normal
-9.5
2.9
6.3
-1.5
-0.9
0.8
1.5
M
M
-1.8
6.1
1.3
M
Rank: Coldest to Warmest
126 years of record (P.O.R 1892-2017)18
91
122
59
61
89
103
M
M
36
115
69
M

Highest Daily Maximum
48
59
72
75
80
93
95
M
M
75
68
56
95
Date of Occurrence
9
9
18
13
12
20
5,20
M
M
25
23
3
7/5,20
Lowest Daily Minimum
-25
-5
7
20
30
40
47
M
M
17
15
-10
-25
Date of Occurrence
6
3
1
5
19
24
1
M
M
31
8
24
1/6
Number of Days with:
Maximum >= 90°
0
0
0
0
0
3
17
M
M
0
0
0
20*
Maximum <= 32°
25
9
1
0
0
0
0
0
M
0
1
11
47
Minimum <= 32°
31
26
16
18
4
0
0
0
M
23
27
31
176*
Minimum <= 0°
14
5
0
0
0
0
0
0
0
0
0
8
27
Record High Maximums Set or Tied
0
0
1
0
0
0
0
M
M
0
1
0
2
Record Low Maximums Set or Tied
0
0
0
0
1
0
0
M
M
0
0
0
1
Record Low Minimums Set or Tied
0
0
0
0
0
0
0
M
M
0
0
0
0
Record High Minimums Set or Tied
0
1
0
0
0
0
0
M
M
0
2
0
3
* Number of Days is missing most of the data from August and September
Temperature Ranks and Records:
Record High Temperatures:
Record Low Maximum Temperatures:
March: 72 on the 18th.
November: 68* on the 23rd. (*Also a record high so late in the season)
May: 37 on the 18th.
Month: -33 on the 6th.
Record High Minimum Temperatures:
February: 37 on the 10th (tie).
November: 36 on the 18th (tie), 31 on the 27th (tie).
Warmest Months of March on Record
Rank
Year
Average Temperature °F
1
2012
44.2
2
1986
44.1
3
1910
43.0
4
2007
42.2
5
2017
41.8
6
1992, 1918
41.6
8
1972
40.9
9
2015
40.0
10
1934
39.4
Top Ten Warmest Years on Record
Rank
Year
Average Temperature °F
1
2012
49.0
2
1988, 1981
47.7
4
1934
47.6
5
1994
47.5
6
2006
47.4
7
1954
47.2
8
1999
47.0
9
2015
46.9
10
2016, 2007, 1990
46.6
Top Ten Coldest Years on Record
Rank
Year
Average Temperature °F
1
1912
39.9
2
1944
40.1
3
1920
40.2
4
1916, 1898
40.9
6
1895
41.0
7
1924
41.1
8
1913, 1899, 1923
41.2


Average Annual Temperature for Period of Record - Click on Graph to Enlarge

Learn more about the National Weather Service's efforts to build a Weather-Ready Nation!

Element
Jan
Feb
Mar
Apr
May
Jun
Jul
Aug
Sep
Oct
Nov
Dec
Year
Total (inches)
1.27
1.11
4.65
3.26
2.20
0.26
0.43
M
M
1.07
0.45
1.23
M
Mean Precip (1981-2010 Normals)
0.41
0.58
1.16
1.87
2.20
1.27
0.78
0.61
1.05
1.29
0.86
0.58
12.66
Departure from Normal
0.86
0.53
3.49
1.39
0.00
-1.01
-0.35
M
M
-0.22
-0.41
0.65
M
Percent of Normal
310
191
401
174
100
20
55
M
M
83
52
212
M
126 years (P.O.R 1892-2017)123
102
126
103
69
27
54
M
M
64
46
111
M

Greatest 24-HR Total
0.81
0.66
2.71
0.94
1.38
0.17
0.24
M
M
0.35
0.20
0.33
2.71
Dates of Occurrence
23-24
23-24
31
28
18
11
20
M
M
14
1
20
3/31
Number of Days with:
Precipitation >= 0.01
7
6
9
10
8
4
6
M
M
6
8
7
71*
Precipitation >= 0.10
4
2
5
7
5
1
2
M
M
4
2
6
38*
Precipitation >= 1.00
0
0
2
0
1
0
0
M
M
0
0
0
3
Days with Thunderstorms
0
0
1
1
6
7
11
3*
M
2
0
0
31*
Daily Precipitation Records Set or Tied
1
0
1
0
1
0
0
M
M
0
0
0
3
M - Extensive missing data for August and September; Annual Totals Cannot be Calculated
Precipitation Ranks and Records:
March: 2.71" on the 31st (also an all-time daily record for March and 6th highest daily total for the entire period of record)
May: 1.38" on the 18th.
Wettest Months of January on Record
Rank
Year
Precipitation (inches)
1
1910
2.06
2
1949
1.65
3
1962
1.34
4
2017
1.27
5
1963, 1922
1.13
7
1994
1.10
9
1972, 1920
1.08
Wettest Months of March on Record
Rank
Year
Precipitation (inches)
1
2017
4.65
2
2016
4.59
3
1906
3.56
4
1998
3.44
5
1977
3.30
6
1894
3.29
7
1973
3.02
8
1898
2.73
9
1941
2.68
10
1896
2.63
Wettest Springs (March, April, May) on Record
Rank
Year
Precipitation (inches)
1
2016
14.23
2
1957
12.57
3
1971
11.02
4
2017
10.11
5
1924
9.95
6
1898
9.83
7
1944
9.67
8
1995
9.40
9
1906
9.34
10
1935
9.33
Top Ten Driest Years on Record
Rank
Year
Precpitation (inches)
1
2001
5.30
2
1954
5.37
3
2012
6.60
4
1902
7.25
5
2006
7.42
6
1988
7.63
7
1939
7.95
8
2002
8.09
9
1914
8.32
10
2000
8.61
Top Ten Wettest Years on Record
Rank
Year
Precipitation (inches)
1
1957
21.89
2
1923
21.56
3
2016
21.29
4
1941
20.66
5
1912
20.00
6
1947
19.70
7
1995
19.68
8
1944
19.57
9
1973
19.30
10
1908
19.22


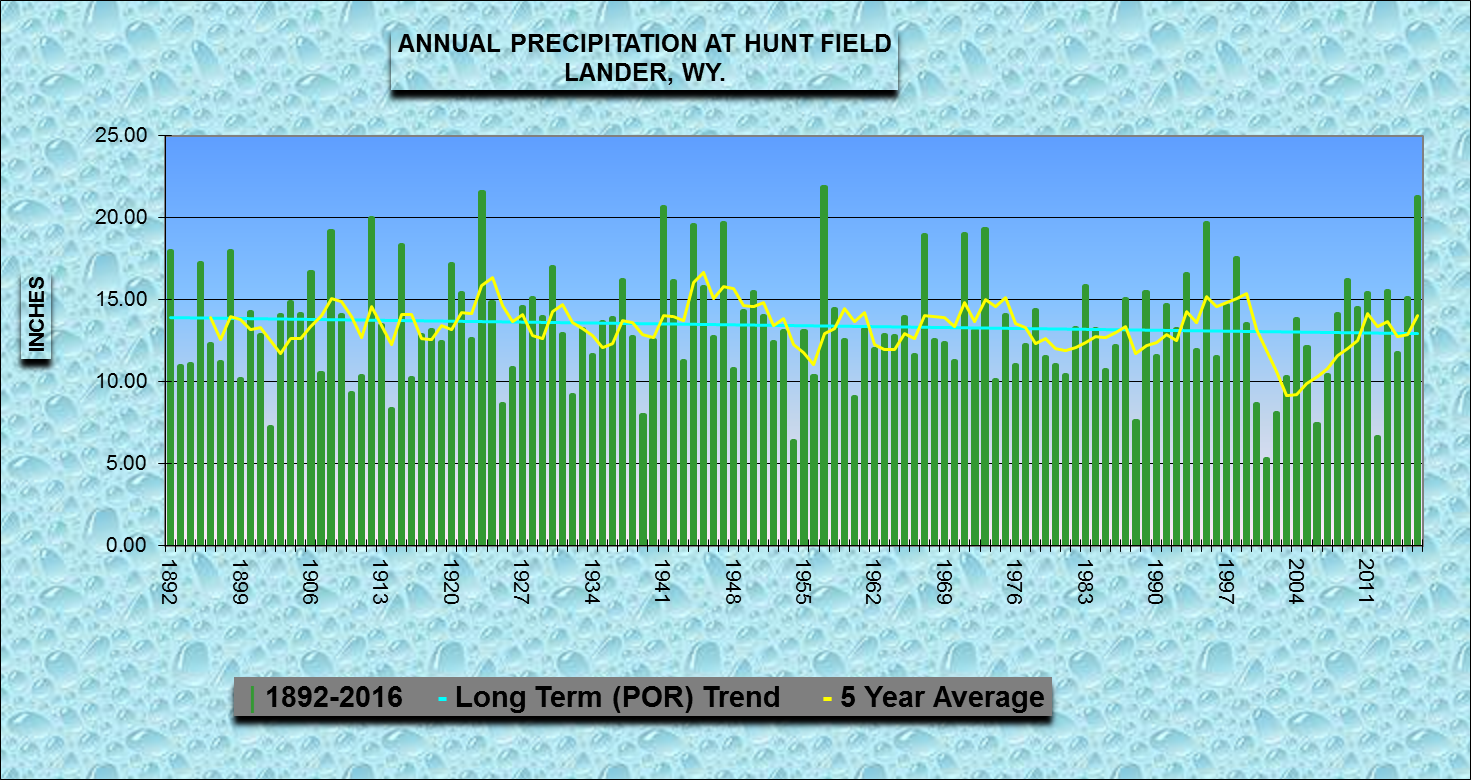
Annual Precipitation for Period of Record - Click on Graph to Enlarge

Learn more about the National Weather Service's efforts to build a Weather-Ready Nation!

Element
Jan
Feb
Mar
Apr
May
Jun
Jul
Aug
Sep
Oct
Nov
Dec
Year
Total (inches)
18.3
19.6
5.7
17.4
6.8
0.0
0.0
0.0
0.0
4.5
3.5
18.4
94.2
Average Snowfall
7.6
10.3
16.1
16.8
4.8
0.1
0.0
0.0
2.7
9.8
13.1
10.1
91.4
Departure from Normal
10.7
9.3
-10.4
0.6
2.0
-0.1
0.0
0.0
-2.7
-5.3
-9.6
8.3
2.8
Percent of Normal
241
190
35
104
142
0
0
0
0
46
27
182
103
Rank - Least to Most
126 Years (P.O.R 1892-2017)119
109
23
72
89
NA
NA
NA
1*
59
28
114
82

Greatest 24-HR Total
5.4
13.9
5.7
10.7
6.3
0.0
0.0
0.0
0.0
2.6
2.6
4.2
13.9
Dates of Occurrence
23
23
31
4
18
NA
NA
NA
NA
14
2
20
2/23
Number of Days with:
Snowfall >= 1.0 inch
4
4
1
2
1
0
0
0
0
2
1
7
22
Daily Snowfall Records Set or Tied
1
0
0
0
1
0
0
0
0
0
0
0
2
Snowfall Ranks and Records:
January: 5.4" on the 23rd.
May: 6.3" on the 18th.
Snowiest Months of January on Record
Rank
Year
Snowfall (inches)
1
1962
26.5
2
1980
26.2
3
1973
25.7
4
1949
23.9
5
1910
20.6
6
1994
19.5
7
1972
18.7
8
2017
18.3
9
1984
18.0
10
1963
17.8
Top Ten Snowiest Years on Record
Rank
Year
Snowfall (inches)
1
1973
199.9
2
1975
160.7
3
1983
159.6
4
1967
154.6
5
1959
150.4
6
1971
148.3
7
2013
138.0
8
1978
128.1
9
1920
127.9
10
1892
125.1
44
2017


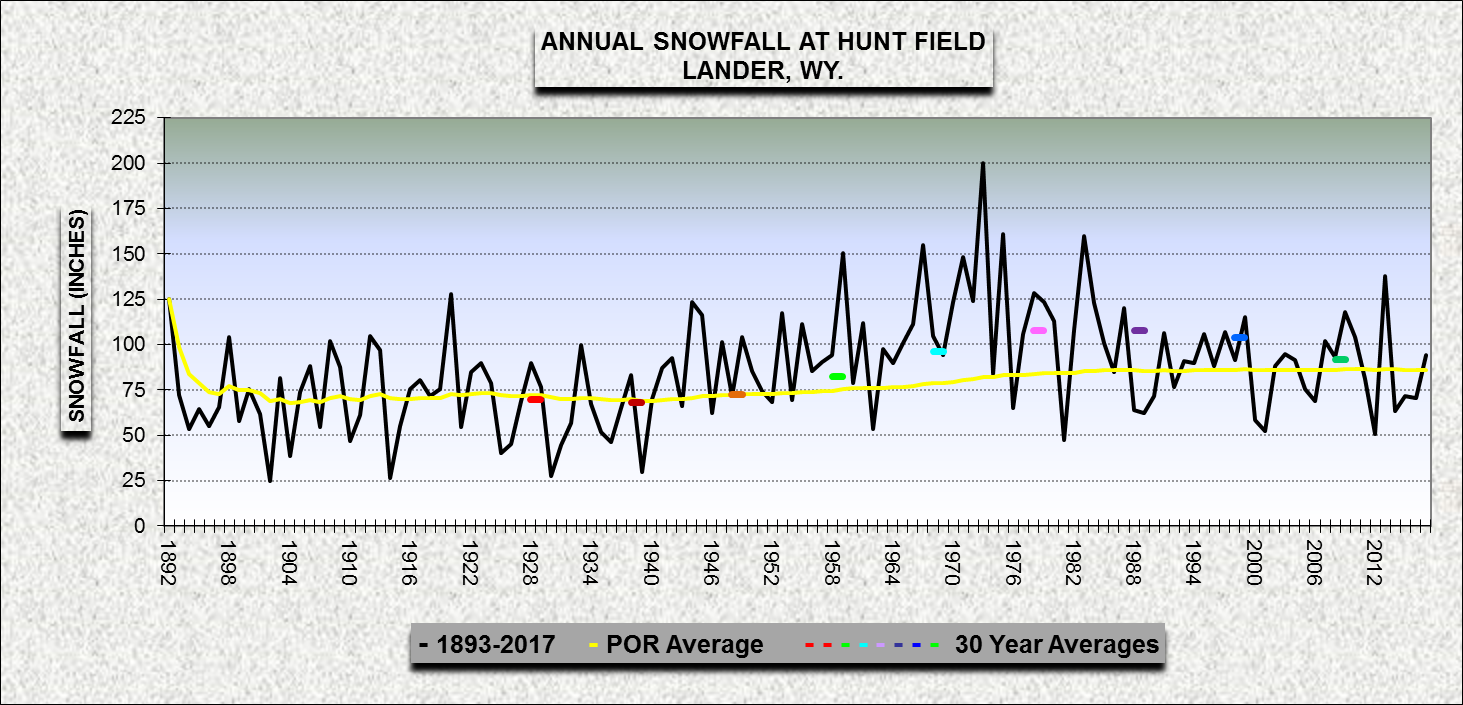
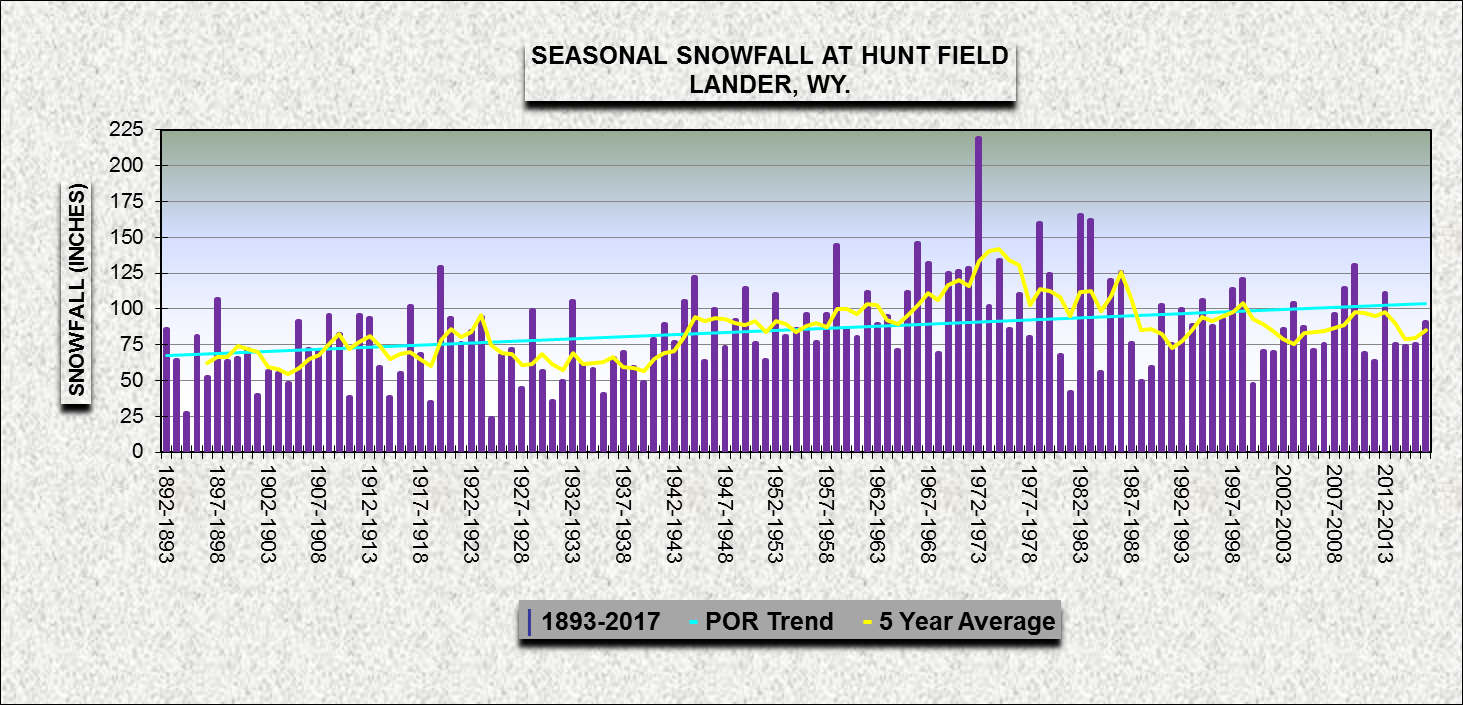
Annual and Seasonal Snowfall for Period of Record - Click on Graph to Enlarge

Learn more about the National Weather Service's efforts to build a Weather-Ready Nation!

Element
Jan
Feb
Mar
Apr
May
Jun
Jul
Aug
Sep
Oct
Nov
Dec
Year
Average Speed (MPH)
4.0
6.7
8.3
7.2
6.9
7.5
6.5
M
M
6.1
6.3
4.7
6.4
Maximum 3-sec Gust
58
56
70
52
53
76
63
M
M
44
59
49
76
Direction (degrees)
230
260
200
250
240
220
270
M
M
210
230
210
220
Date of Occurrence
10
6
5
17
24
12
17
M
M
20
16
3
6/12

Learn more about the National Weather Service's efforts to build a Weather-Ready Nation!