Heavy to excessive rainfall Wednesday may bring areas of flash and urban flooding over portions of the Ohio and Tennessee Valleys. In Arizona and New Mexico, heavy to excessive rainfall from monsoon thunderstorms may bring isolated flash and urban flooding Thursday into Saturday. Two tropical waves in the Atlantic are being monitored for tropical cyclone formation within the next few days. Read More >

|
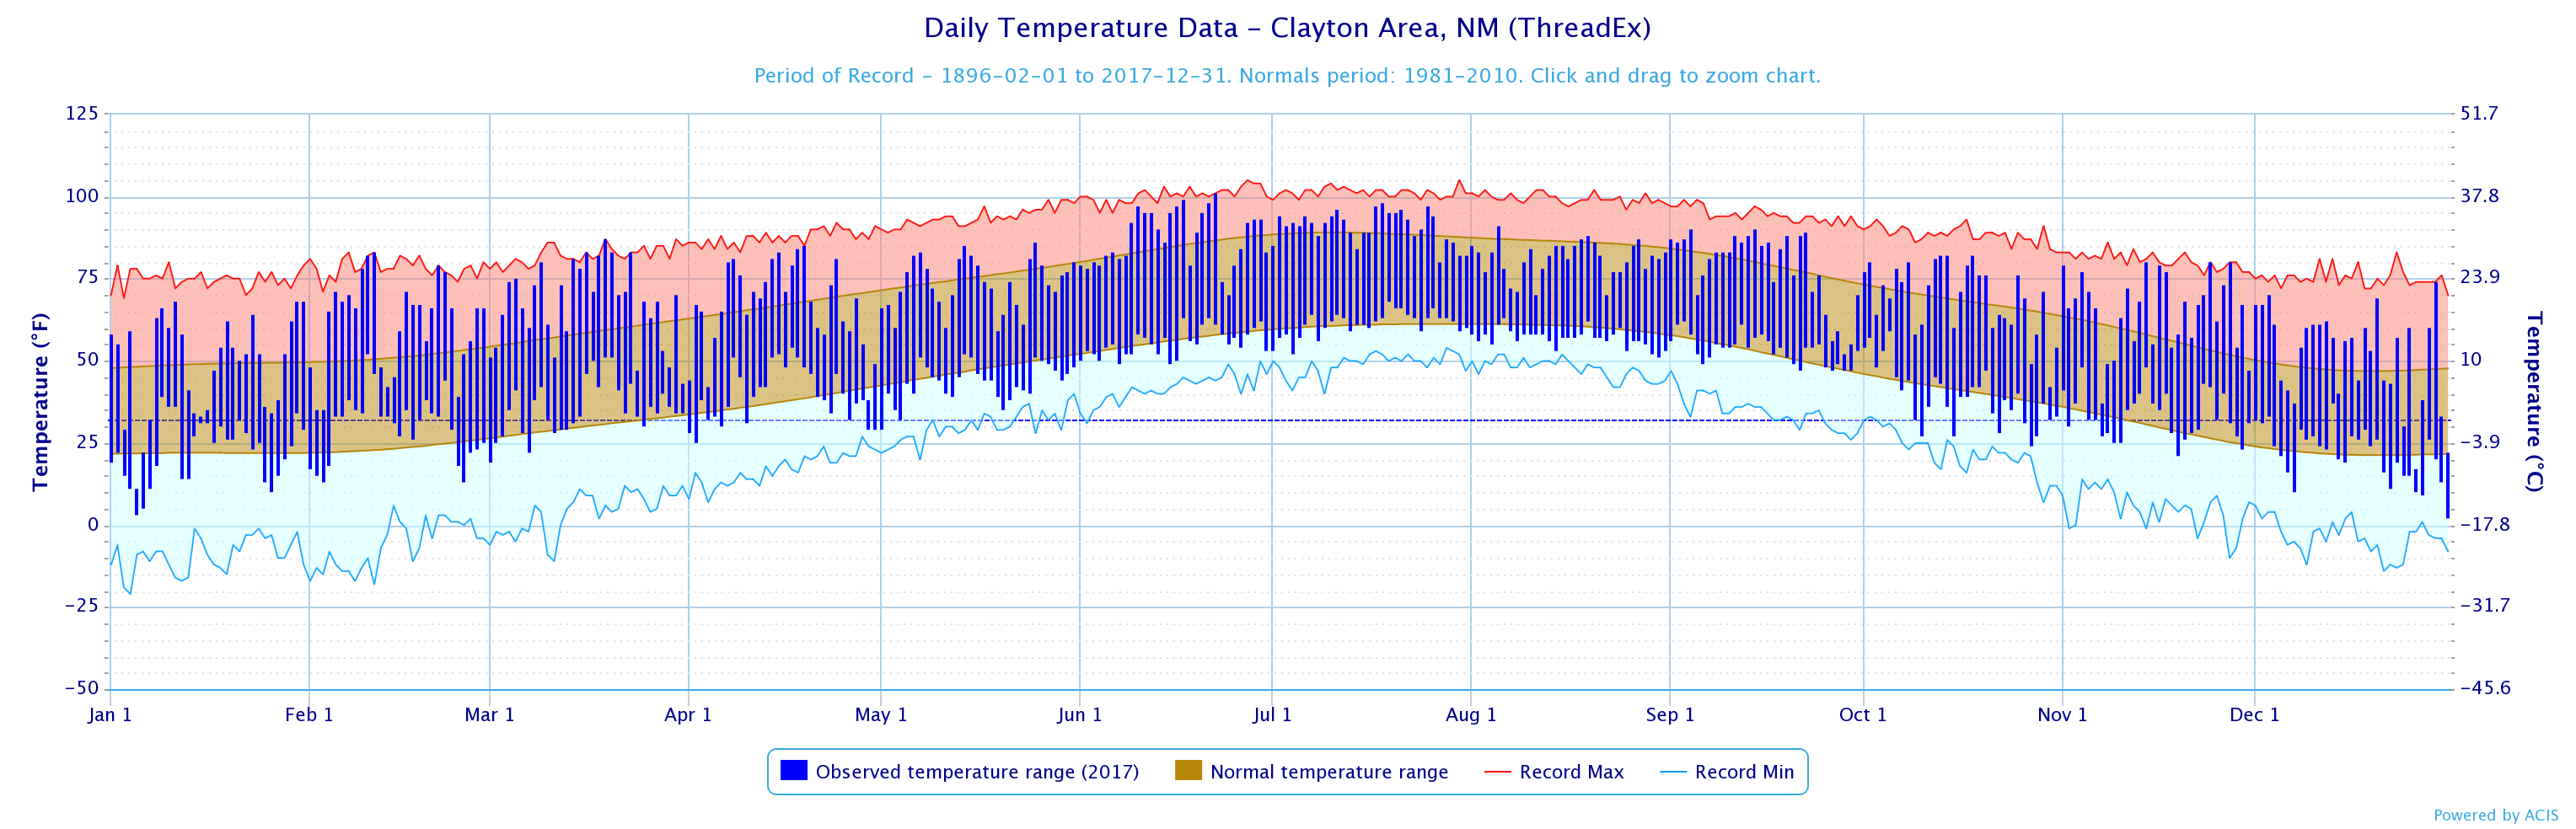
The 2017 year in Clayton was warmer than normal, the same as the past 13 years! The 2004 year was the last time Clayton experienced below normal temperatures! The graph below lists the actual daily temperatures, as well as the normal and record highs and lows for Clayton in 2017.
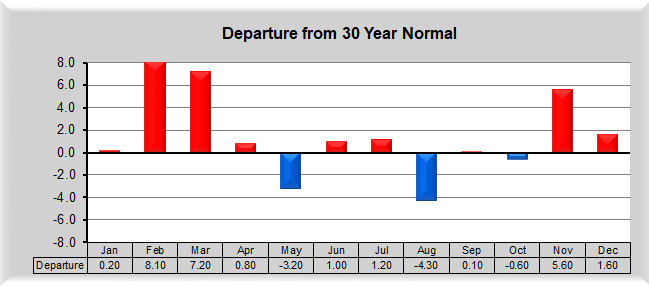
(click image to enlarge) The average temperature for Clayton in 2017 was 55.5 degrees, which was 1.9 degrees above the 30-year normal of 54.1 degrees, while the long term normal is 53.6 degrees. This was the 5th warmest year on record, for years with no missing data (a total of 50 years). Monthly temperatures for the Clayton Airport are illustrated in the charts below with monthly average temperatures for Clayton in red, and both long term (purple) and 30-year (blue) normals in the top graph, with departures shown in the bottom graph. |
|
|
|
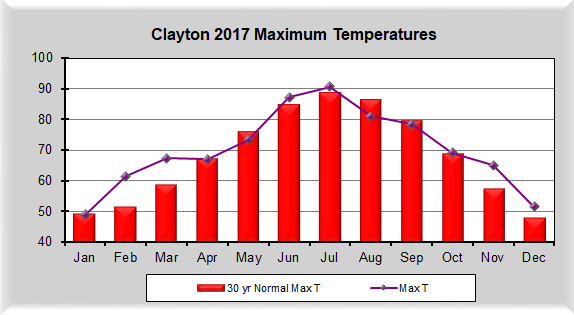
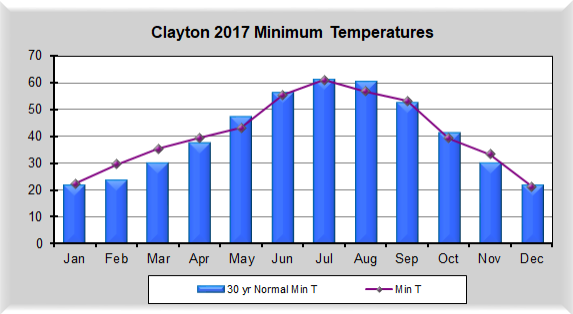
The 2017 year in Clayton was a warm one, ranking as the 5th warmest on record since 1910, (although numerous years contained considerable missing data - there was only 50 years with no missing data). All months were above normal except May, August and October. February and March were the 2nd warmest on record, while November was 4th warmest. August was the 7th coldest on record. The average maximum temperature for Clayton was 70.2°F (2.3 degrees above normal), while the average minimum temperature for the year was 40.9°F (0.6 degrees above normal). The maximum temperatures made much more of an impact on the overall warmer than normal temperatures for Clayton.
|
|
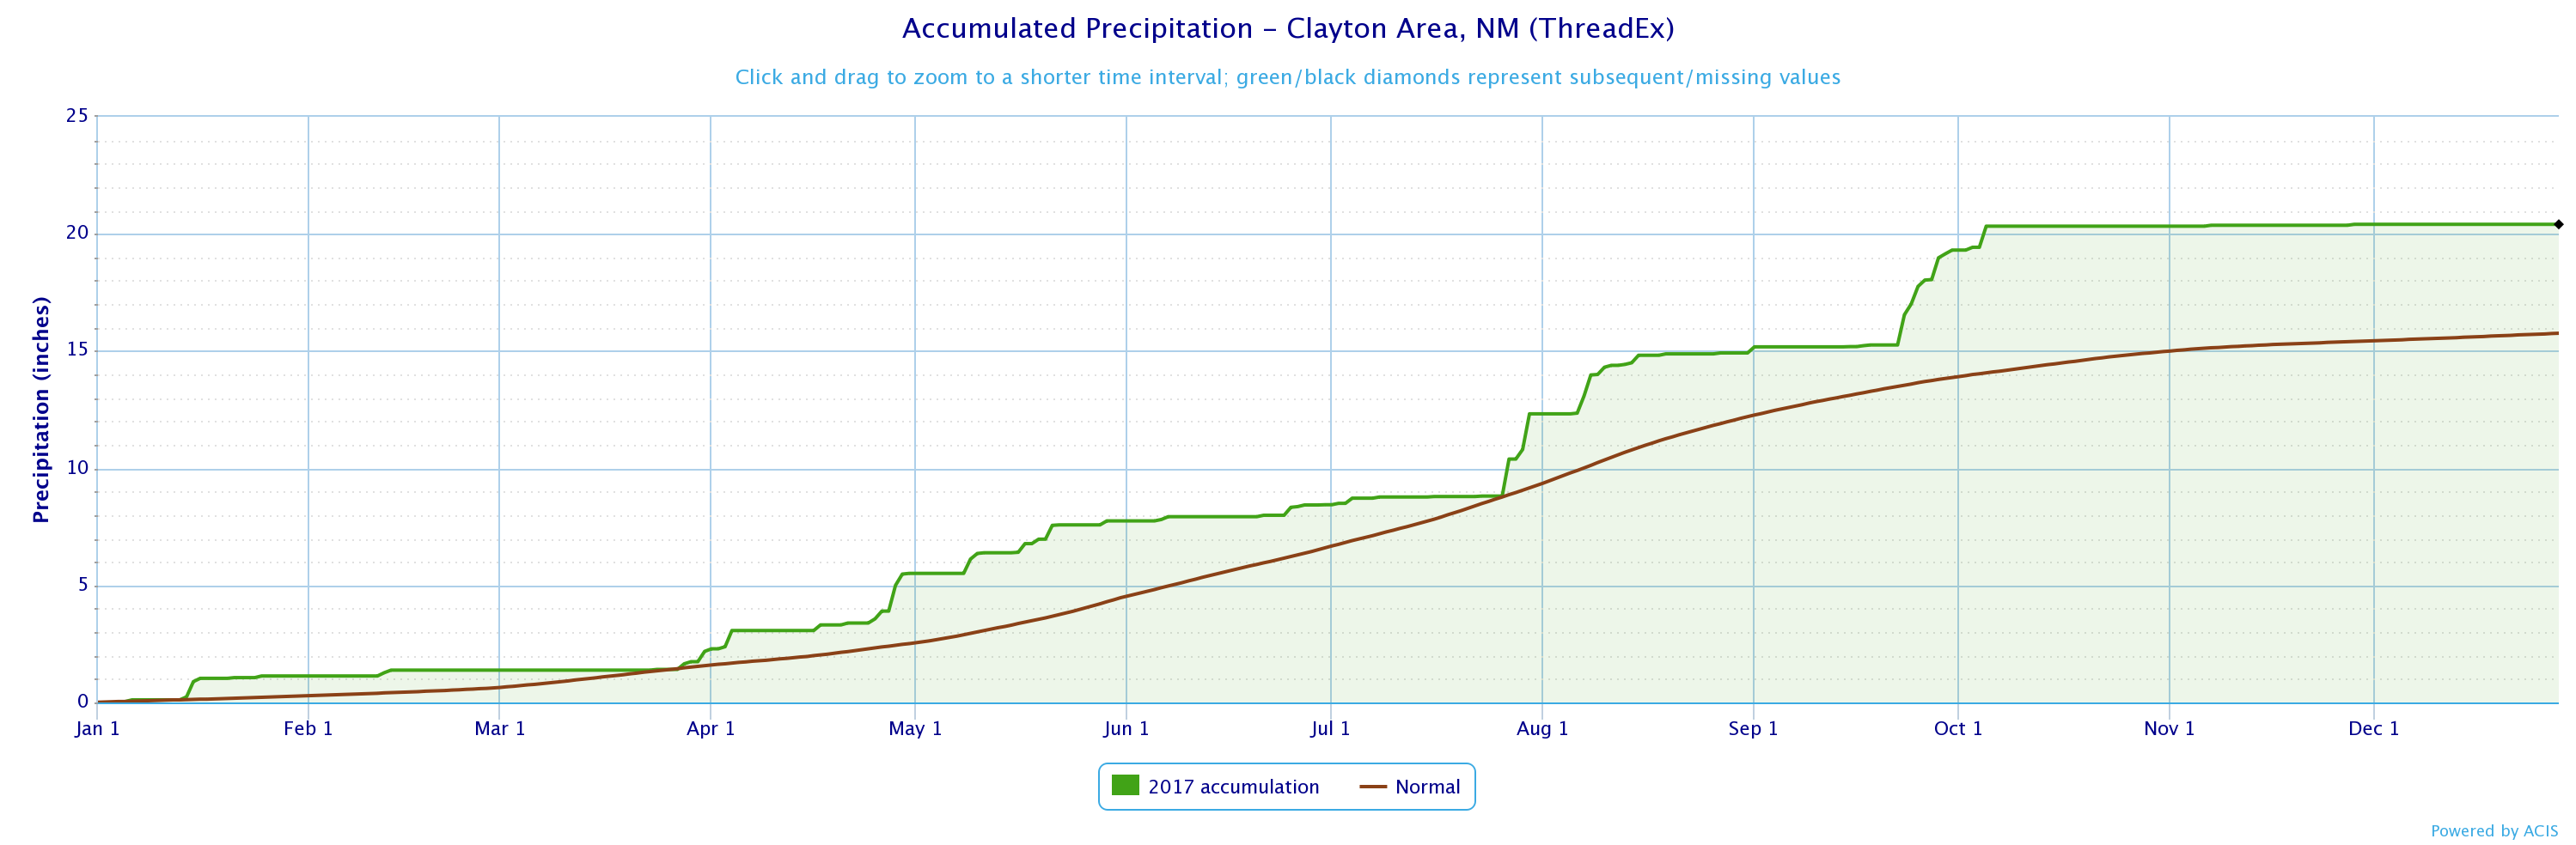
PRECIPITATION Precipitation was above normal in Clayton during 2017, making it three years in a row with above normal (red line) precipitation. The graph below shows the daily precipitation for the year (green line).
(click image to enlarge) Total precipitation in 2017 was 20.41 inches. This was 4.62 inches above the 30-year normal (1981-2010) of 15.79 inches. This was the 10th wettest year on record for Clayton (using only years with no missing data). The long term average is 15.33 inches. The monthly precipitation (orange) is compared to the 30-year normal (light green), the period of record normal (cyan), and the departures from normal (green or brown).
Precipitation for five of the 12 months in Clayton for 2017 was wetter than normal and seven were below normal. But most of the above normal months were well above normal. September was the 6th wettest on record and April the 10th wettest. Only June was significantly below normal, and the 17th driest on record. SNOW The Clayton Airport reported 23.2 inches of snow in calendar year 2017 (red line below), while the 30-year normal is 28.0 inches.
(click image to enlarge)
The table below shows the snowfall for the 2016-2017 (25.3 inches) and 2017-2018 (0.5 inches so far) snow seasons, which officially run from July through June.
|


.png)
.png)