| 2018 Weather Highlights | Hydrology/Drought Status | Fire Weather | Records and Extremes | Monthly Highlights | Severe Weather |

|
New Mexico 2018: Much Warmer Than Normal - Below Normal Precipitation! (through November)
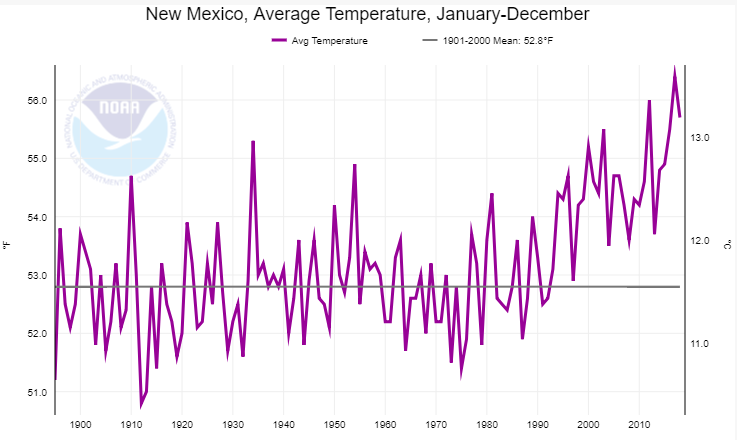
The 2018 statewide average temperature was 2.8 degrees above normal, which was the 3rd warmest on record!
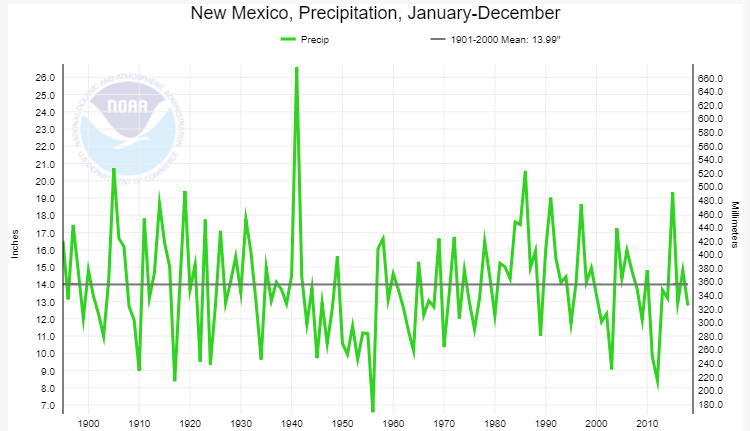
The 2018 statewide average precipitation was 1.22 inches below normal, which was the 40th driest on record.
Statewide - Winter 2017/2018 (Dec-Feb) and Spring 2018 (Mar-May) were in the top 20 driest on record.
Statewide - Winter 2017/18 (Dec-Feb), Spring 2018 (Mar-May), Summer 2018 (Jun-Aug), May, June and July: All in the Top 10 Warmest on Record! (linked graphs above are courtesy of NCEI - National Centers For Environmental Information)
2018 was the 3rd warmest year on record for New Mexico! Three seasons and three months were in the Top 10 warmest on record. The winter season (Dec 2017 - Feb 2017) was 6th warmest on record, spring season (Mar-May) the 2nd warmest, summer season (Jun-Aug) also the 2nd warmest, May was the 3rd warmest, June the 2nd warmest and July tied for the 8th warmest. When was the last year New Mexico experienced a below normal year? You have to go back to 1992! That's 26 consecutive years with above normal temperatures in New Mexico! 2018 was drier than normal, by an average of -1.22 inches. This was the 40th driest year on record, which includes 126 years of data. In the past 20 years, 12 years have been drier than normal and eight years wetter than normal. 2018 In Pictures!
|
|||||||||||||||||||||||||||||||||
|
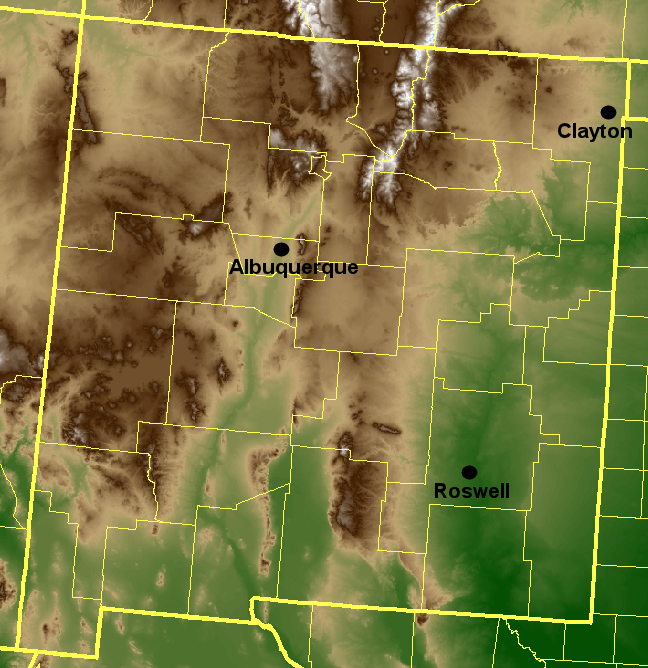
Climate Cities at a Glance: 2018: Temperature and Precipitation Data For Albuquerque, Clayton and Roswell
(Departure from normal based on a 30-year normals from 1981 to 2010; Rankings based on the Period Of Record - POR -but only years with no missing data were included)
This year's annual weather and climate review is organized into topics which are accessed by the tabs across the top of each page. The image below provides links to the 2018 statistics on temperature and precipitation for our climate sites: Albuquerque, Clayton and Roswell. Other topics include a summary of the drought status and hydrology program, a recap of the fire weather program; a list of all the records in Albuquerque, Clayton and Roswell in 2018 as well as extremes for Albuquerque and the growing season around the Duke City, a month-to-month recap of the significant weather events across New Mexico and a review of our 2018 severe weather. Click here for a detailed review of the 5 top weather stories of 2018! Click on a city below to view more detail about thetemperature and precipitation data for 2018
|
|||||||||||||||||||||||||||||||||

