Dangerous heat expands across the Desert Southwest, Plains, Mississippi Valley and Midwest. Critical fire weather for portions of the Intermountain West. Risk for severe thunderstorms and flash flooding across the Upper Midwest/Great Lakes, Ohio Valley, and portions of the mid-Atlantic. Active monsoonal moisture fuels thunderstorms over the Southwest. Hurricane Fausto in the Pacific, should weaken Read More >

|
CLAYTON
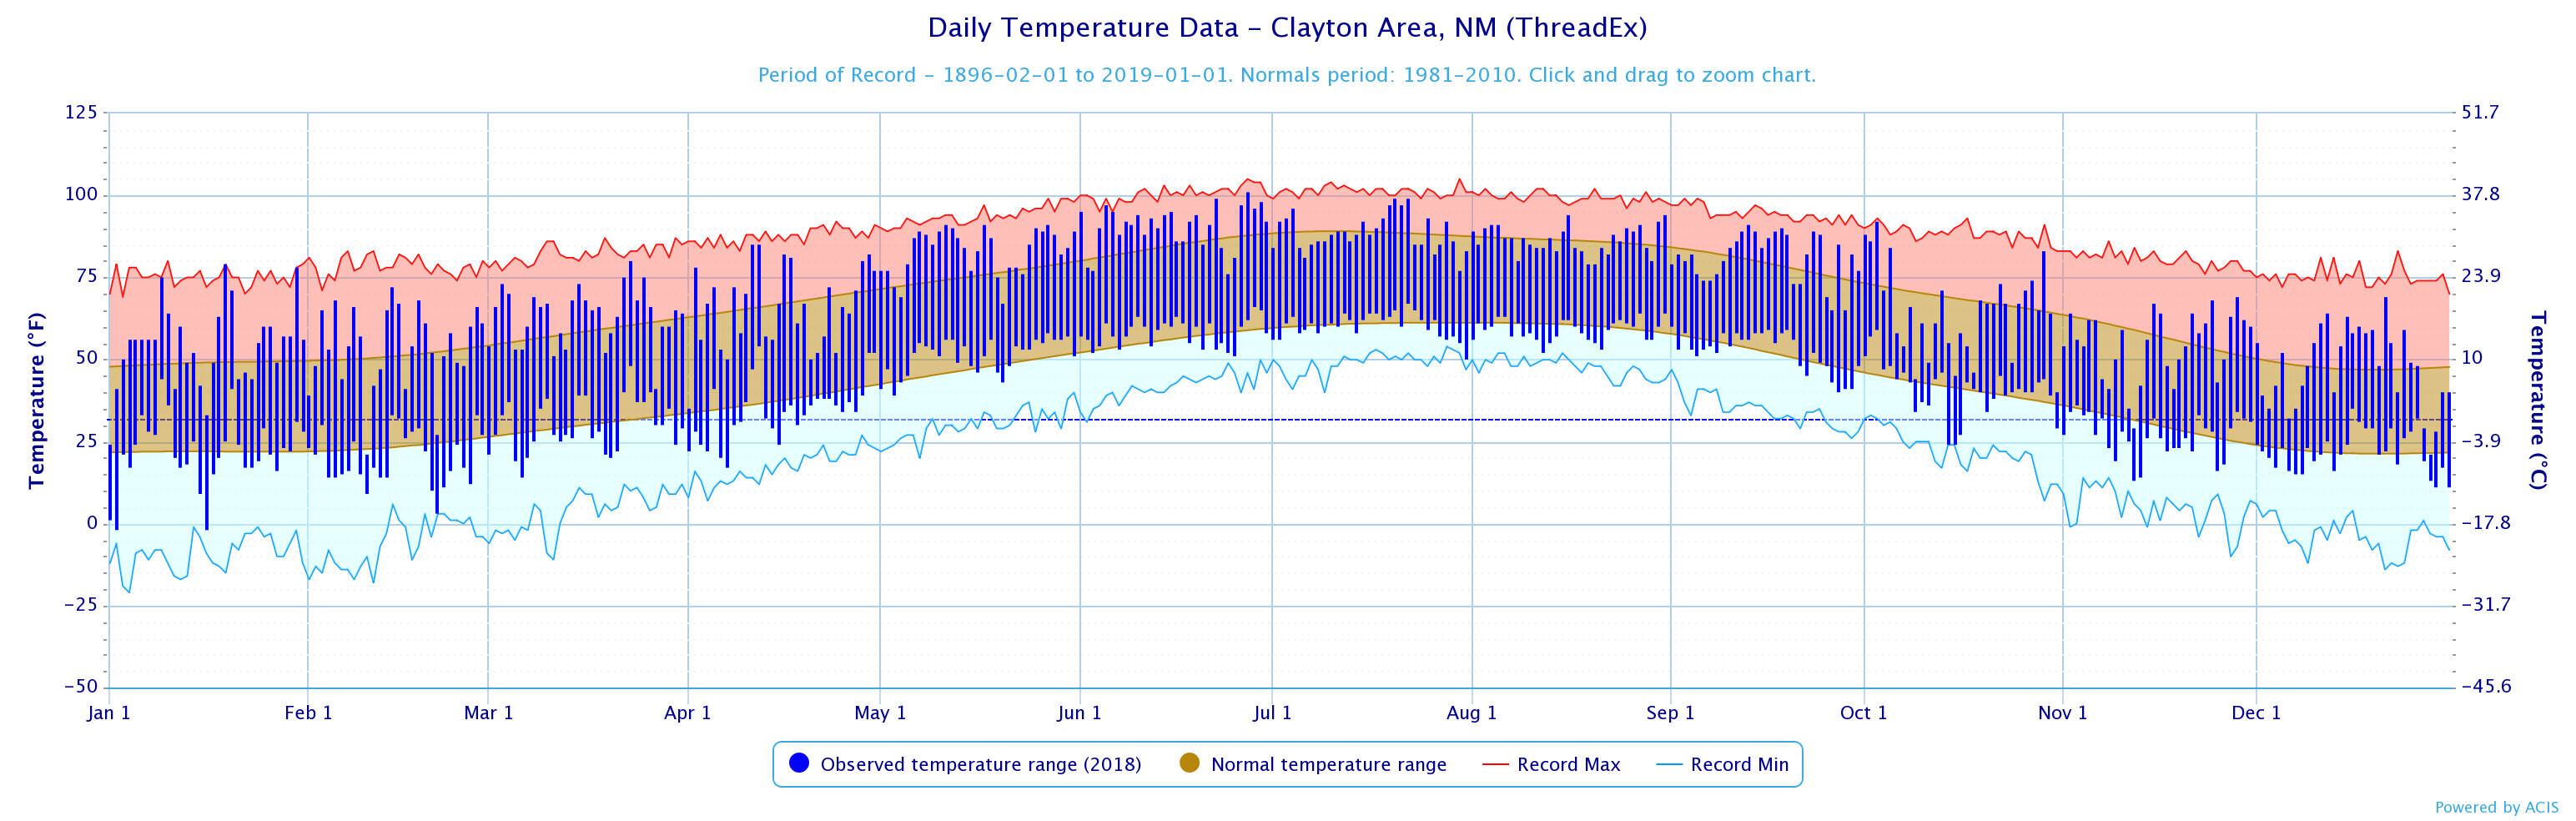
TEMPERATURES The 2018 year in Clayton was warmer than normal, the same as the past 14 years! The 2004 year was the last time Clayton experienced below normal temperatures! The graph below lists the actual daily temperatures, as well as the normal and record highs and lows for Clayton in 2018.
(click image to enlarge) The average temperature for Clayton in 2018 was 54.6 degrees, which was 0.5 degrees above the 30-year normal of 54.1 degrees, while the long term normal is 53.6 degrees. This was tied for the 16th warmest year on record, for years with no missing data (a total of 51 years). Monthly temperatures for the Clayton Airport are illustrated in the charts below with monthly average temperatures for Clayton in red, and both long term (purple) and 30-year (blue) normals in the top graph, with departures shown in the bottom graph. |
|
|
|
The 2018 year in Clayton was close to normal temperature-wise, just 0.5 degrees above normal. (although numerous years contained considerable missing data - there was only 51 years with no missing data). While only 5 months were above normal, four of them were more than 2 degrees above normal, with May 5.5 degrees above normal, the warmest May on record. The average maximum temperature for Clayton was 69.5°F (1.6 degrees above normal), while the average minimum temperature for the year was 39.7°F (0.6 degrees below normal).
|
|
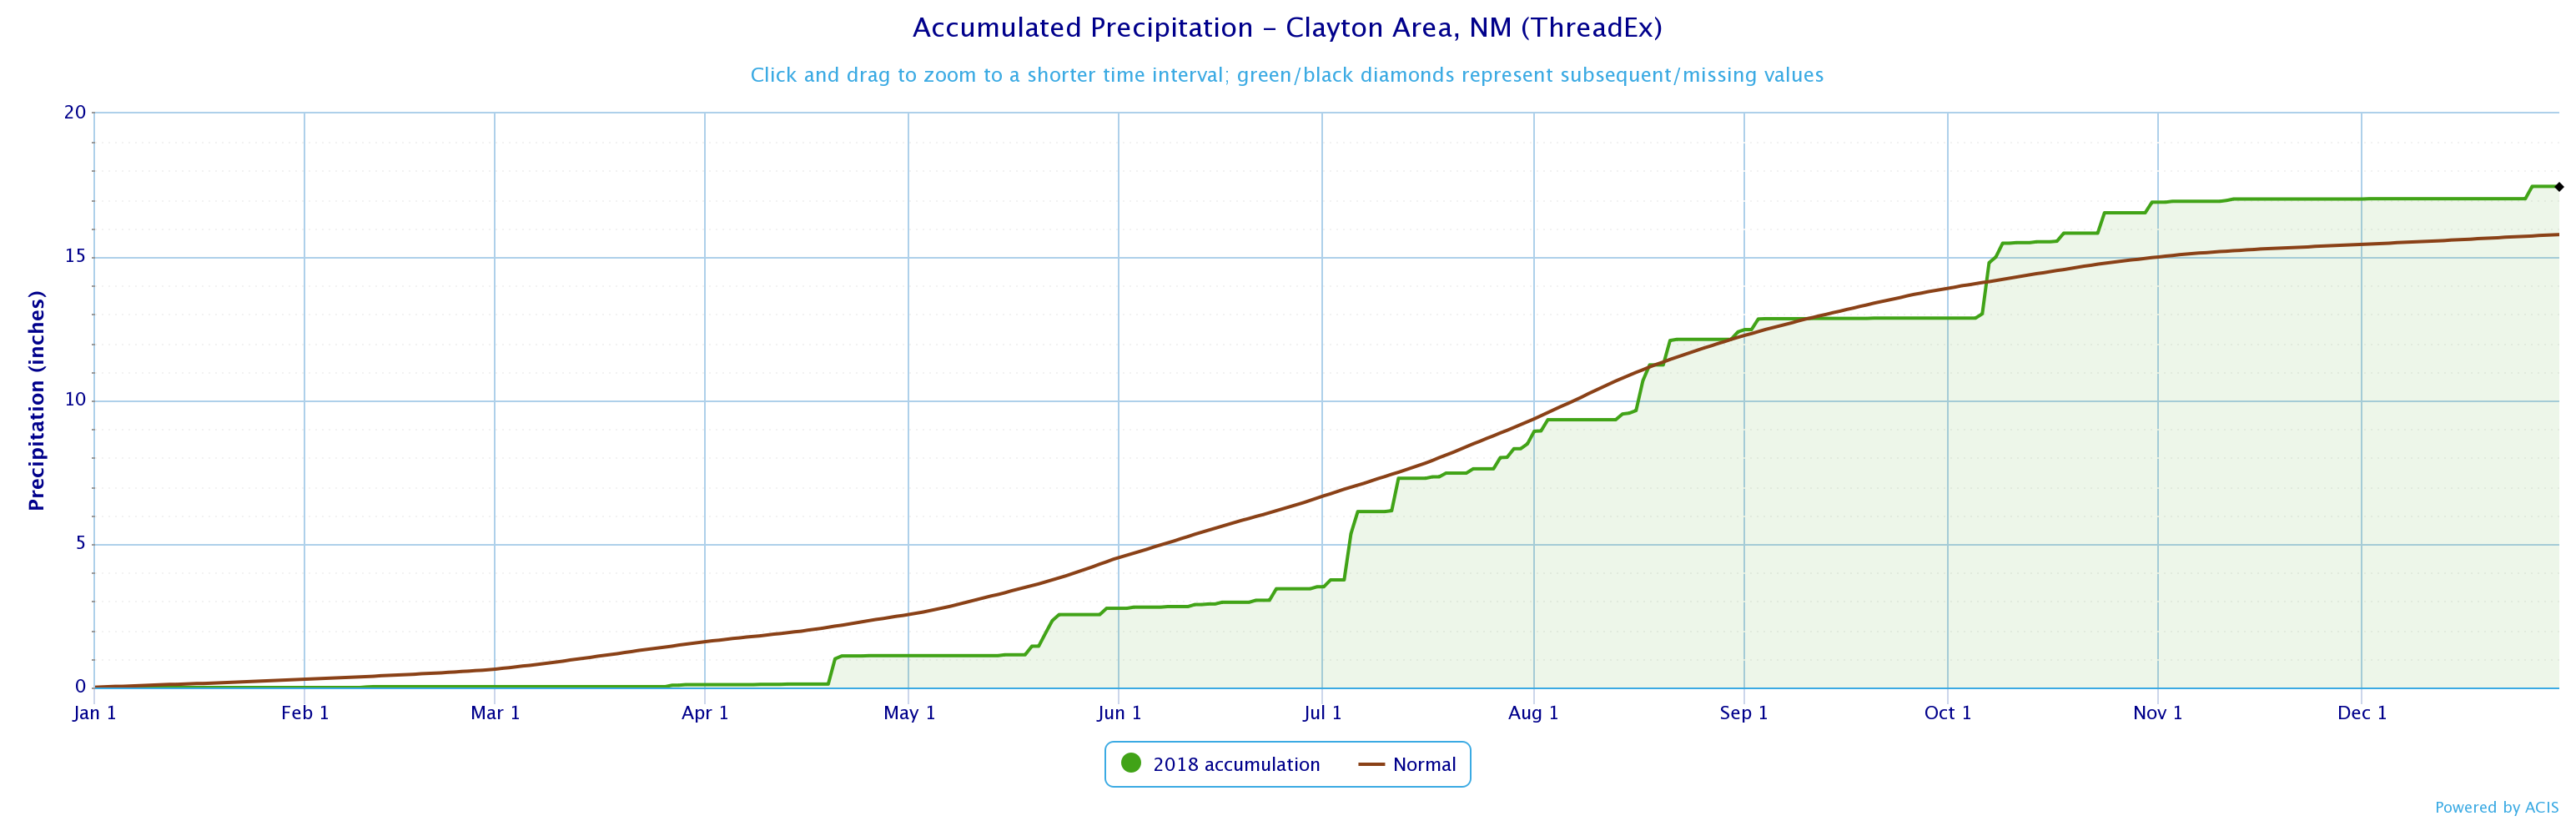
PRECIPITATION Precipitation was above normal in Clayton during 2018, making it four years in a row with above normal (red line) precipitation. The graph below shows the daily precipitation for the year (green line).
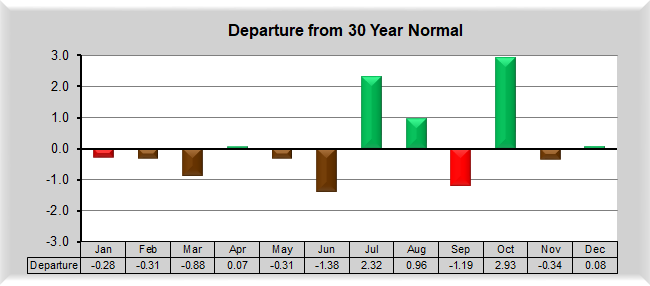
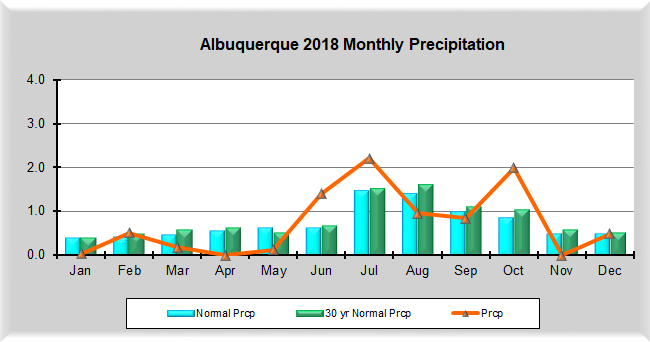
(click image to enlarge) Total precipitation in 2018 was 17.46 inches. This was 1.67 inches above the 30-year normal (1981-2010) of 15.79 inches. This was the 28th wettest year on record for Clayton (using only years with no missing data). The long term average is 15.33 inches. The monthly precipitation (orange) is compared to the 30-year normal (light green), the period of record normal (cyan), and the departures from normal (green or brown).
Even though only five months received above normal precipitation, three were significantly above normal; July over two inches above normal, August nearly an inch, and October close to three inches!.
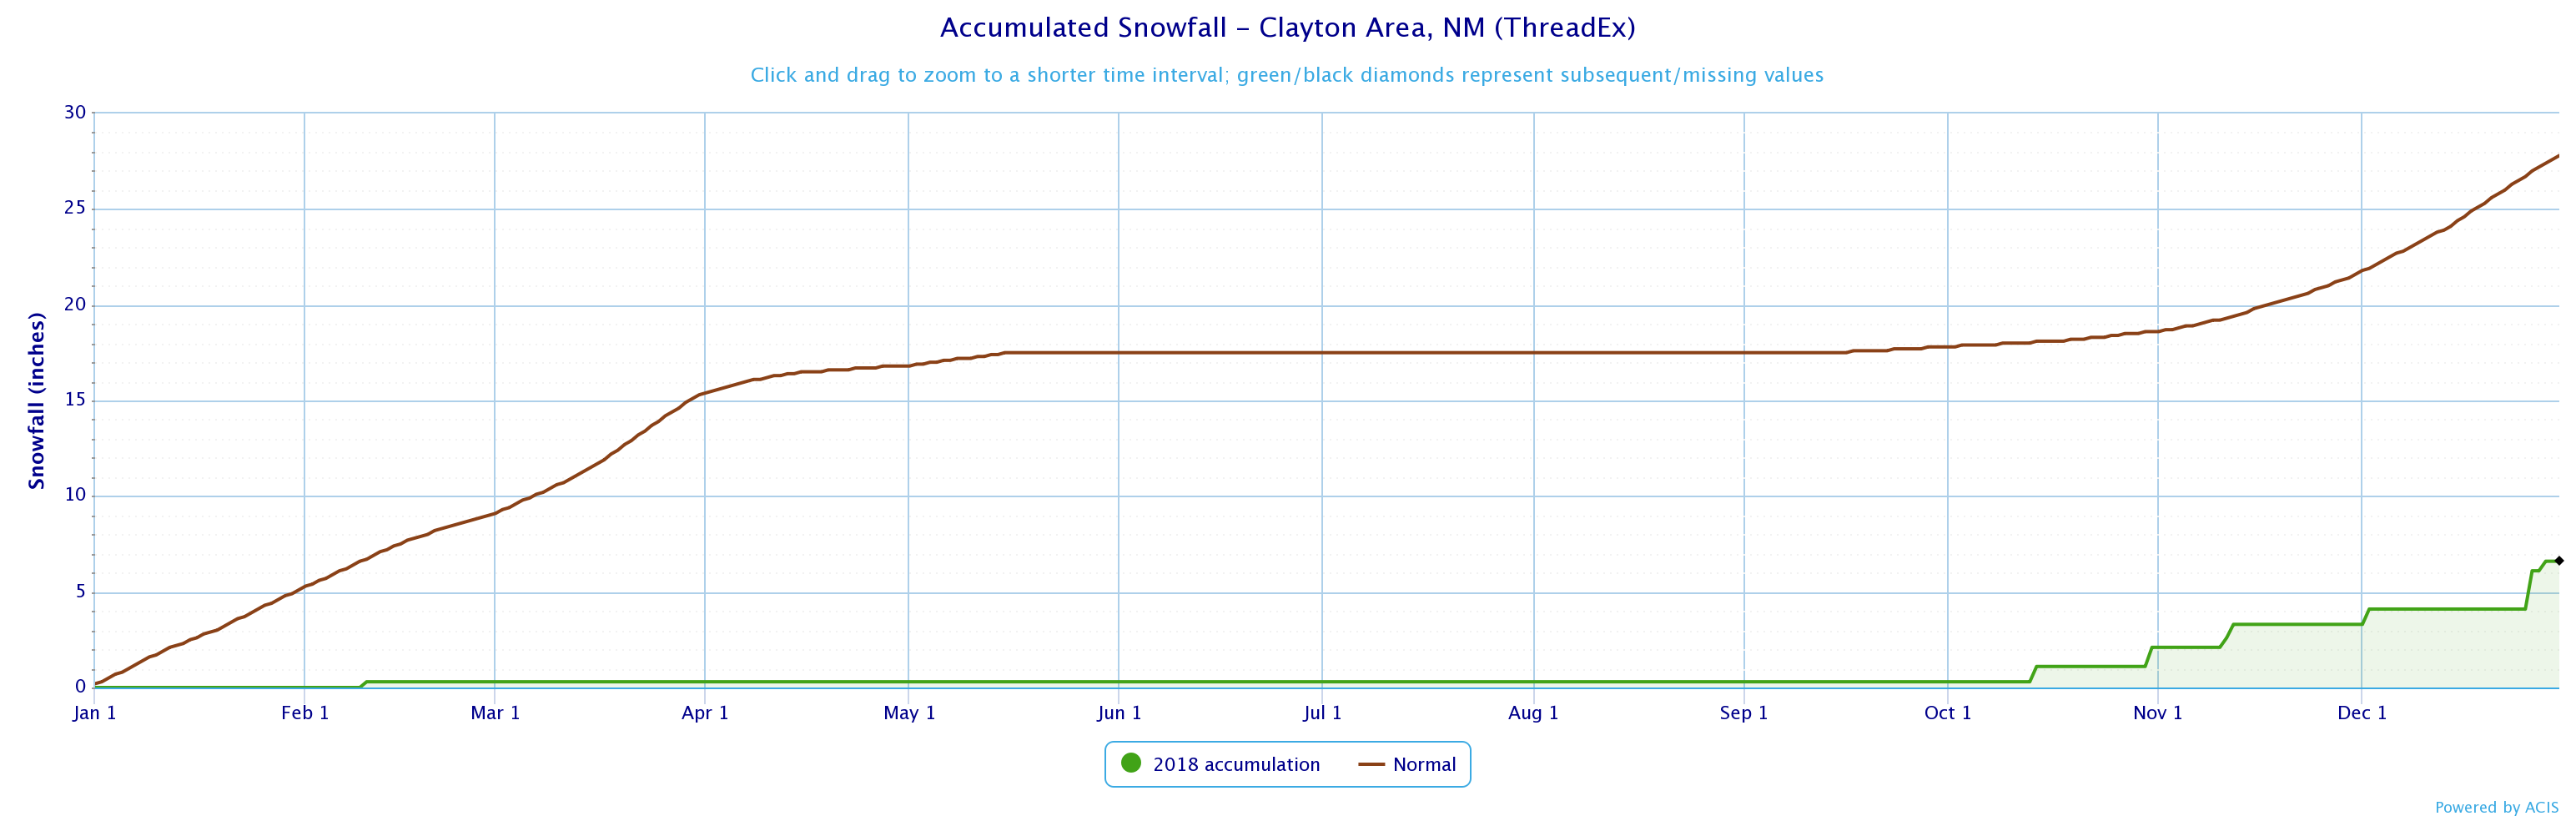
SNOW The Clayton Airport reported 6.6 inches of snow in calendar year 2018 (red line below), while the 30-year normal is 28.0 inches.
(click image to enlarge)
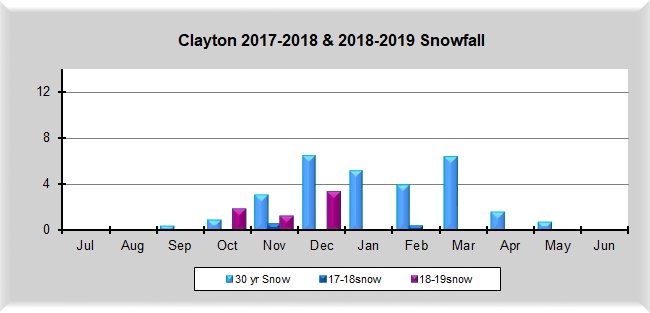
The table below shows the snowfall for the 2017-2018 (0.8 inches) and 2018-2019 (6.3 inches so far) snow seasons, which officially run from July through June.
|


.png)
.png)
.png)
.png)