Record setting heat is expected over the next several days from the Intermountain West through the northern Plains. Furthermore, fire weather concerns increase with dry and breezy conditions. Meanwhile, heavy rainfall and severe thunderstorm threats for the Ohio/Tennessee Valleys, central Appalachians and Southeast today. The threat shifts to central Gulf Coast and across central Texas this week. Read More >
We’ve had a lot of interest in the wind this year, specifically on putting how strong it’s been in perspective, or to validate the feeling that this must be some kind of record. It’s a tough question to answer, and took a deeper dive to find some answers.
You’ve probably never heard us talk about wind in terms of records before, like we do temperature and precipitation, and there’s a reason for that. At present, the National Weather Service utilizes the Automated Surface Observing System (ASOS) for official weather observations across the country. These weather stations, nearly 1000 of them, observe continuously and routinely report back automatically and objectively. This national standard began in the mid to late 90s. Before that time, manual observations were the norm on much less frequent time scales and with some element of subjectivity. All this to say, we're not truly comparing apples to apples with wind data prior to the ASOS era with that of the ASOS era.
So what can we say about the wind so far this year? It was likely the windiest April, and start to the year through April 30th for that matter, on record across the area since *at least* the mid to late 1990s based on average wind speed. Let's look at the data. Below are national maps from the National Center for Environmental Information (NCEI) that show the average wind speed (left) and departures from normal (right) for each month so far in 2022.
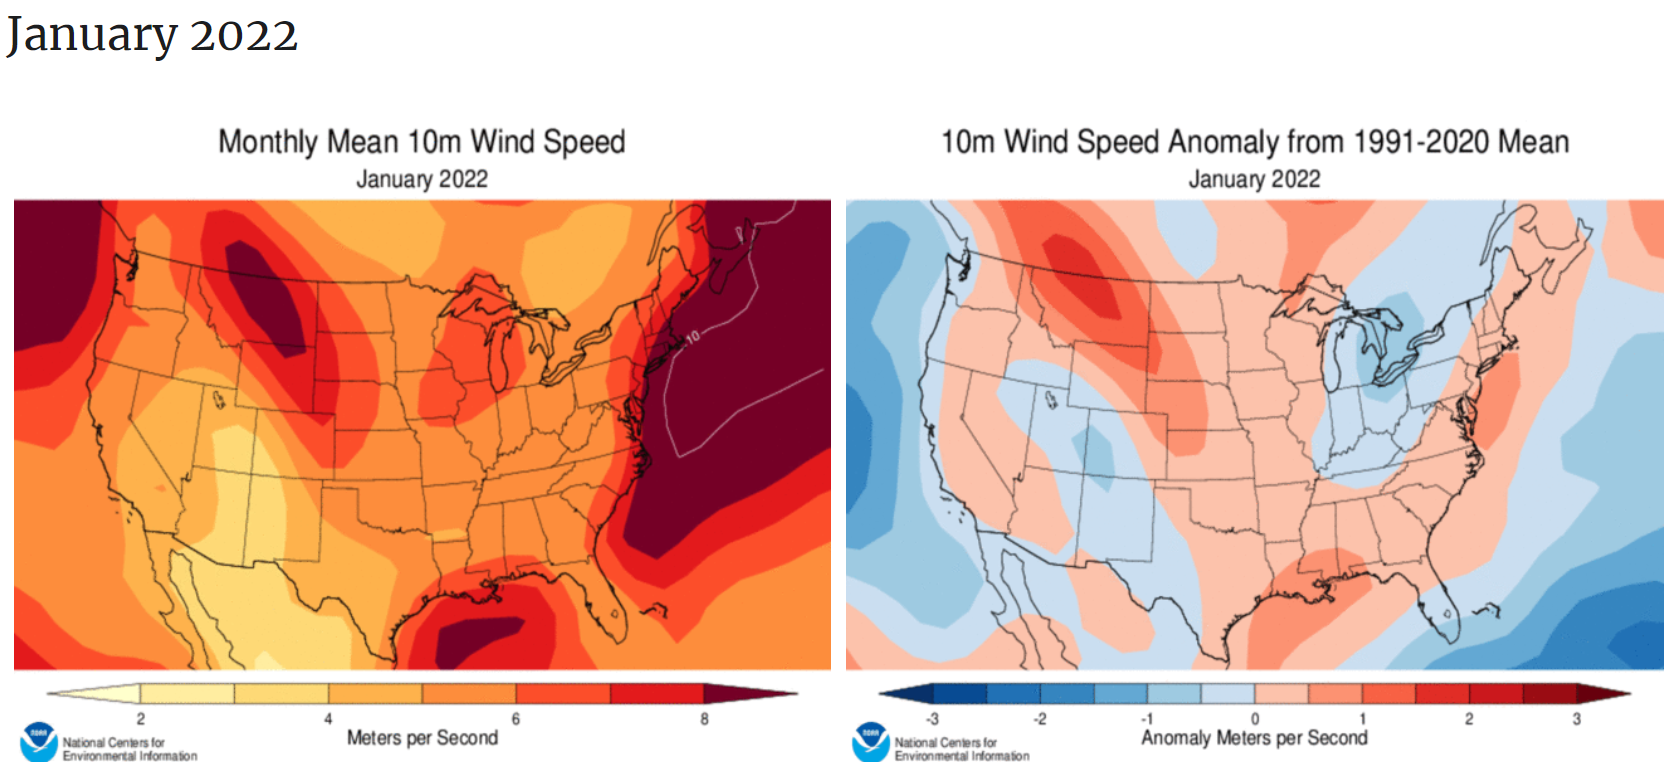
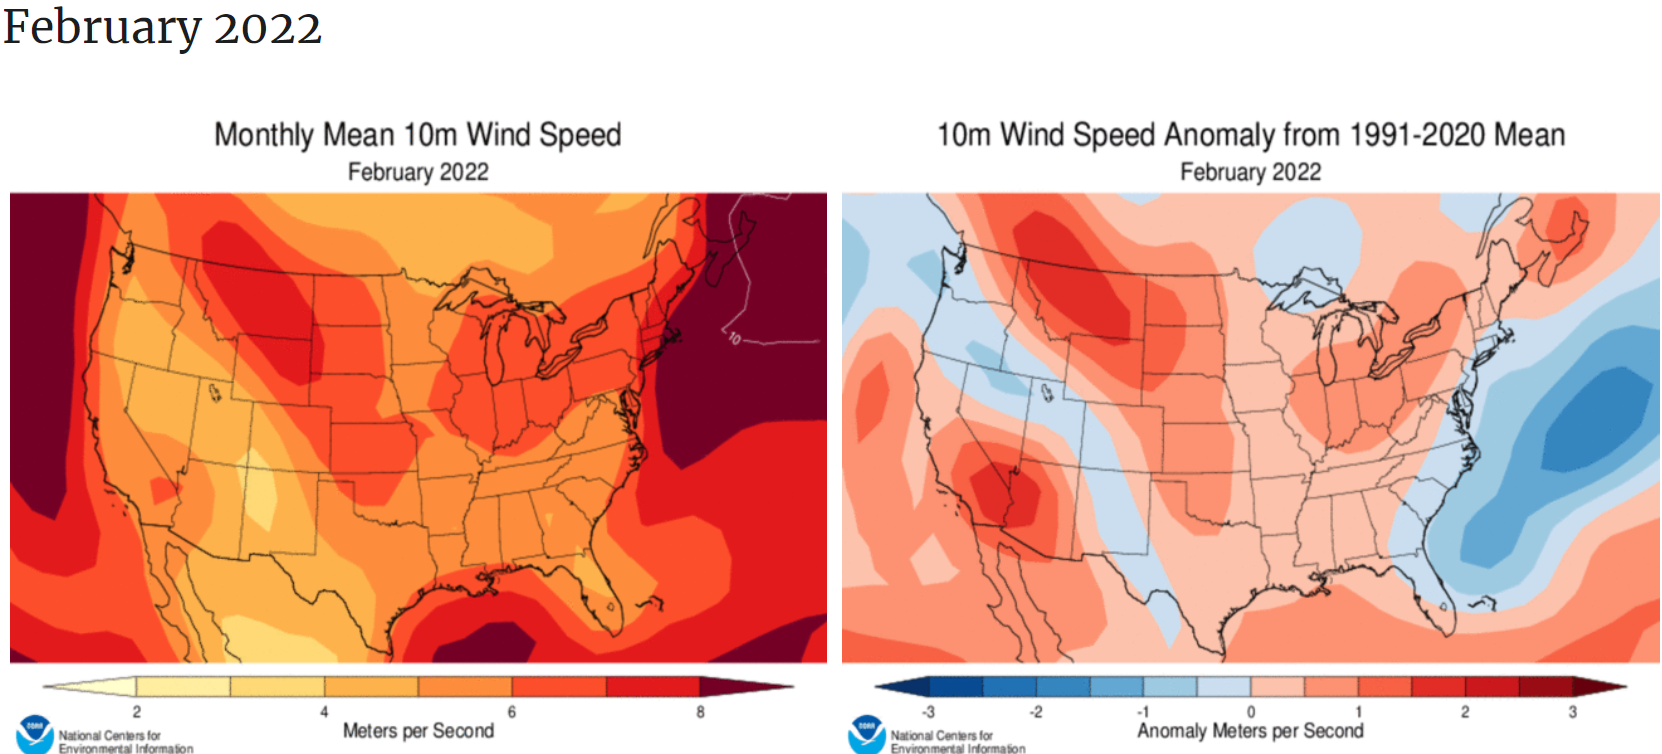
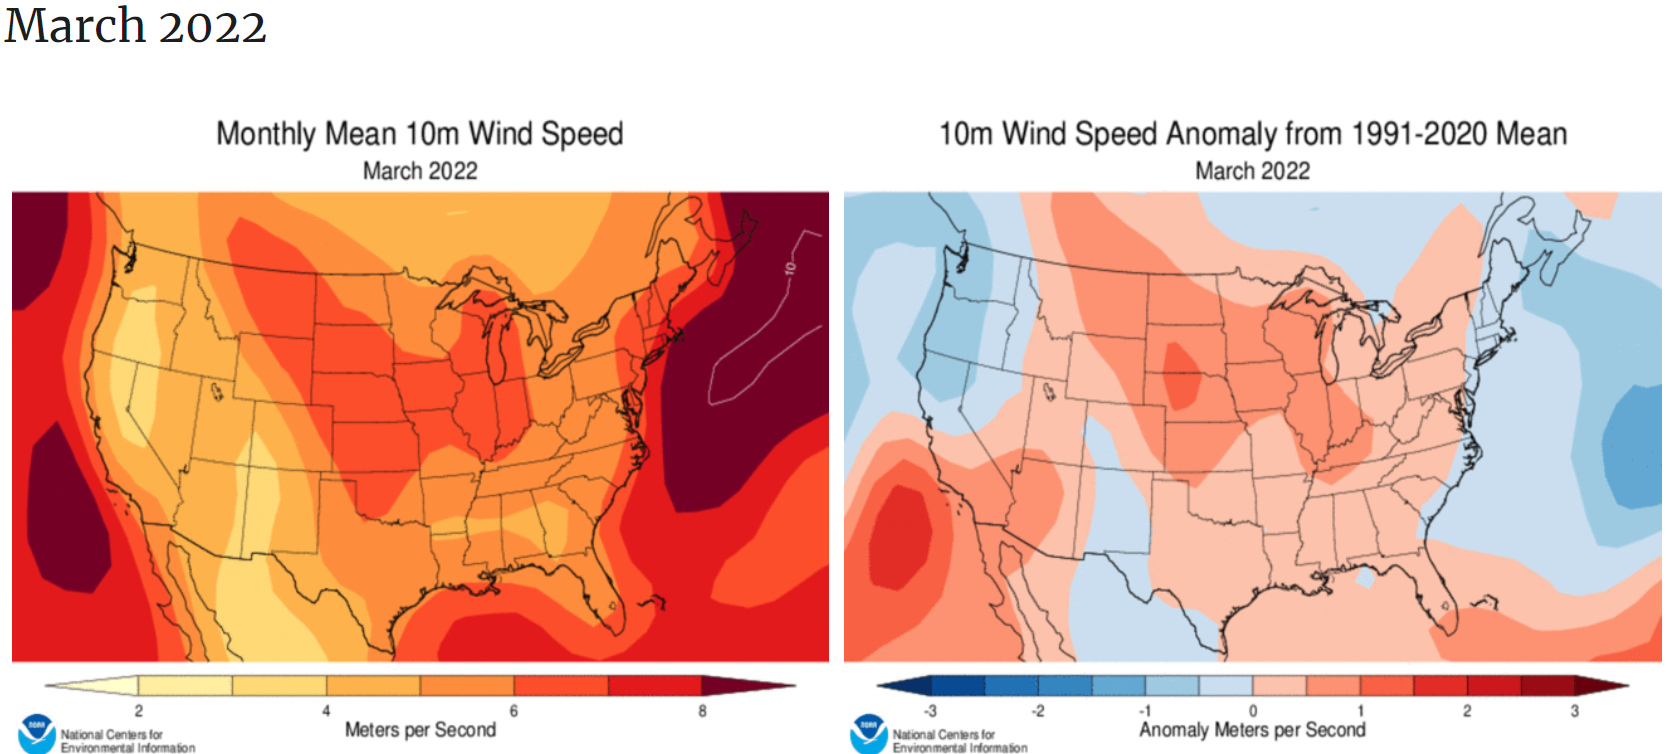
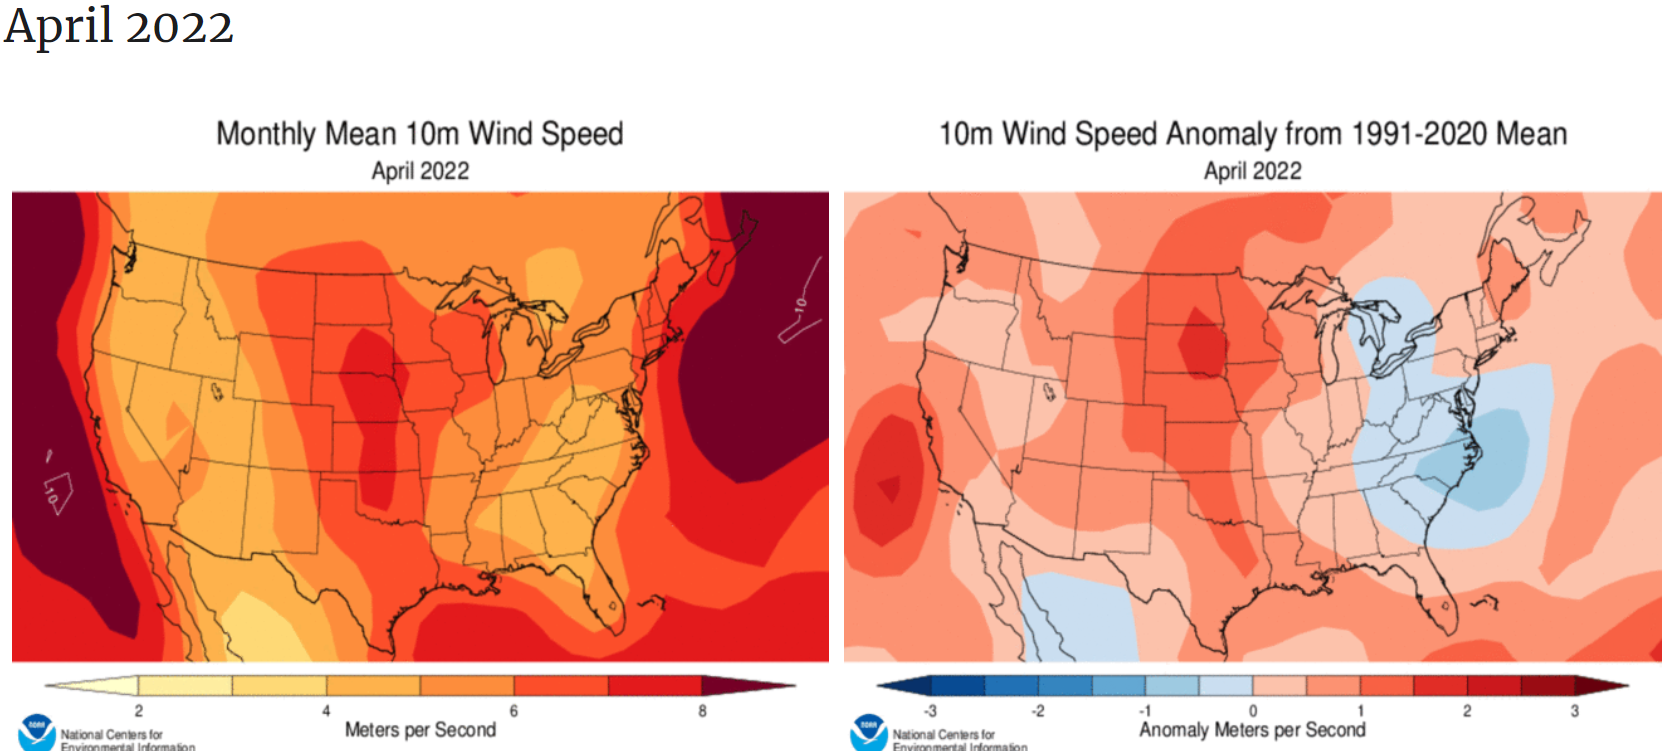
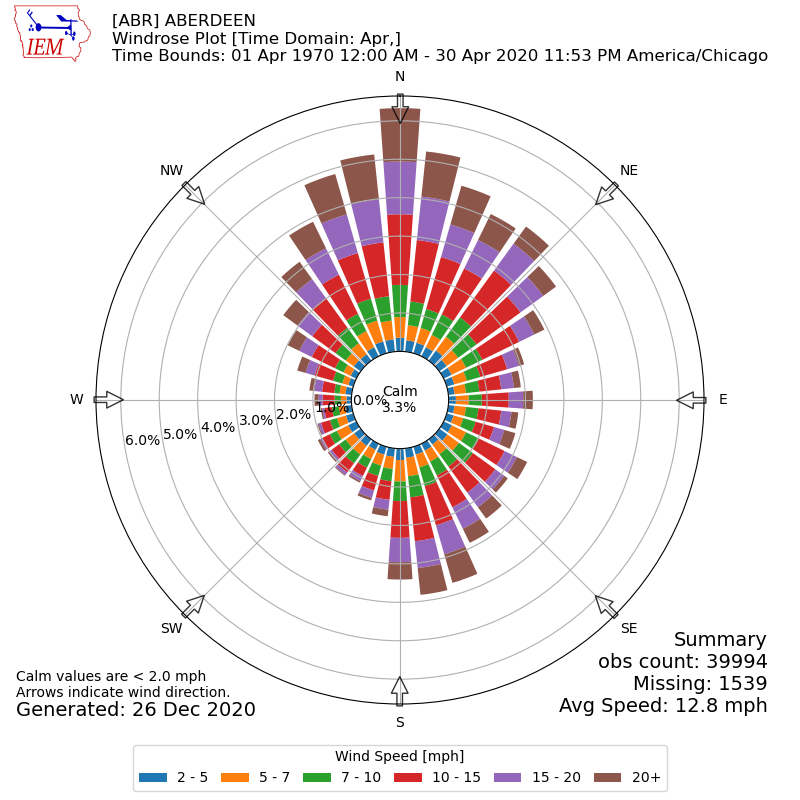
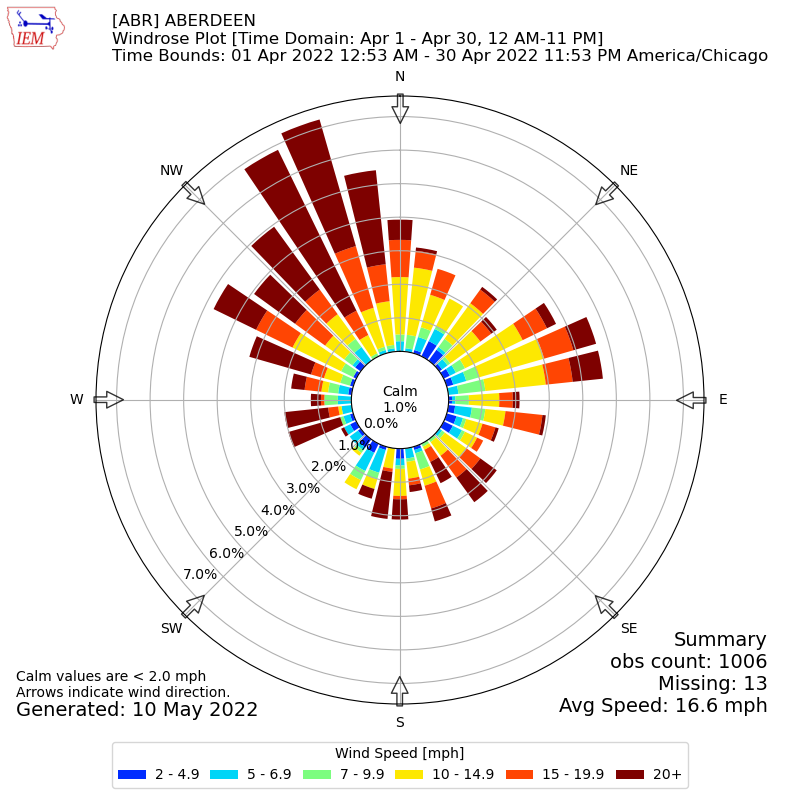
As you can see, we can confirm that it's been windy, and above average. But most of us already knew that! Also note that "average wind speed" is what's being reported here - that is the best way to compare over longer time periods of data and is therefore the best way to provide perspective. Wind roses are another great tool to show what the average wind has been at specific locations, and provide additional information on the direction of the wind as well. Wind roses can be found at the SD Mesonet from SDSU and from the Iowa Environmental Mesonet website. Below are examples for Aberdeen. On the left is a plot of what the wind speed and direction normally looks like through the month of April, whereas the plot on right is what April 2022 looked like. The main thing to notice is how much larger a percentage of time we had 20+ mph winds this April (maroon color, and out of the northwest) vs normal (brown color). Notice too on this April's plot how the average wind was 16.6 mph and we were calm only 1% of the time!
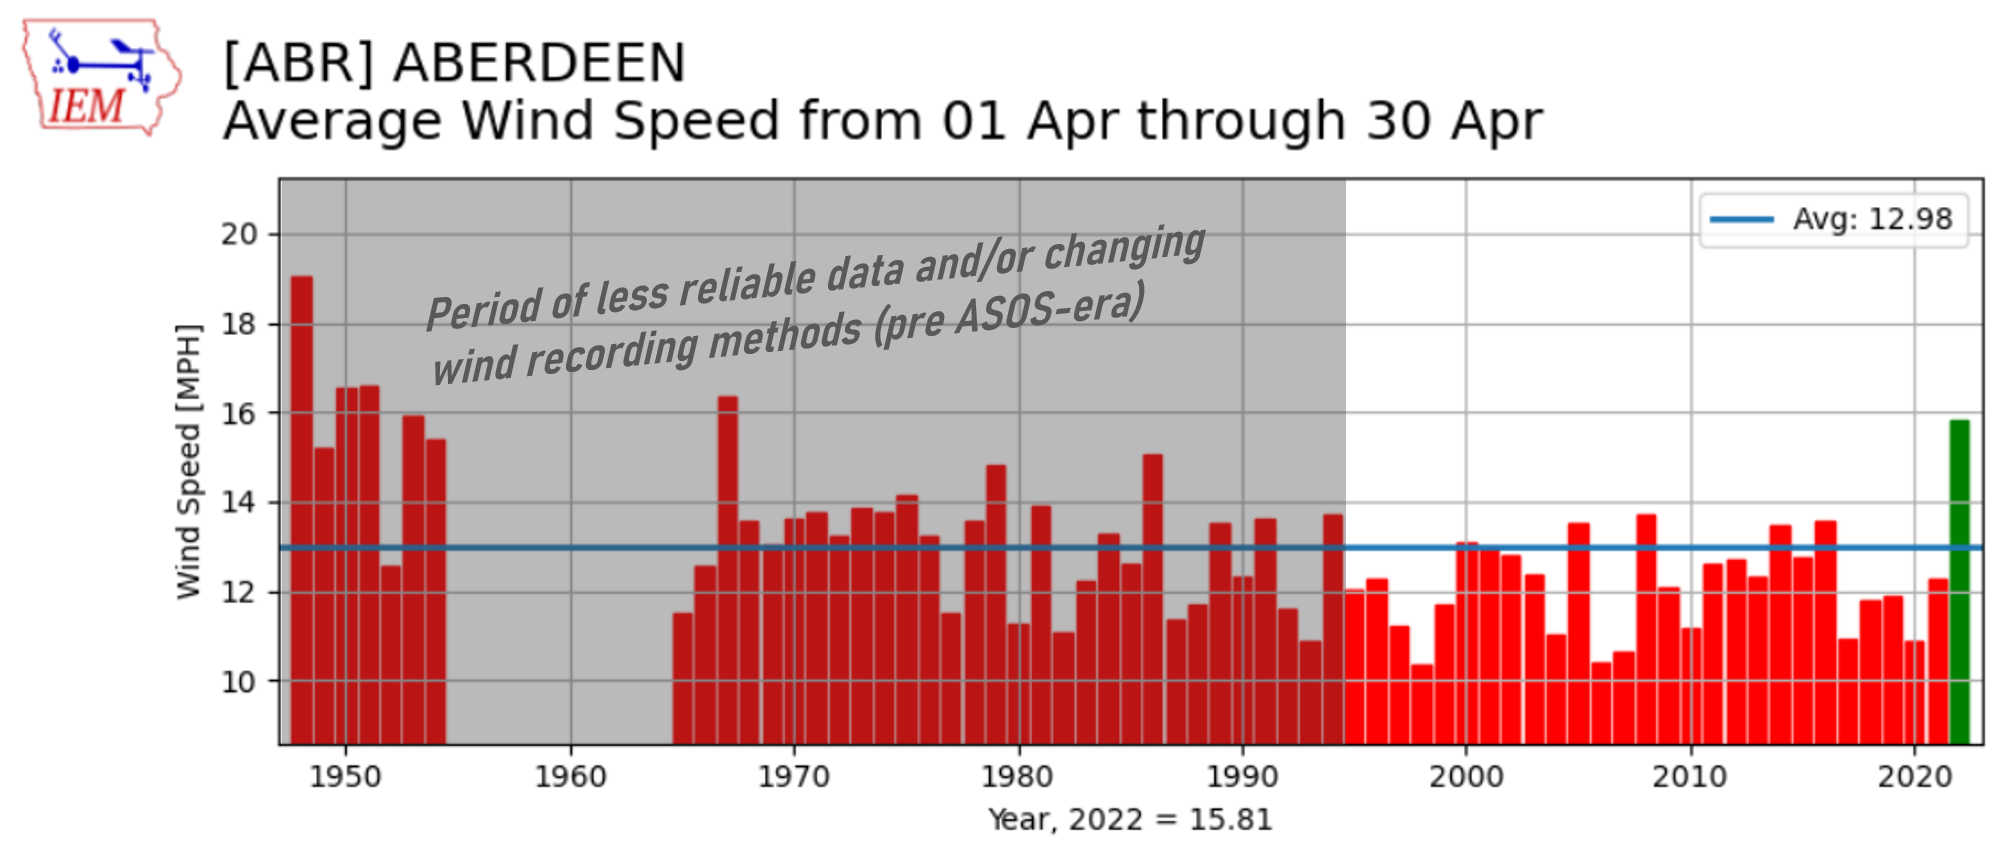
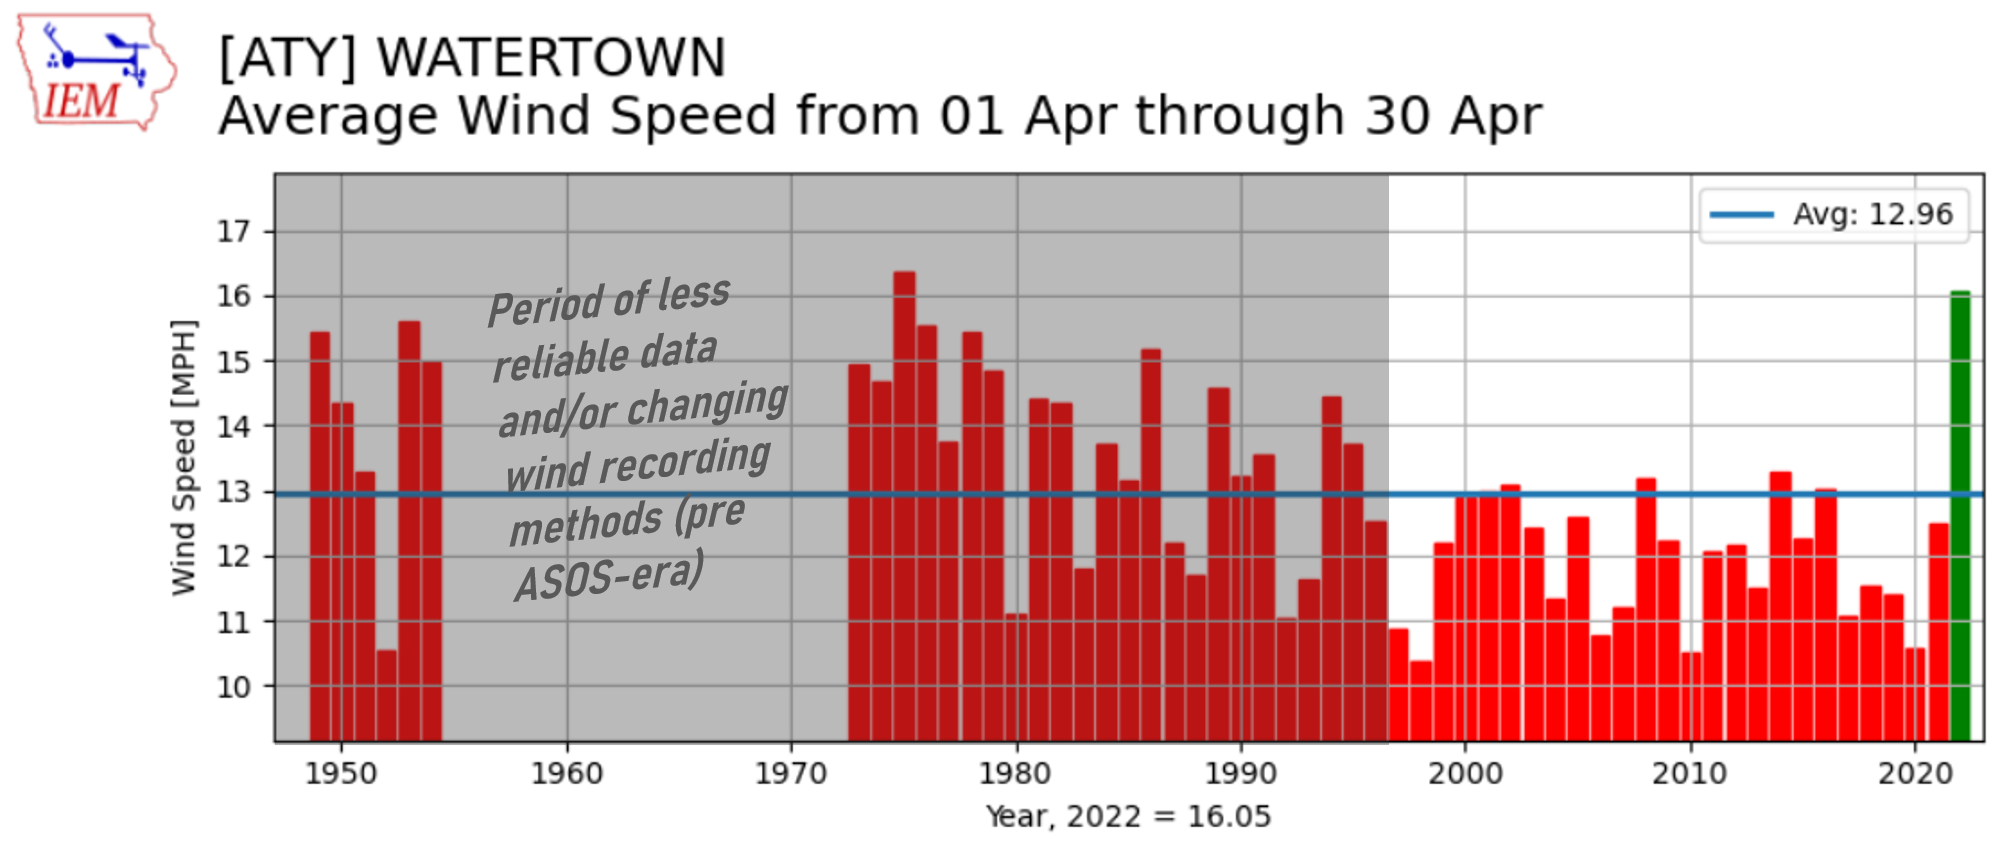
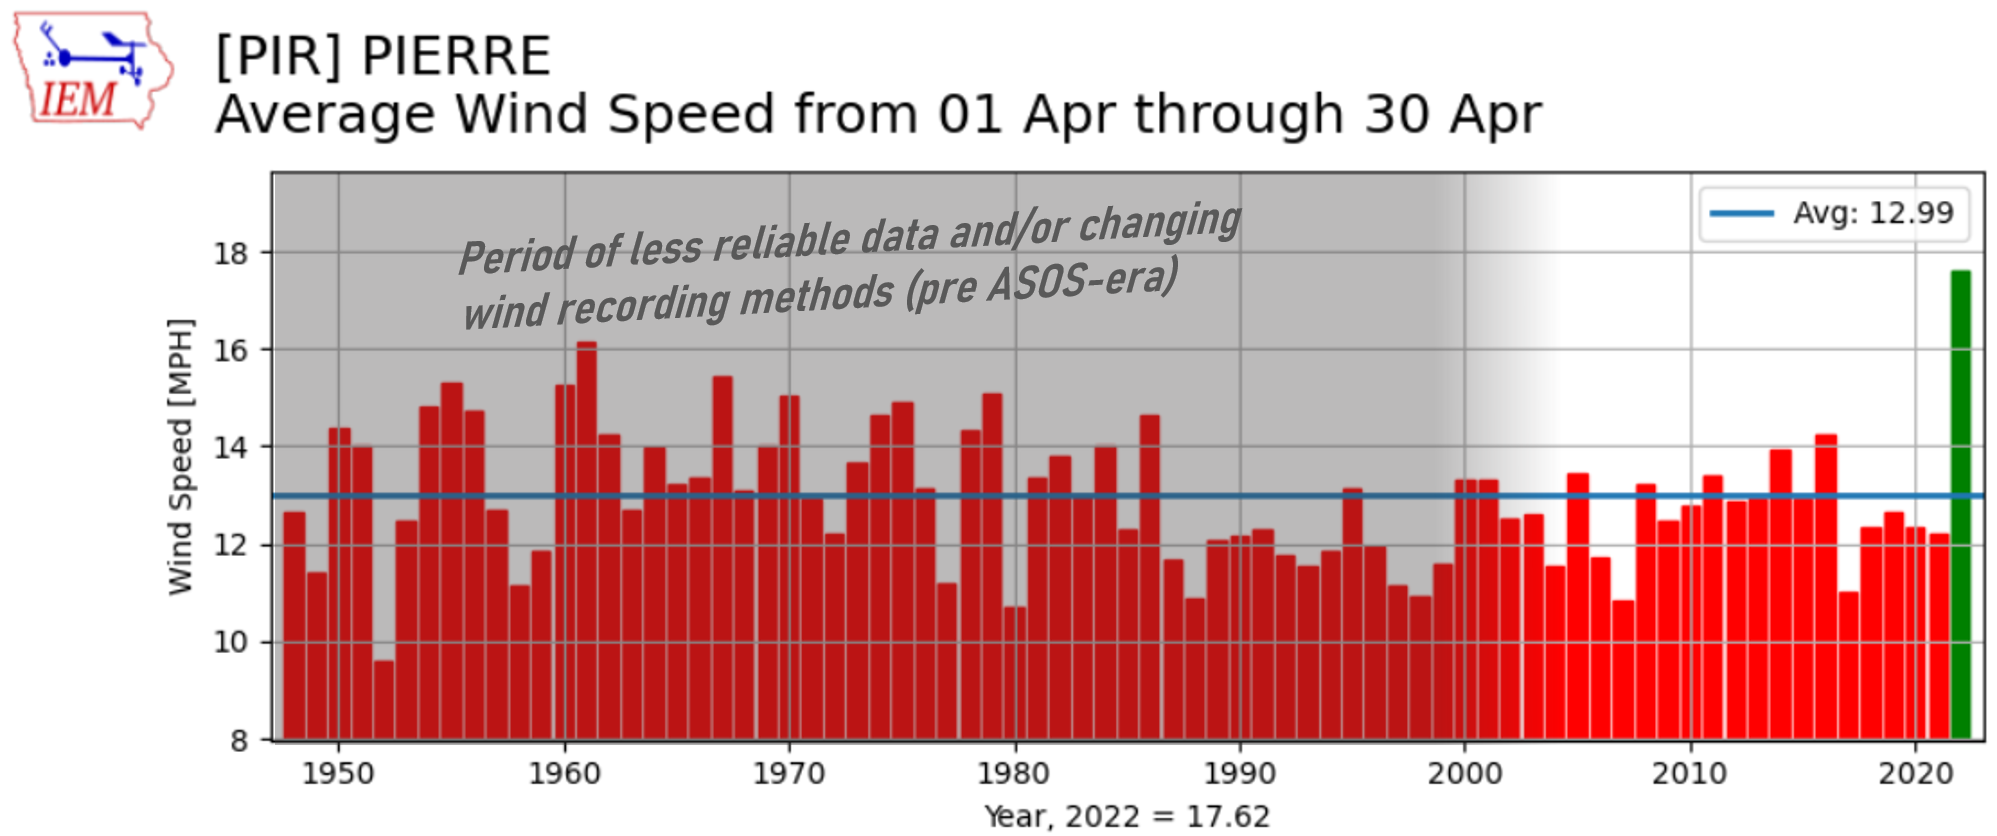
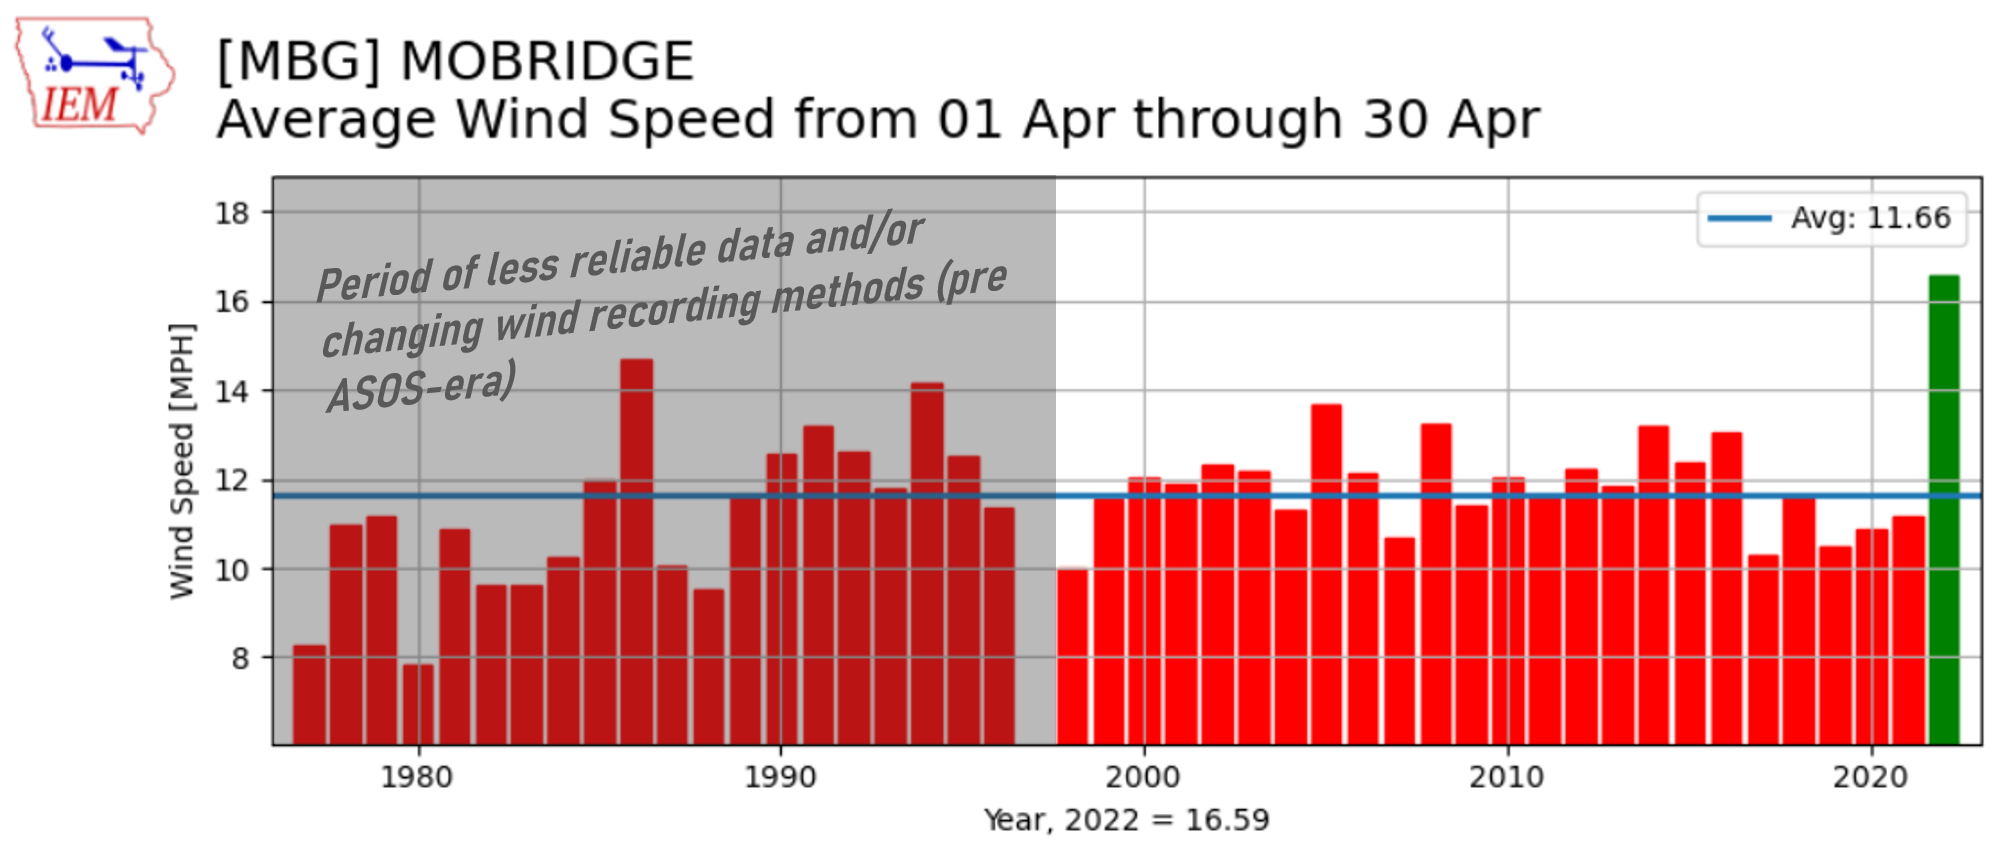
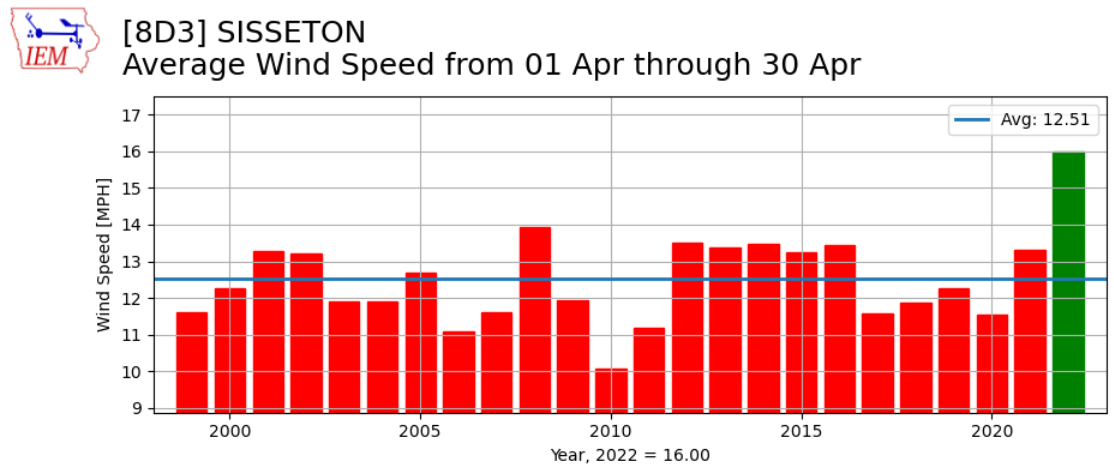
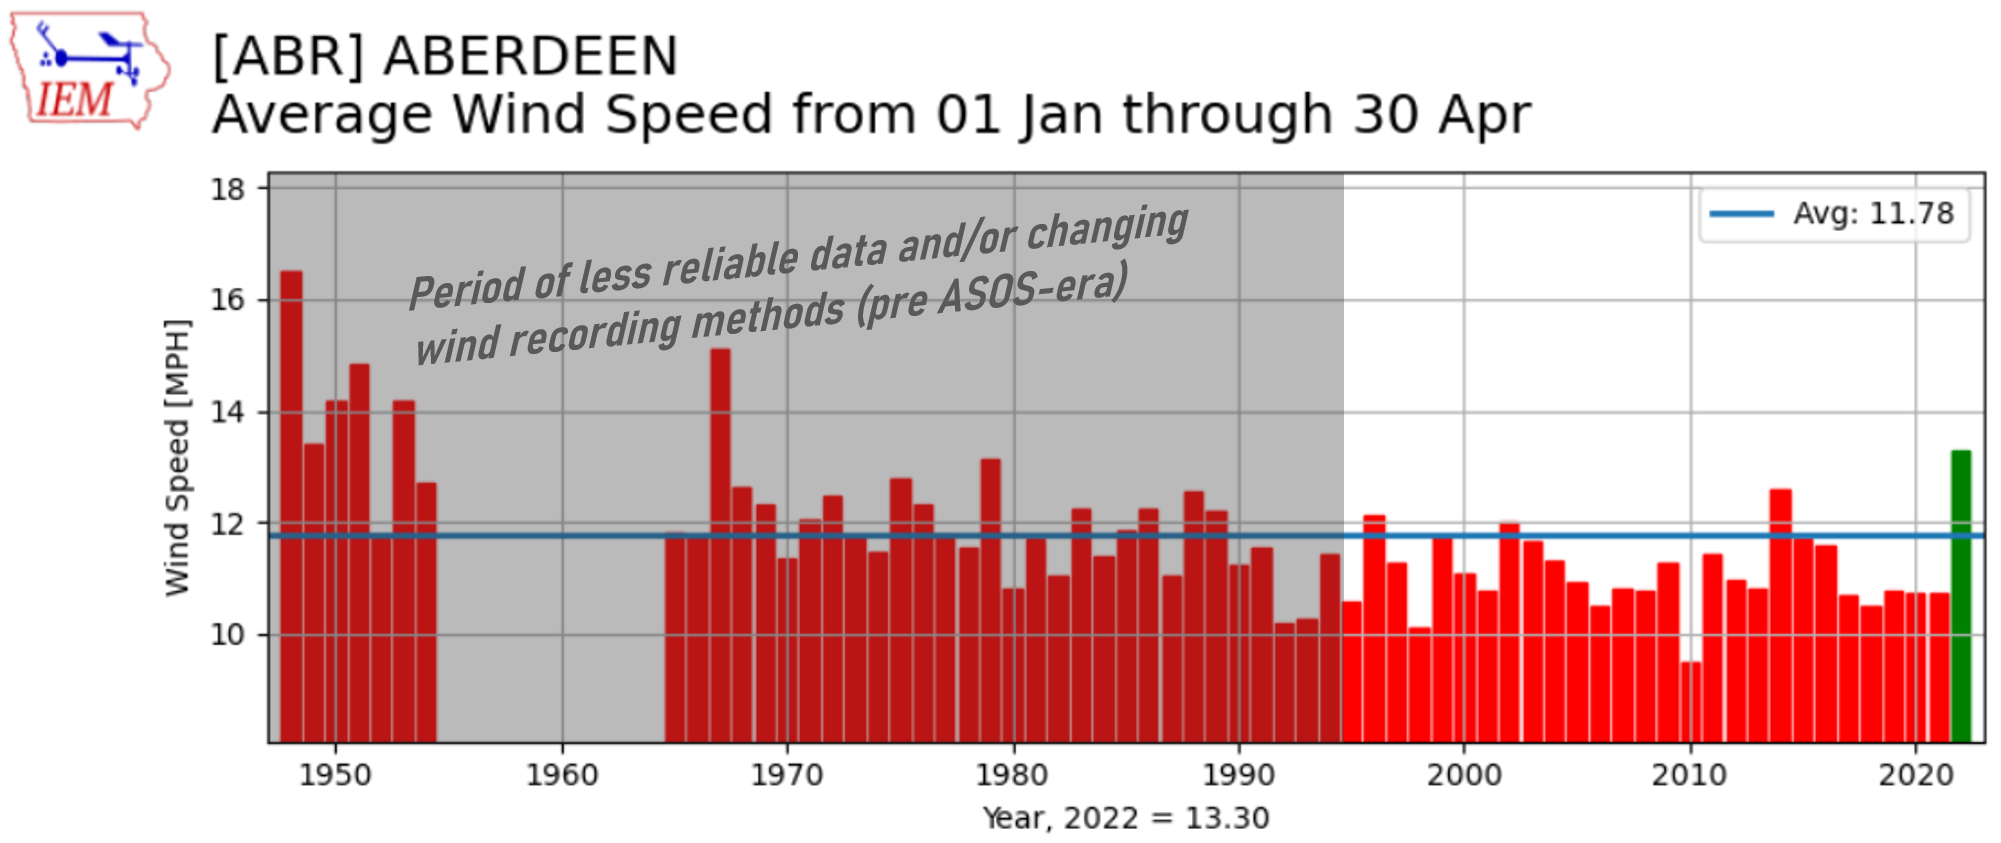
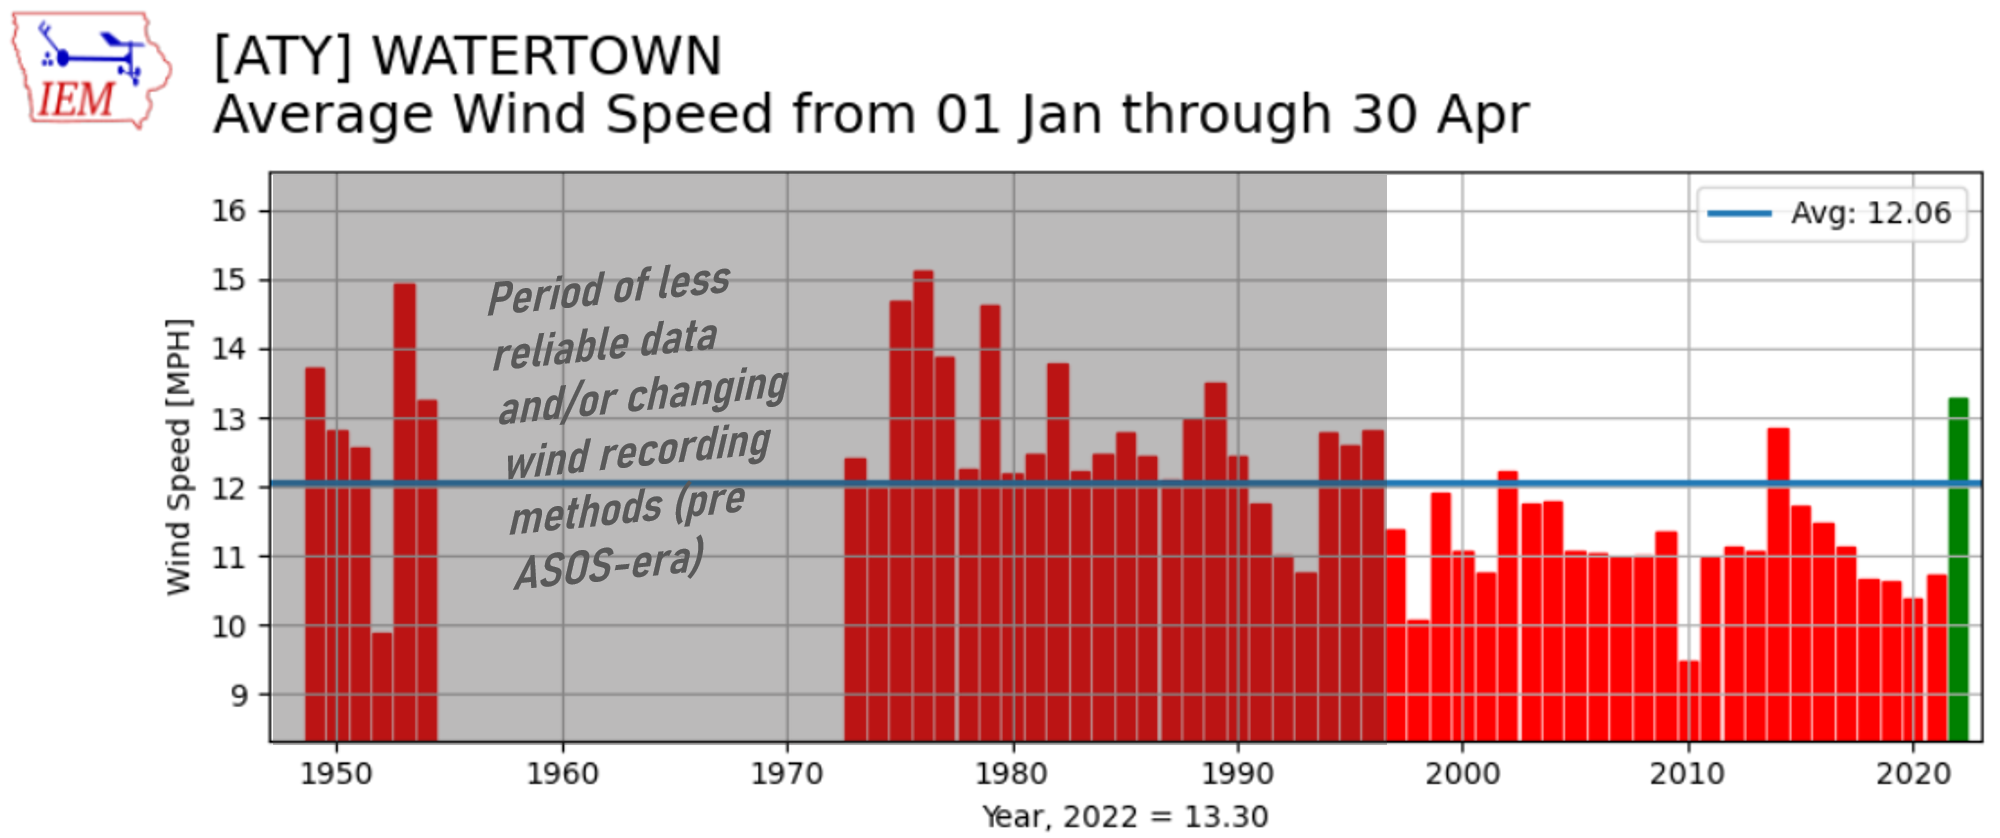
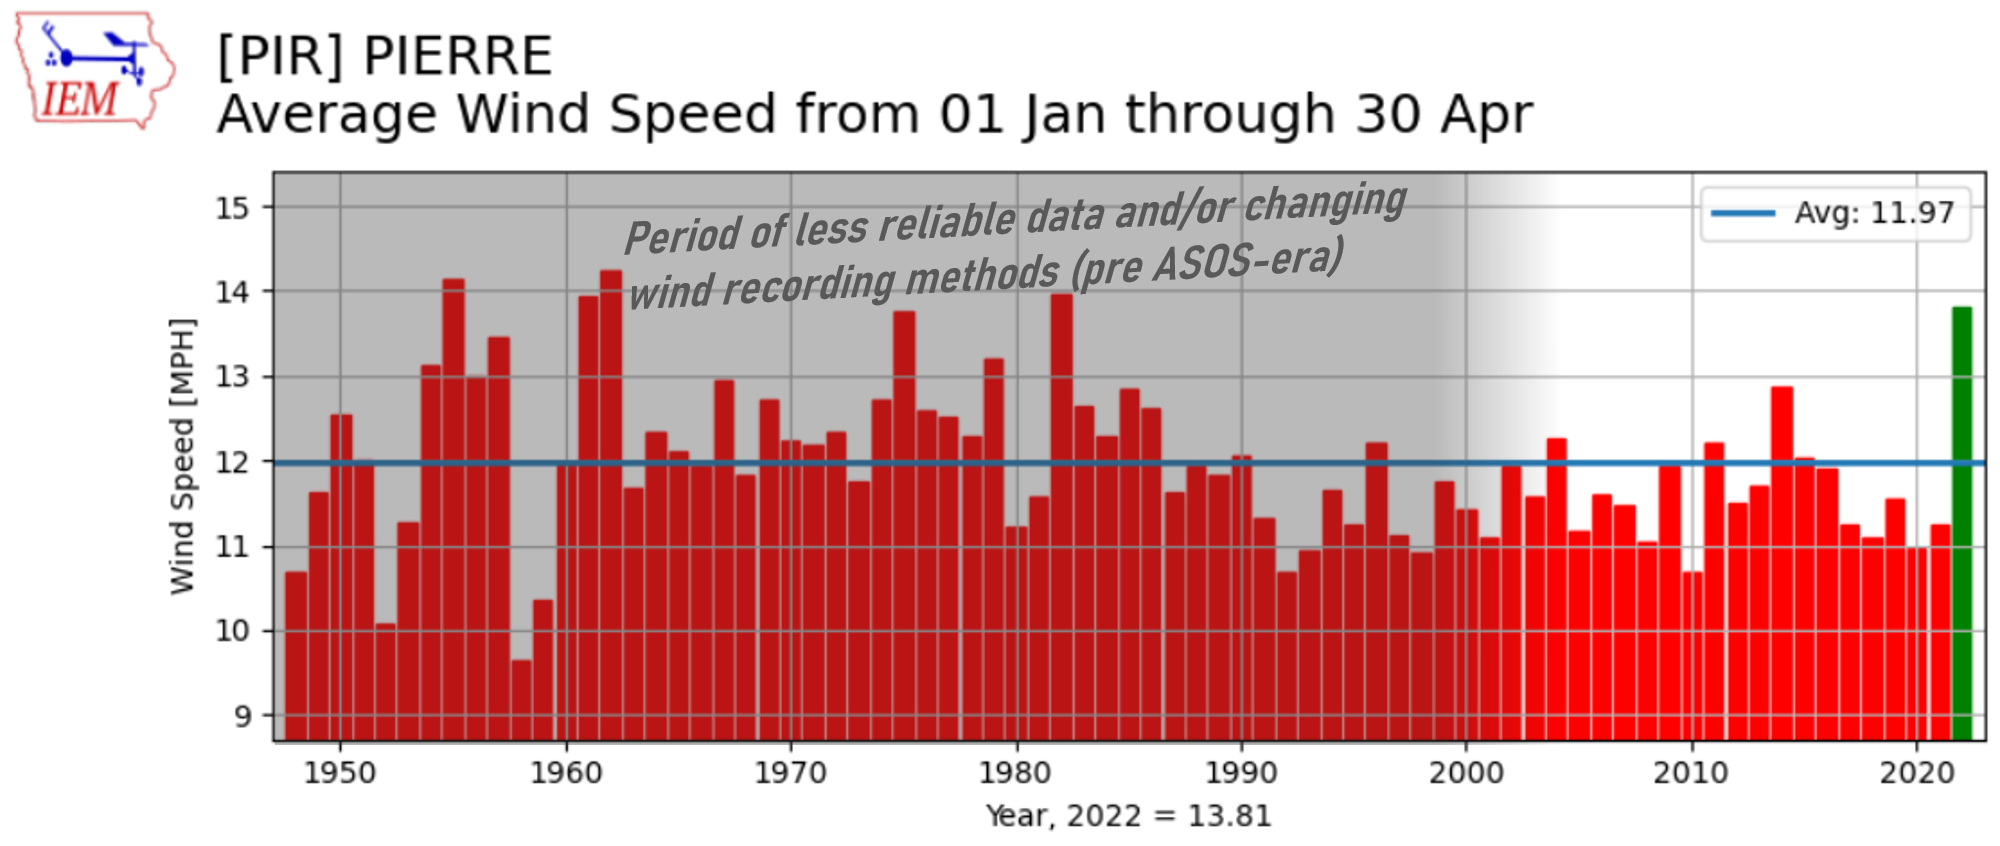
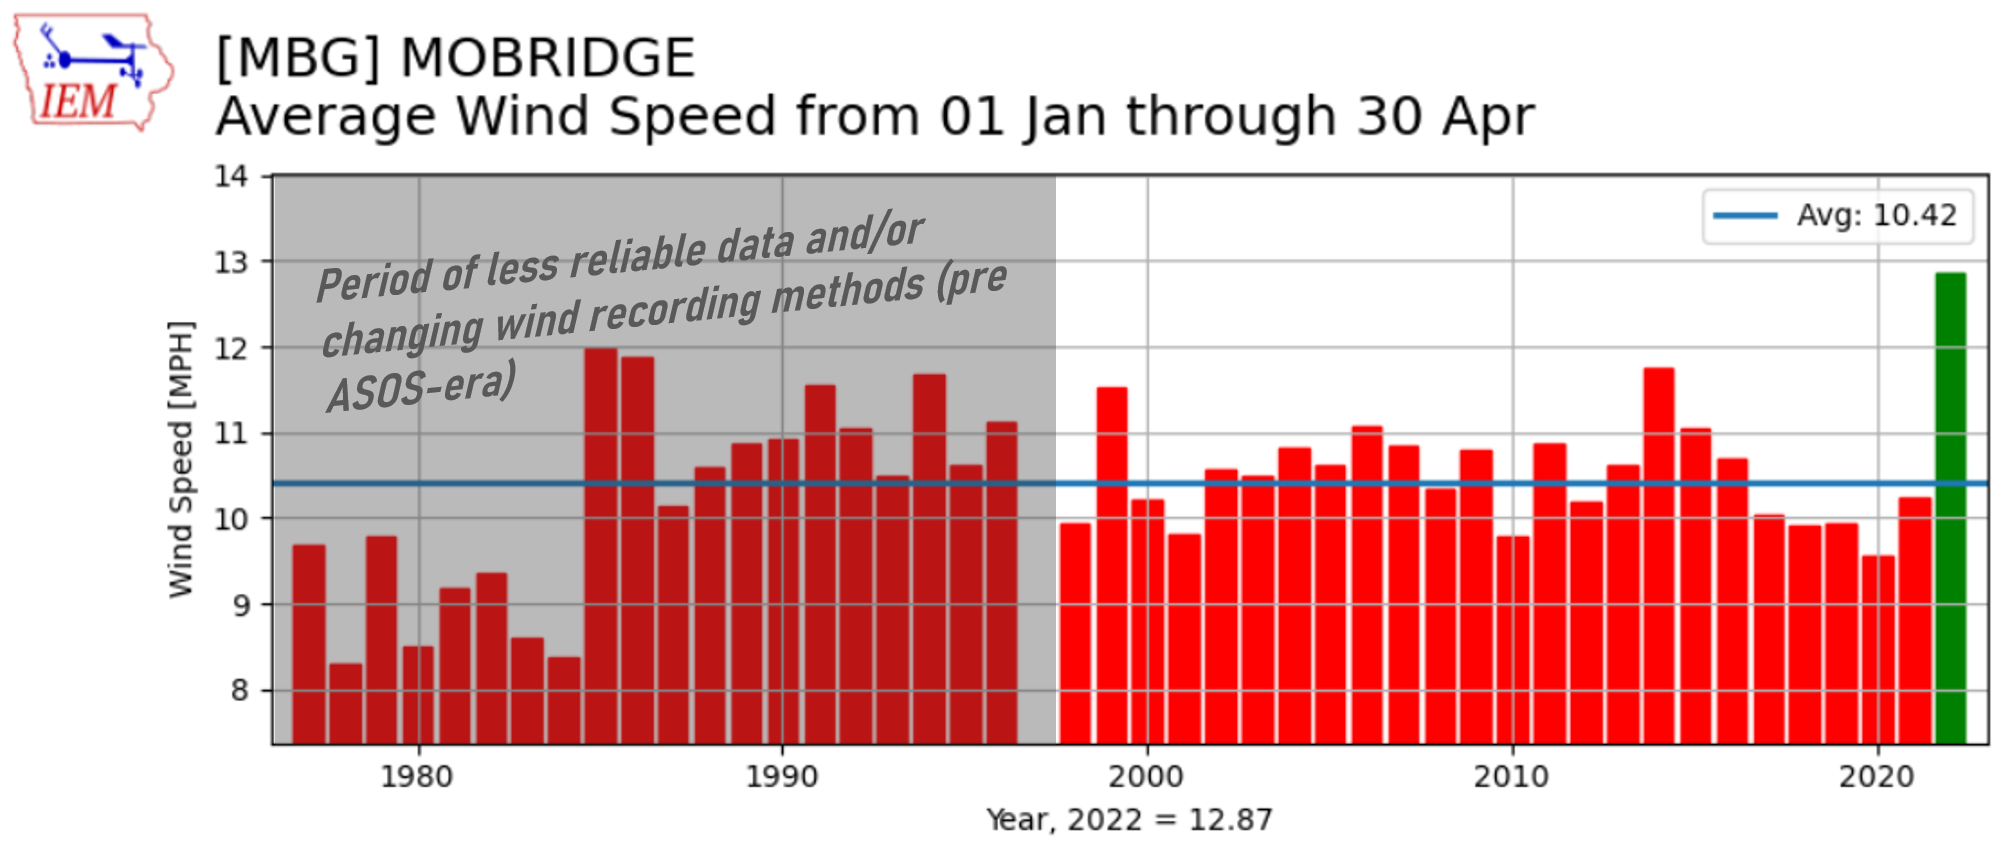
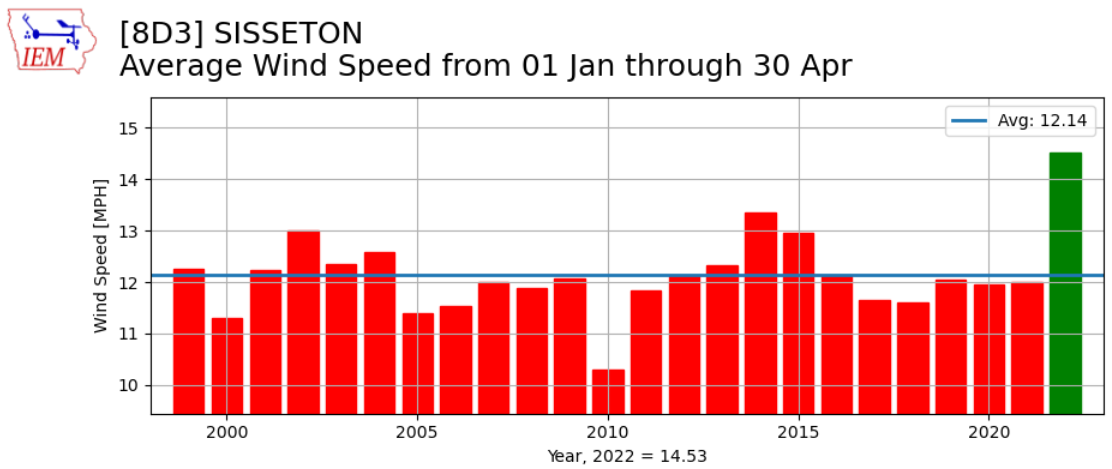
Now that we know what our average wind speed is for each month at specific locations, we can make plots to compare different periods over time. The plots below are from the Iowa Environmental Mesonet (IEM), first showing how just this April compares to previous Aprils for Aberdeen, Watertown, Pierre, Mobridge and Sisseton, and then how the whole year of 2022 (January 1 - April 30) compares to previous years for the same sites. Again, we have to look at this data with some knowledge about how observations have changed over time. From Daryl Herzmann, who runs the IEM website and creates these charts and many others across the country: “Unlike temperatures, which are a bit more straight forward to measure and have long term and reliable records, the archive of wind information is problematic, to say the least. Documented and some undocumented changes in observation techniques, recording heights and reporting intervals make long term comparisons very tricky.” When using Des Moines as an example in one of these charts for April, he says, “Well, you can see the dominance of higher values during the first 30 years of the period of record, which pull the long term average up. Was it really windier back then or is this a result of changes in observation? Sadly, it is difficult to say…”
April 2022 average wind compared to past Aprils
What was responsible for the wind this April? Several large and deep low pressure systems tracked across the Northern Plains. Specifically:
 |
 |
 |
| MODIS visible satellite imagery from April 5th, 6th and 7th | MODIS visible satellite imagery from April 12th, 13th and 14th | MODIS visible satellite imagery from April 22nd, 23rd and 24th |
Looking back to the start of the year now: January 1 - April 30, 2022 average wind compared to the same time period of past years
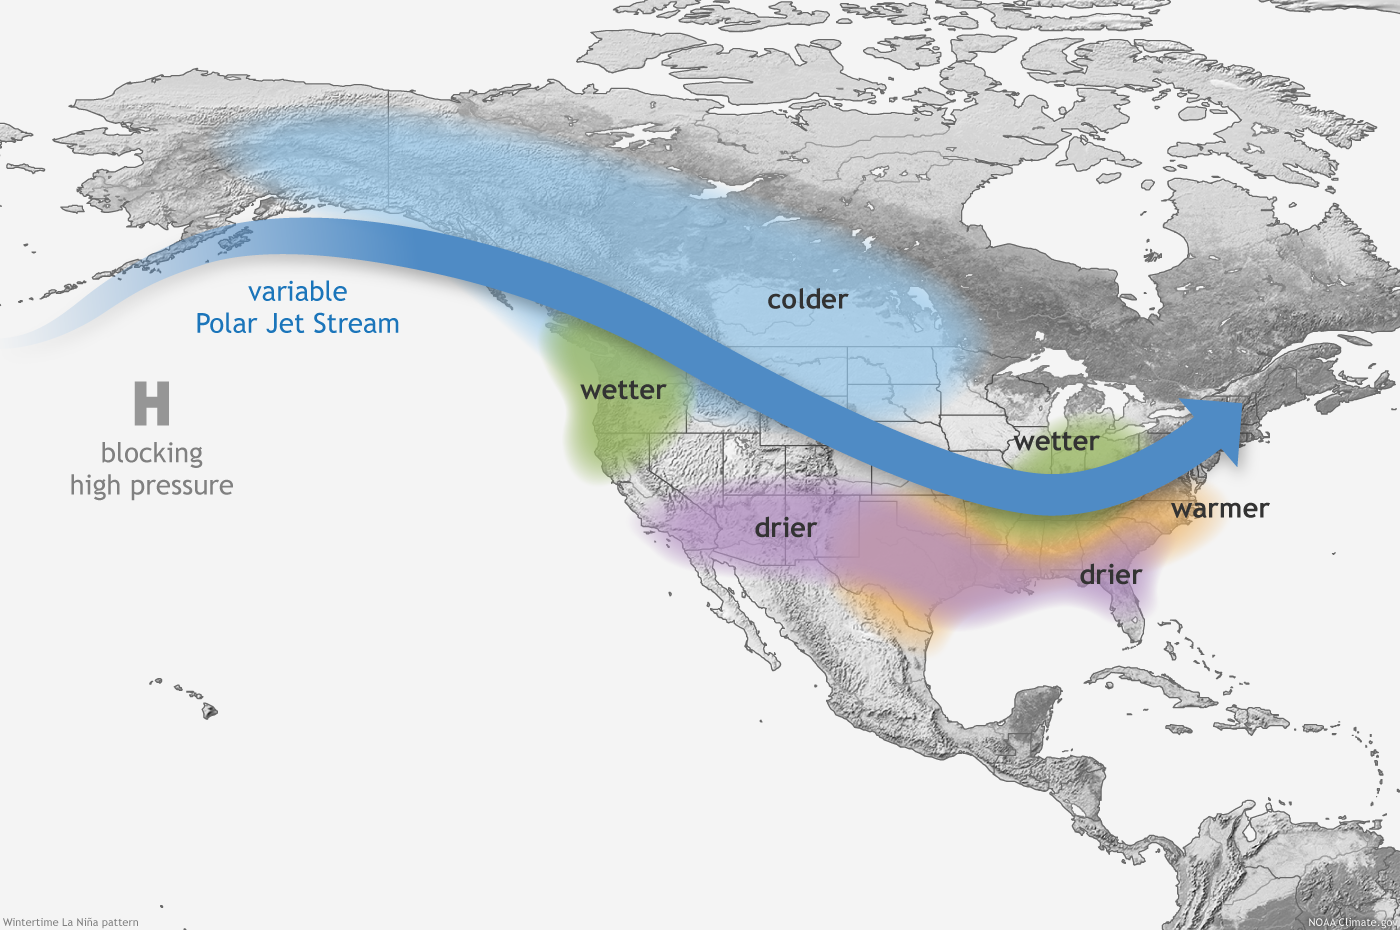
Bigger picture: La Nina has been in place all winter, and a classic La Nina pattern such as we've experienced features a jet stream, and thus active storm track, across the Northern Plains. We were indeed impacted by many clipper low pressure systems, which led to numerous bouts of snow and cold air particularly across North Dakota as well as repeated episodes of strong wind across the whole region. In fact, the Grand Forks, ND area had recorded more blizzards (11) this winter season already by February 23rd than any other on record since at least the 1979-1980 season, surpassing the previous record set in 2013-2014 and 1996-1997 (10). This spring, an active storm track continued, and included several deep Colorado Low pressure systems across the region as well, particularly in April.
La Nina is forecast to continue into the summer - find much more information about that here.