
Widespread life-threatening flash and urban flooding continues in south-central Texas, with considerable flooding impacts possible across central Texas. Wildfire smoke is impacting air quality across much of the Great Lakes region into southern New England and the Mid-Atlantic. Monsoonal thunderstorms may produce isolated to scattered flash flooding across the Southwest into the Great Basin. Read More >
February 2021 finished below average temperature-wise overall across the area, by about 5 to 10 degrees. Temperatures actually began much above average though, continuing the established norm this cold season, which unfortunately further contributed to dangerously thin ice on area lakes. During this time, persistent dense freezing fog developed from the morning of Jan 29th through the evening of Feb 3rd. Consequentially, as much as multiple inches of rime ice eventually accumulated on outdoor surfaces by the 2nd/3rd, and power was lost at times for some through the 4th due to the strain on power lines (wind gusts of 30 to 40+ mph on the evening of the 3rd into the 4th only exacerbated the issue). However, all this mild air came to an abrupt end from the 6th through the 17th as an Arctic air outbreak impacted the area. By some metrics, it was one of the most severe since 1996 in some locations. This, *despite* the lack of a widespread deep/fresh snow pack, which would have allowed for colder temperatures. More broadly, the United States recorded its coldest February on record since 1989 (19th coldest since records began in 1895). Much more information can be found here: https://www.weather.gov/abr/Feb6-17th2021ArcticBlast. Pierre finally reached sub-zero temperatures at the beginning of this outbreak on Feb 6th, which smashed a record for the latest first sub-zero temperature (Jan 10th in 1975). The area quickly rebounded after however, even setting record high temperatures by the 22nd, at least in Aberdeen’s case (60 F; 59 F in 1958).
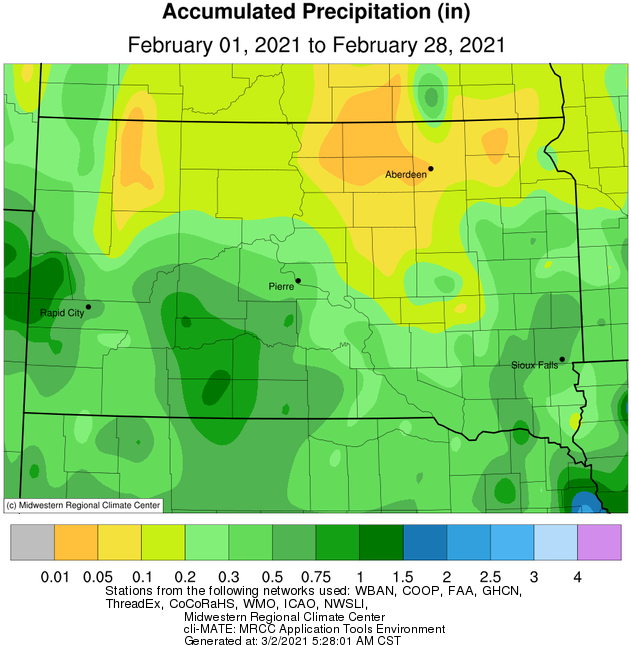
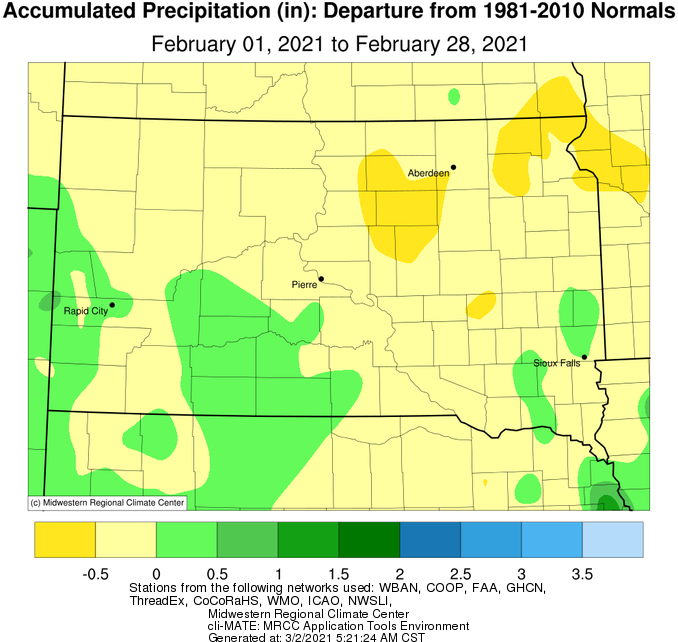
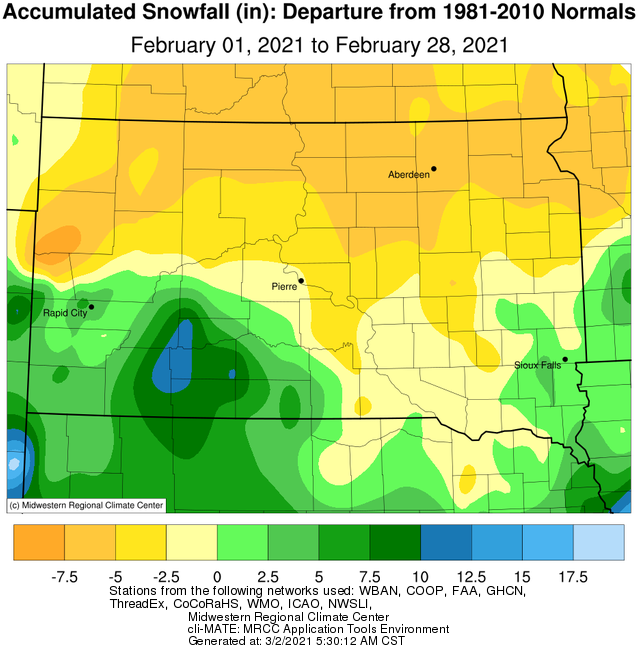
Heading into February, the area was already dry due to extended periods of below normal precipitation. This trend persisted in February, as many recorded less than a quarter inch of total moisture and less than 2” of snow. Sisseton tied their 10th driest February on record, Timber Lake tied 9th, Aberdeen 7th, and Wheaton tied driest February on record (also just a trace in 1950 and 1934). Likewise, Aberdeen tied their 6th least snowy February on record, and Wheaton tied their record least (also just a trace in 1950). Several others were just outside the top 10 in this regard. February 2021 ended with D0/Abnormally Dry to D2/Severe Drought conditions across the entire area, worsening from east to west generally speaking.
|
February 2021 |
||||
|
Temperature Data |
Aberdeen |
Sisseton |
Wheaton |
Watertown |
|
Warmest Temperature / Date |
60 /22nd |
54 / 22nd |
47 / 27th |
47 / 22nd |
|
Coldest Temperature / Date |
-25 / 15th |
-19 / 14th |
-26 / 14th |
-27 / 14th |
|
Average High / Departure from Normal |
22.1 / -5.8 |
21.3 / -6.3 |
15.1 / -10.0 |
16.5 / -10.8 |
|
Average Low / Departure from Normal |
0.6 / -6.6 |
4.1 / -4.6 |
-0.7 / -6.0 |
-0.3 / -8.1 |
|
Monthly Average / Departure from Normal |
11.3 / -6.3 |
12.7 / -5.4 |
7.2 / -8.0 |
8.1 / -9.4 |
|
Precipitation Data |
|
|
|
|
|
Monthly Precipitation / Departure from Normal |
0.07 / -0.48 |
0.12 / -0.31 |
T / -0.61 |
0.24 / -0.32 |
|
Most Precipitation in 24 hours / Date |
0.04 / 7th |
0.03 / 17th |
T / Many Days |
0.13 / 28th |
|
Monthly Snowfall / Departure from Normal |
0.6 / -6.2 |
1.1 / -7.3 |
T / -8.1 |
2.8 / -4.6 |
|
Most Snow in 24 hours / Date |
0.3 / 7th |
0.5 / 17th |
T / Many Days |
1.0 / 28th |
|
Temperature Data |
Pierre |
Kennebec |
Mobridge |
Timber Lake |
|
Warmest Temperature / Date |
63 / 22nd |
61 / 22nd |
61 / 22nd |
55 / 22nd |
|
Coldest Temperature / Date |
-24 / 14th |
-26 / 15th |
-30 / 14th |
-31 / 14th |
|
Average High / Departure from Normal |
26.4 / -8.5 |
26.9 / -10 |
25.8 / -5.4 |
23.7 / -8.7 |
|
Average Low / Departure from Normal |
5.1 / -8.7 |
4.8 / -9.3 |
0.7 / -9.4 |
1.0 / -11.1 |
|
Monthly Average / Departure from Normal |
15.7 / -8.6 |
15.9 / -9.6 |
13.3 / -7.5 |
12.3 / -10.0 |
|
Precipitation Data |
|
|
|
|
|
Monthly Precipitation / Departure from Normal |
0.40 / -0.19 |
0.29 / -0.19 |
0.11 / -0.33 |
0.10 / -0.49 |
|
Most Precipitation in 24 hours / Date |
0.20 / 28th |
0.21 / 28th |
0.04 / 7th |
0.05 / 7th |
|
Monthly Snowfall / Departure from Normal |
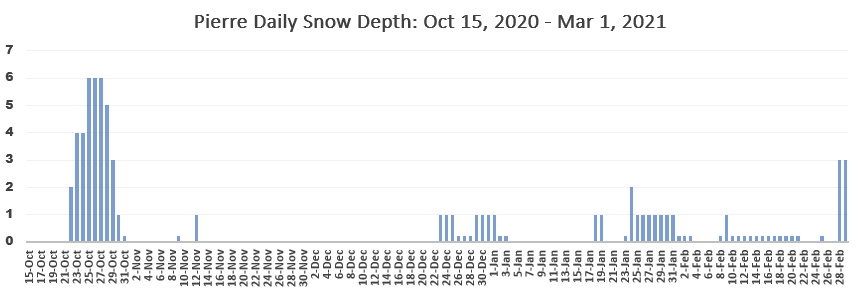
3.5 / -2.4 |
5.0 / -1.1 |
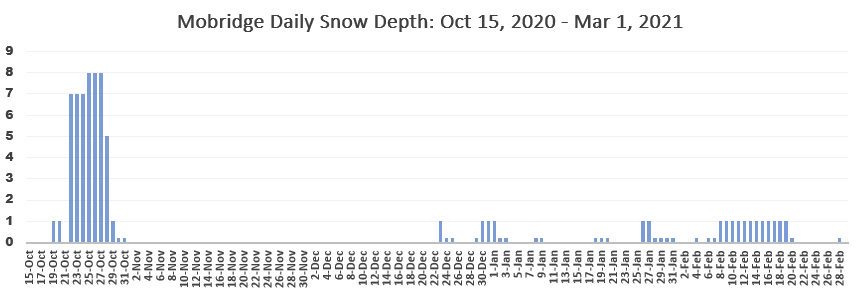
1.1 / -4.8 |
1.3 / -5.4 |
|
Most Snow in 24 hours / Date |
2.0 / 28th |
3.5 / 28th |
1.0 / 7th |
0.6 / 7th |
Average temperature departures from normal February 2021, courtesy of the Midwestern Regional Climate Center
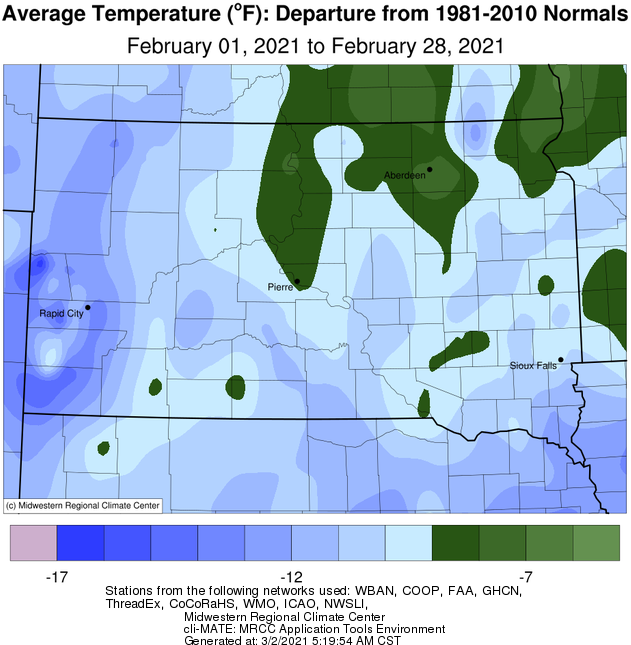
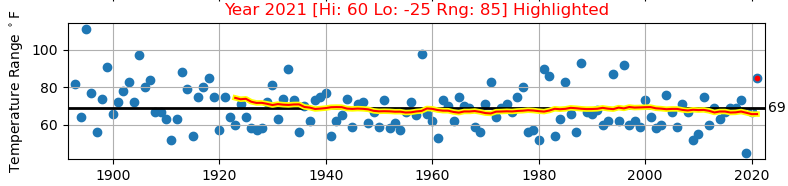
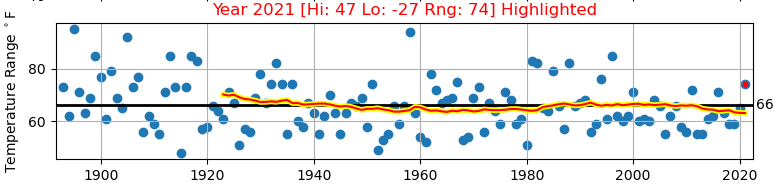
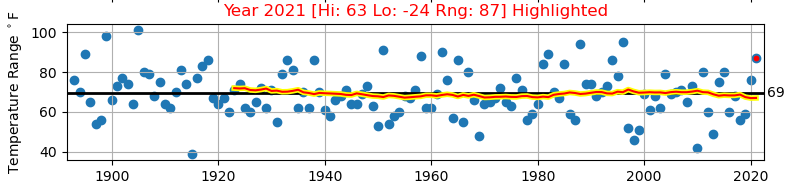
Despite temperatures being below average on a whole, there were periods of much above average temperatures sandwiching the cold. The graphics below highlight specifically when the above average and below average readings occurred throughout the month at Aberdeen (top left), Watertown (top right) and Pierre (bottom left), and their magnitudes.
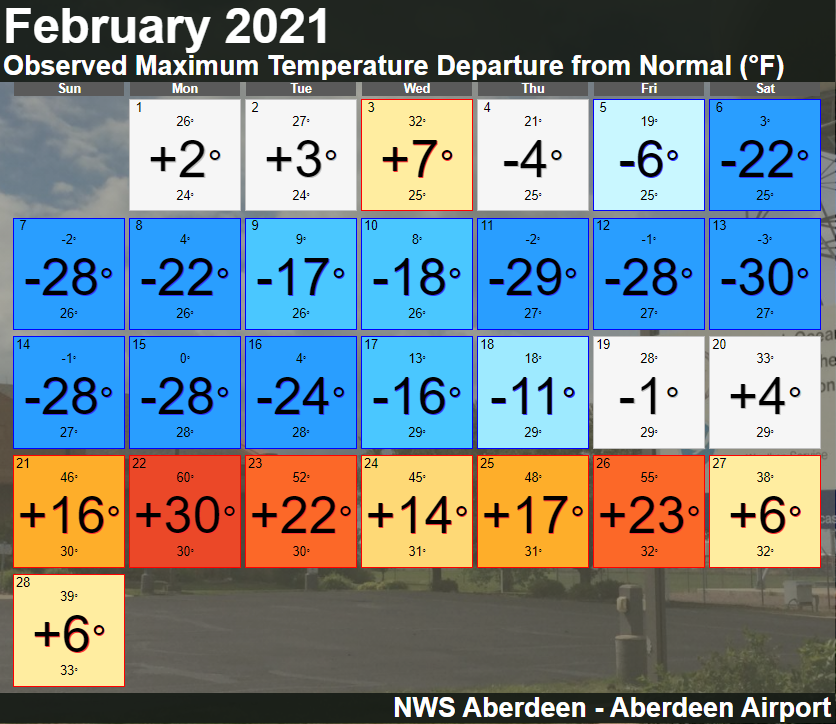
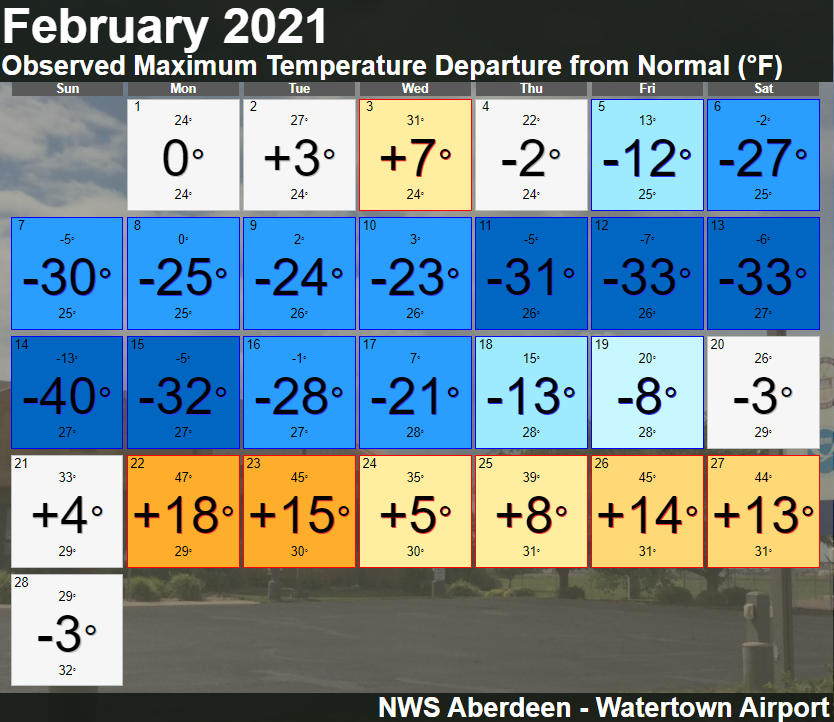
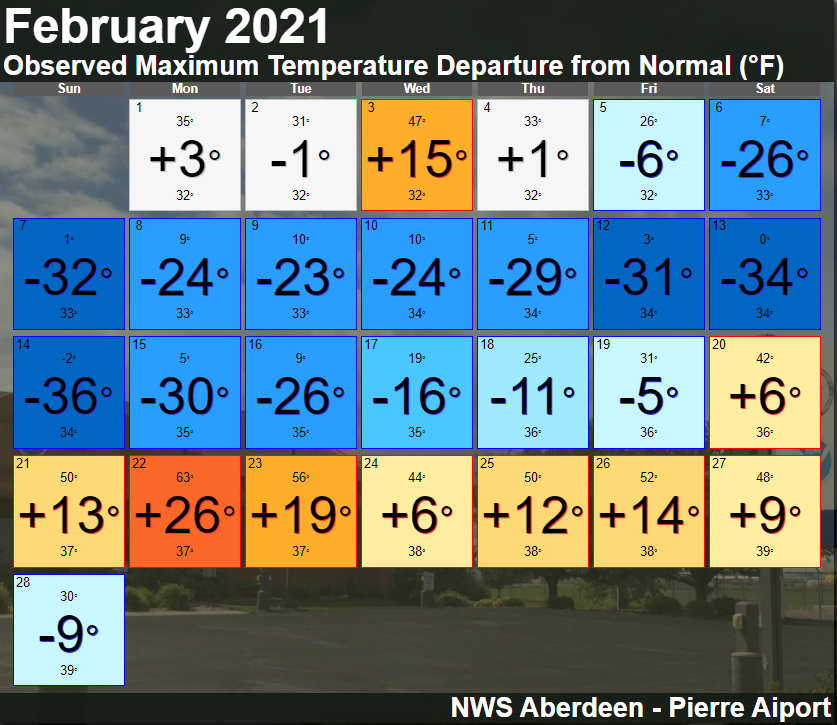
Another way to look at the temperature rollercoaster is by looking at the range of temperatures, from the coldest low to the mildest high. Aberdeen's range was 85 degrees, Watertown 74 and Pierre 87! This is the greatest February range at all three locations since the late 1990s. Courtesy of ISU's Iowa Environmental Mesonet
Aberdeen
Watertown
Pierre
Precipitation totals (left) and departures (right) for February 2021, courtesy of the Midwestern Regional Climate Center
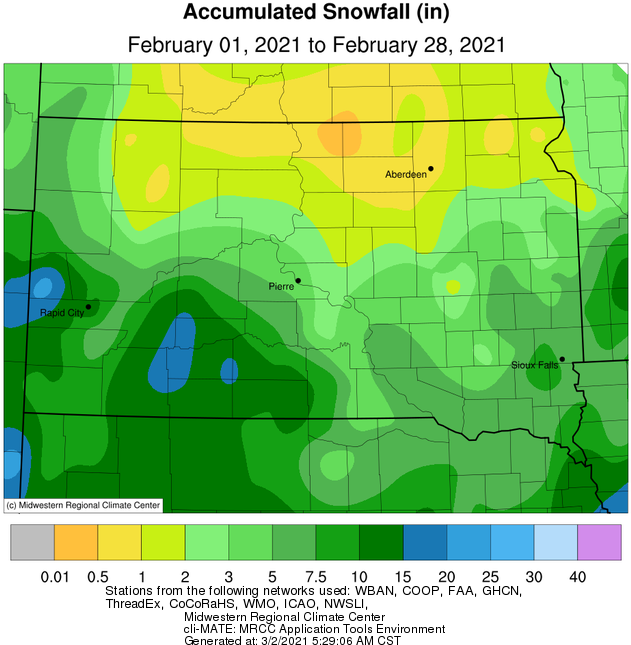
Snowfall totals (left) and departures (right) for February 2021, courtesy of the Midwestern Regional Climate Center
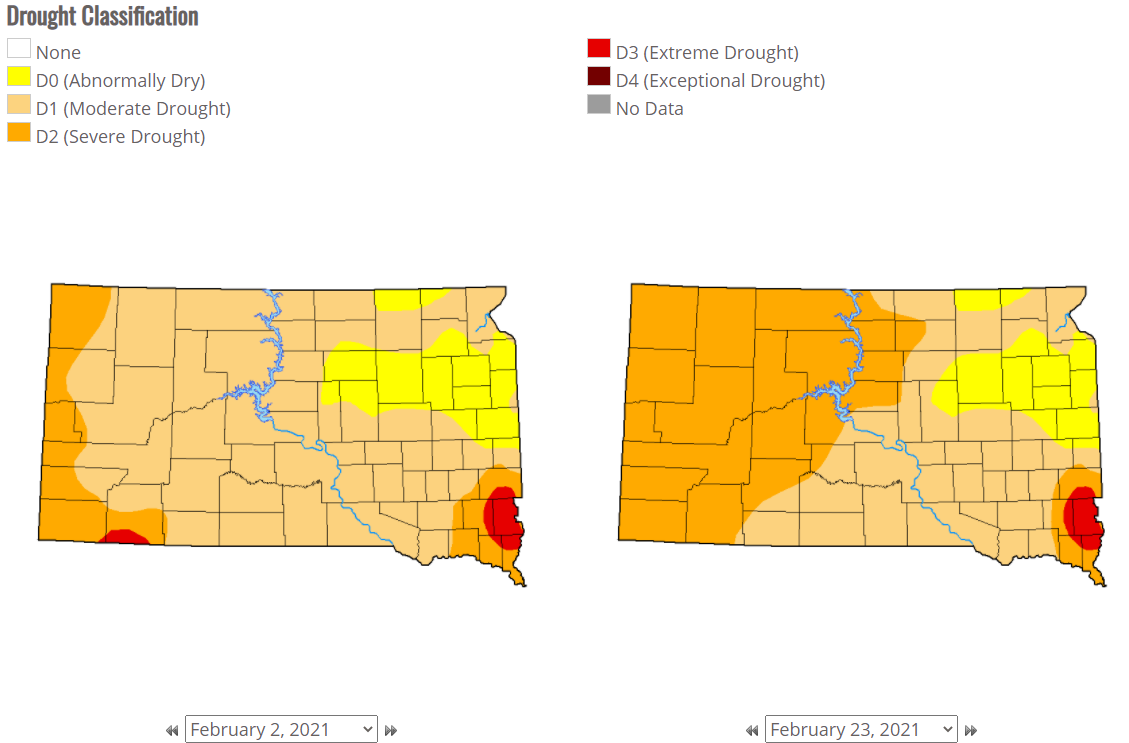
Given the persisting below average precipitation, portions of central South Dakota have worsened from Moderate to Severe Drought from the beginning towards the end of the month. West central Minnesota remained unchanged in the D1/Moderate Drought or D0/Abnormally Dry category. More here.
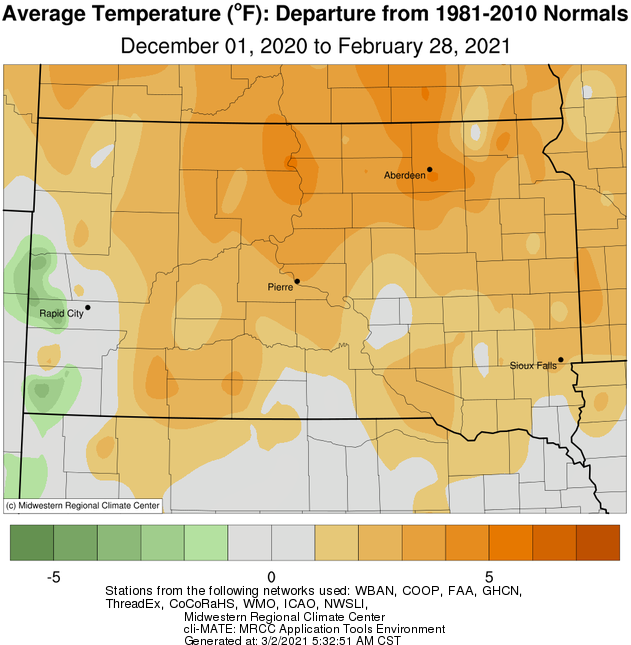
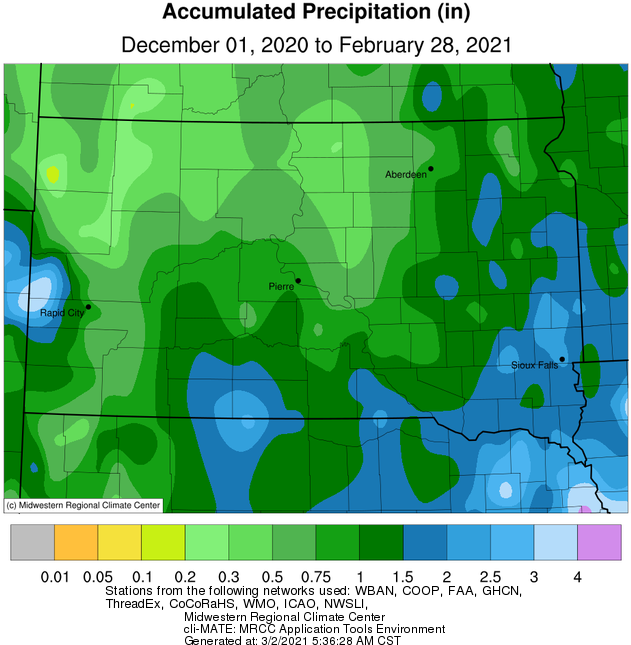
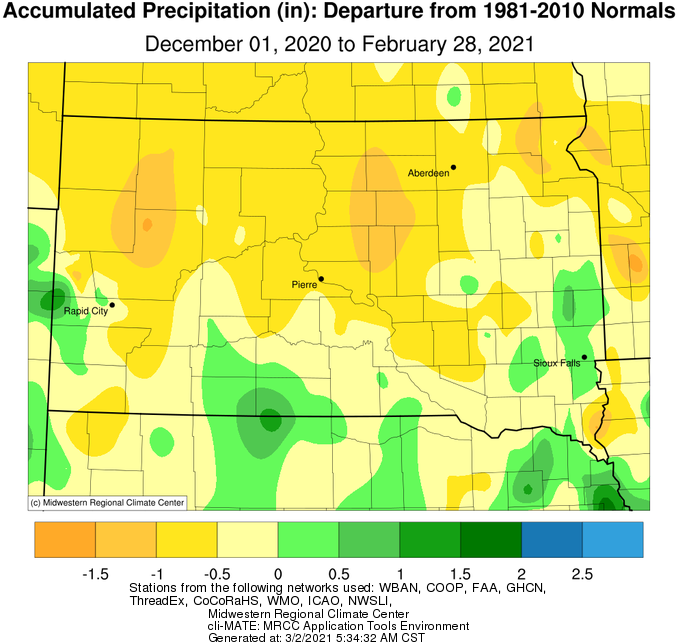
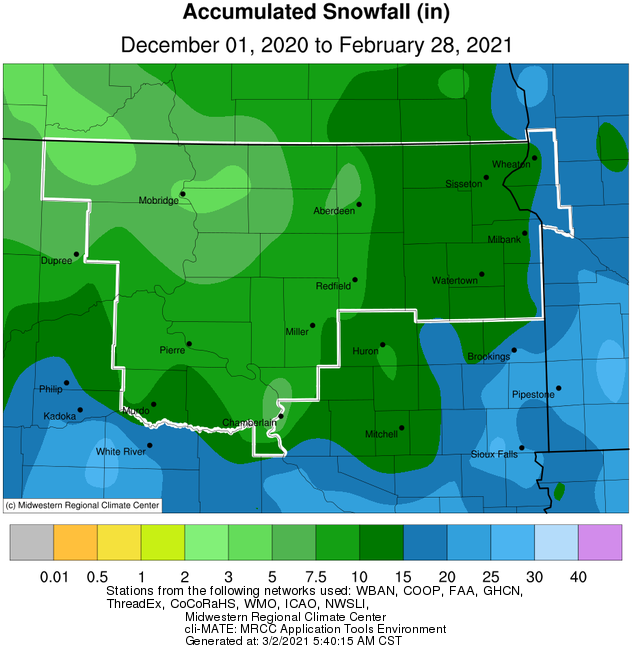
Meteorological winter extends from December 1st through February 28th. How did our area fare on the whole? Despite a ~12 day stretch of historic cold in February, the rest of the winter was remarkably mild. The area finished below average in terms of precipitation and snowfall as well. Below is average temperature departures from normal, as well as precipitation and snowfall totals and departures courtesy of the Midwestern Regional Climate Center
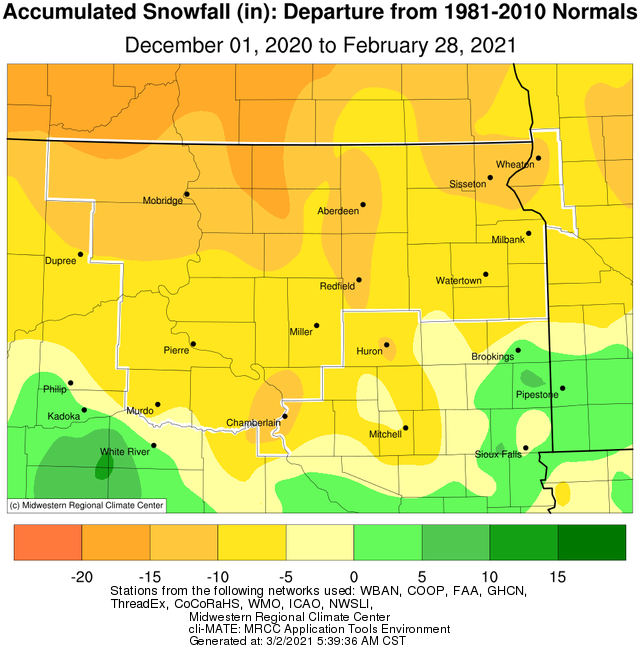
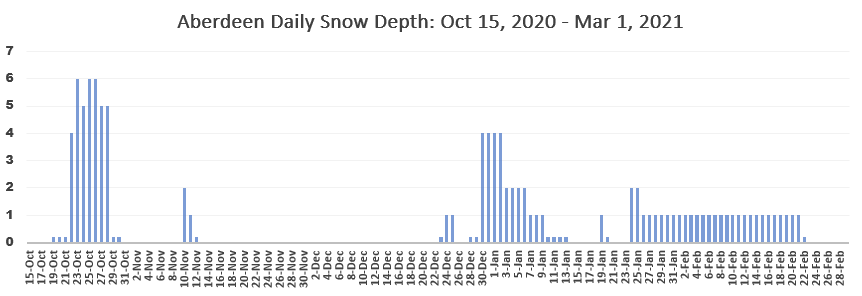
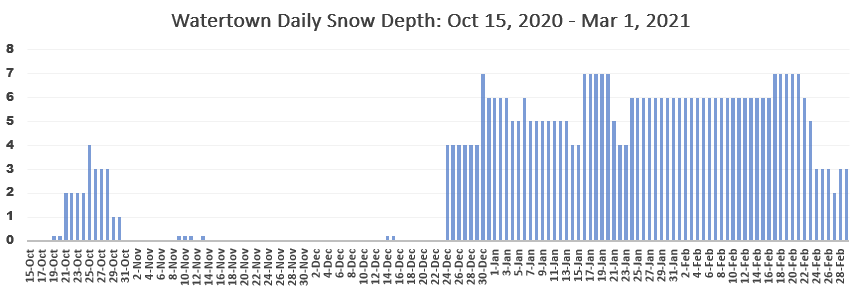
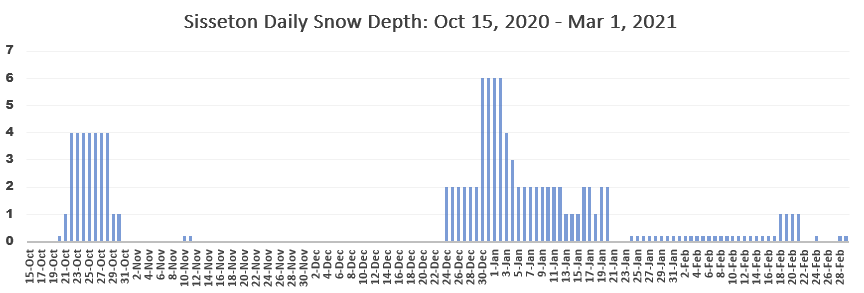
Daily snow depth from October 15 through March 1st shows how much of the area lacked in snow and/or how mild it was, at least compared to normal. Also, the greatest snow depth in some locations occurred in October!
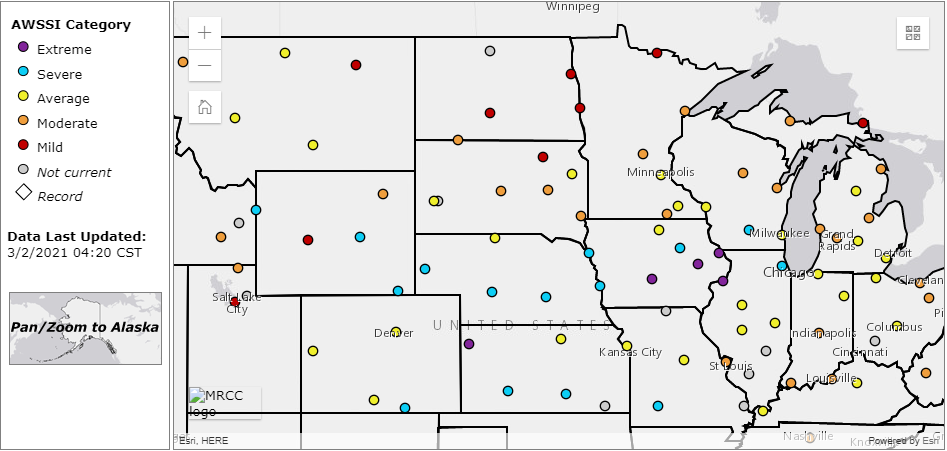
Another way to visualize how the winter compares to normal is via the MRCC Accumulated Winter Season Severity Index (AWSSI). You can track in time the stretches of varying degrees of "winter" at specific points. For instance, notice below at Aberdeen, Watertown and Pierre (in that order) the uptick in severity in early to mid-February. Regardless, this winter season has finished Average to Mild across our area (at least through March 1st).
.jpeg)
.jpeg)
.jpeg)

