Record setting heat is expected over the next several days from the Intermountain West through the northern Plains. Furthermore, fire weather concerns increase with dry and breezy conditions. Meanwhile, heavy rainfall and severe thunderstorm threats for the Ohio/Tennessee Valleys, central Appalachians and Southeast today. The threat shifts to central Gulf Coast and across central Texas this week. Read More >
October finished above average temperature-wise across the area, by 2 to 6 degrees. The warmest periods were from the 2nd through the 9th and from the 16th through the 19th when high temperatures rose into the 70s and 80s. Overall on the year, Aberdeen has now recorded 116 days with a high temperature of at least 80 degrees in 2021, which ranks as the 3rd most on record (118 days in 1936 and 1900). Similarly, Timber Lake has had 106 days which ties for 4th most, Sisseton 103 days which ranks 6th, and Mobridge 106 days which ranks 9th. Cooler temperatures arrived for the second half of the month: the growing season ended, as hard freezes occurred, and albeit light, the first snow of the season took place at some locations on the 20th.
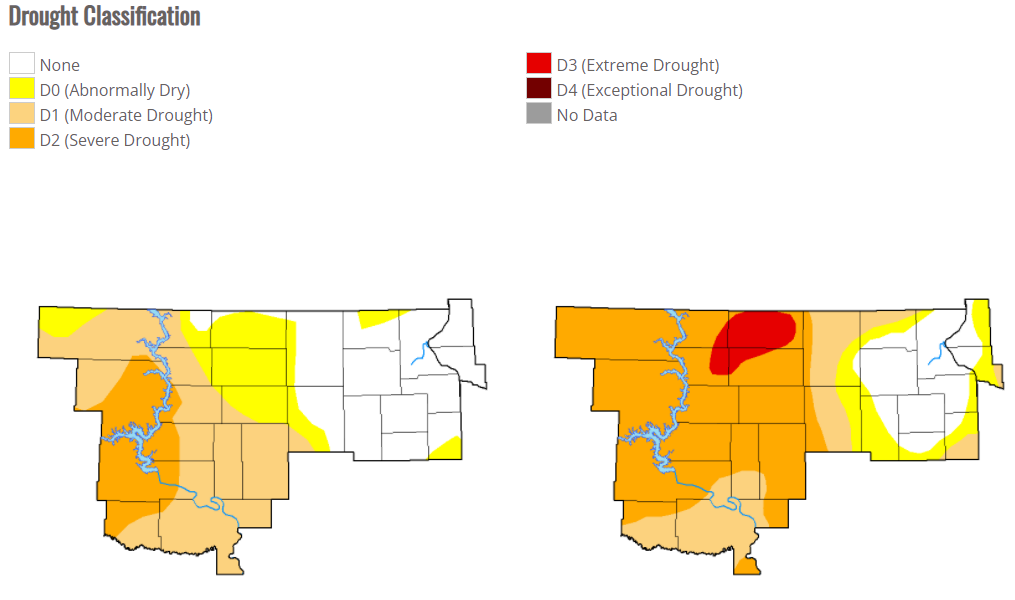
A shift to a wetter pattern, particularly across northeastern South Dakota, continued into October when several systems impacted the area. Wheaton and Mobridge recorded their 8th wettest October on record, Timber Lake 7th, Sisseton and Aberdeen 6th, and Watertown 2nd with 7.63” of rainfall (8.10” in 1971). Daily record rainfall occurred on the 9th, 13th, 20th and 27th at Aberdeen, Watertown, Sisseton and/or Mobridge. Unfortunately, late-season severe weather including several tornadoes accompanied these systems on the 9th and 13th across northeastern South Dakota and west central Minnesota. Prior to 2021, there had been just 18 total October tornadoes confirmed in the state of South Dakota, and 29 in Minnesota. 10 additional tornadoes were confirmed in South Dakota and 14 in Minnesota this October alone. Find much more information here: https://www.weather.gov/abr/October2021SevereWeather. Drought conditions continued to improve in response, going from D3/Severe Drought across portions of north central SD and D2/Severe Drought across the majority of Central SD on September 28th, to just portions of D2/Severe Drought across Central SD by October 26th.
|
October 2021 |
||||
|
Temperature Data |
Aberdeen |
Sisseton |
Wheaton |
Watertown |
|
Warmest Temperature / Date |
88 / 4th |
84 / 4, 5th |
82 / 5th |
81 / 4, 8th |
|
Coldest Temperature / Date |
25 / 29th |
23 / 23rd |
28 / 23rd |
28 / 16, 31st |
|
Average High / Departure from Normal |
63.6 / +4.3 |
62.8 / +4.8 |
64.4 / +3.7 |
61.0 / +4.8 |
|
Average Low / Departure from Normal |
39.9 / +6.6 |
41.7 / +6.2 |
42.1 / +5.4 |
40.2 / +5.0 |
|
Monthly Average / Departure from Normal |
51.8 / +5.5 |
52.3 / +5.5 |
51.7 / +4.5 |
50.6 / +4.9 |
|
Precipitation Data |
|
|
|
|
|
Monthly Precipitation / Departure from Normal |
4.39 / +2.25 |
4.97 / +2.64 |
4.27 / +2.27 |
7.63 / +5.68 |
|
Most Precipitation in 24 hours / Date |
1.18 / 9th |
1.35 / 13th |
1.35 / 10th |
2.27 / 9-10th |
|
Monthly Snowfall / Departure from Normal |
T / -1.3 |
0.0 / -1.0 |
0.0 / -1.0 |
T / -1.4 |
|
Most Snow in 24 hours / Date |
T / 20th |
0 |
0 |
T / 24th |
|
|
|
|
|
|
|
Temperature Data |
Pierre |
Kennebec |
Mobridge |
Timber Lake |
|
Warmest Temperature / Date |
86 / 4, 5th |
83 / 4, 5th |
87 / 5th |
88 / 4, 5th |
|
Coldest Temperature / Date |
25 / 31st |
25 / 15th |
22 / 31st |
19 / 21st |
|
Average High / Departure from Normal |
63.8 / +3.1 |
64.6 / +0.8 |
63.5 / +3.1 |
61.8 / +3.1 |
|
Average Low / Departure from Normal |
40.7 / +4.5 |
39.6 / +4.0 |
41.4 / +4.9 |
39.6 / +5.0 |
|
Monthly Average / Departure from Normal |
52.2 / +3.7 |
52.1 / +2.4 |
52.4 / +4.0 |
50.7 / +4.0 |
|
Precipitation Data |
|
|
|
|
|
Monthly Precipitation / Departure from Normal |
2.09 / +0.40 |
3.07 / +1.44 |
3.43 / +1.62 |
3.45 / +1.66 |
|
Most Precipitation in 24 hours / Date |
0.70 / 9th |
1.23 / 20th |
1.52 / 12-13th |
1.89 / 13th |
|
Monthly Snowfall / Departure from Normal |
0.0 / -1.3 |
0 / -1.6 |
T / -1.7 |
0.2 / -2.1 |
|
Most Snow in 24 hours / Date |
0 |
0 |
T / 20th |
0.2 / 20th |
October 2021 temperature departure from normal, from the Midwestern Regional Climate Center

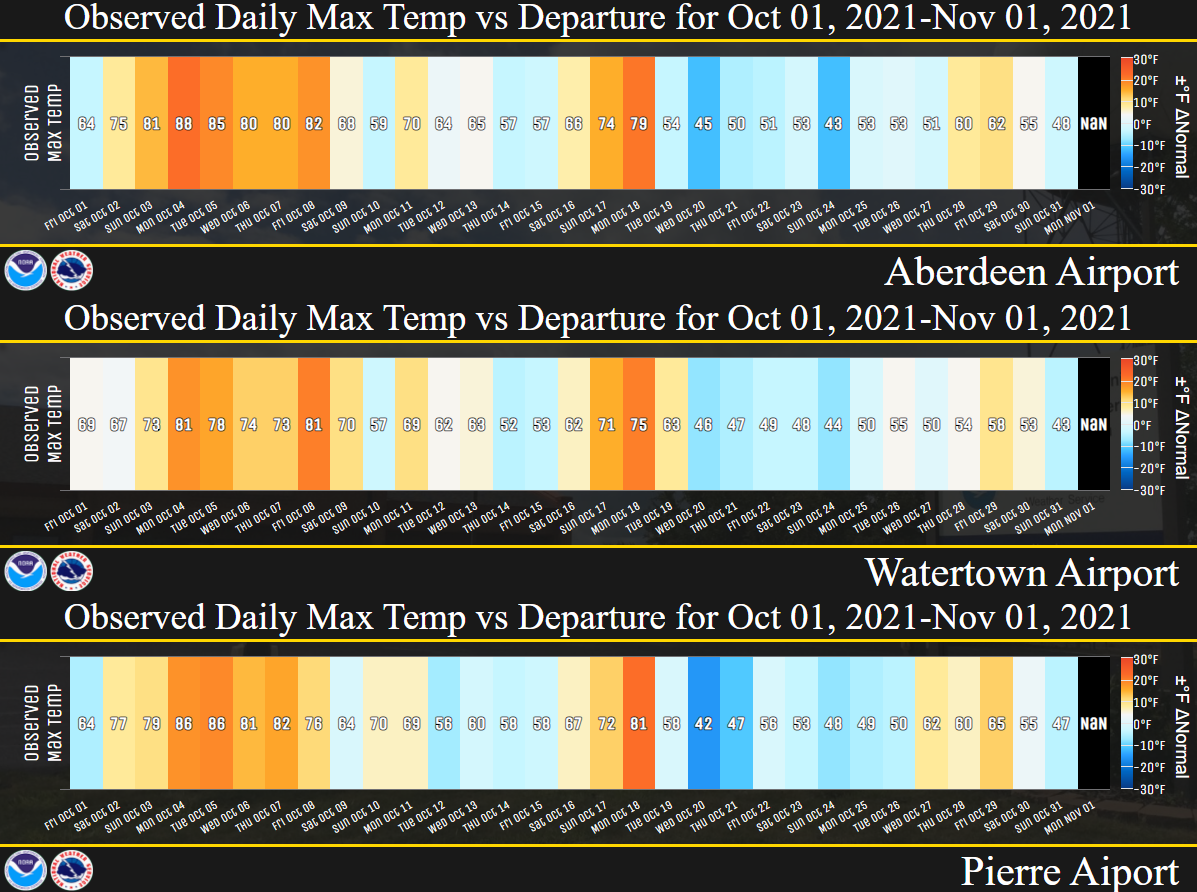
Daily high temperatures (values) and departures from normal (rectangle shading) at Aberdeen, Watertown and Pierre
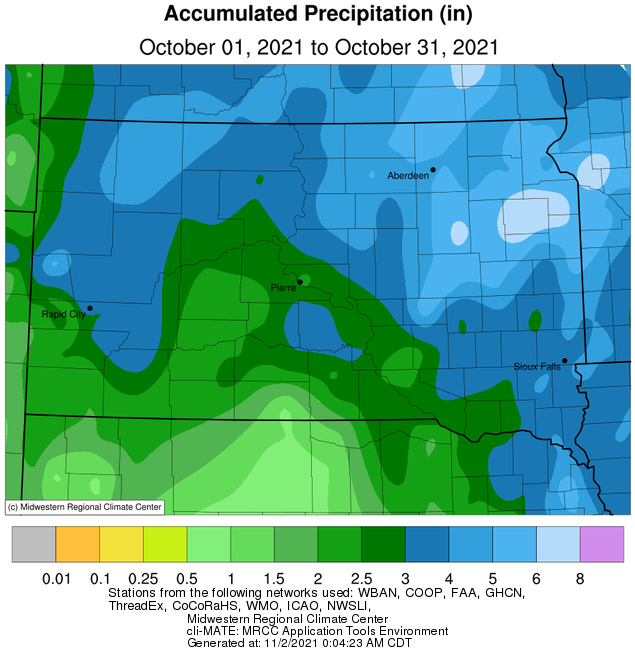
October 2021 precipitation totals, from the Midwestern Regional Climate Center
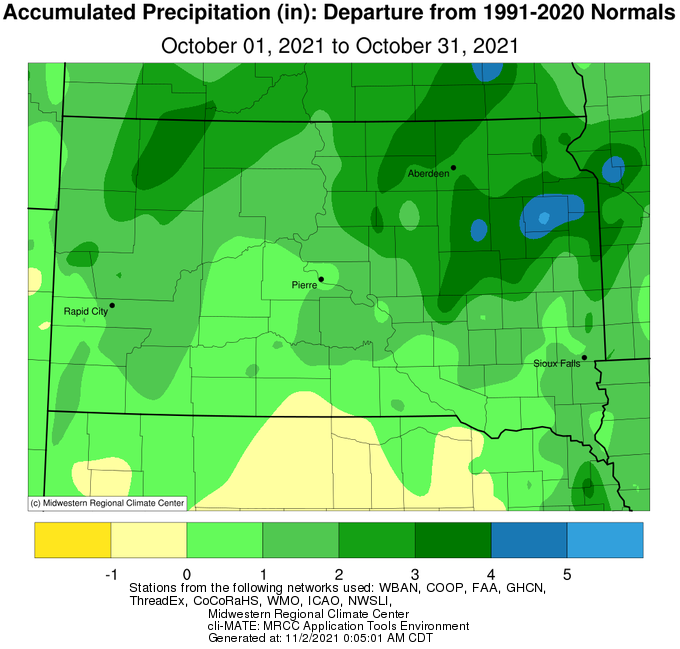
October 2021 precipitation departure from normal, from the Midwestern Regional Climate Center
US Drought Monitor comparison between October 26th, left, and September 28th, right.
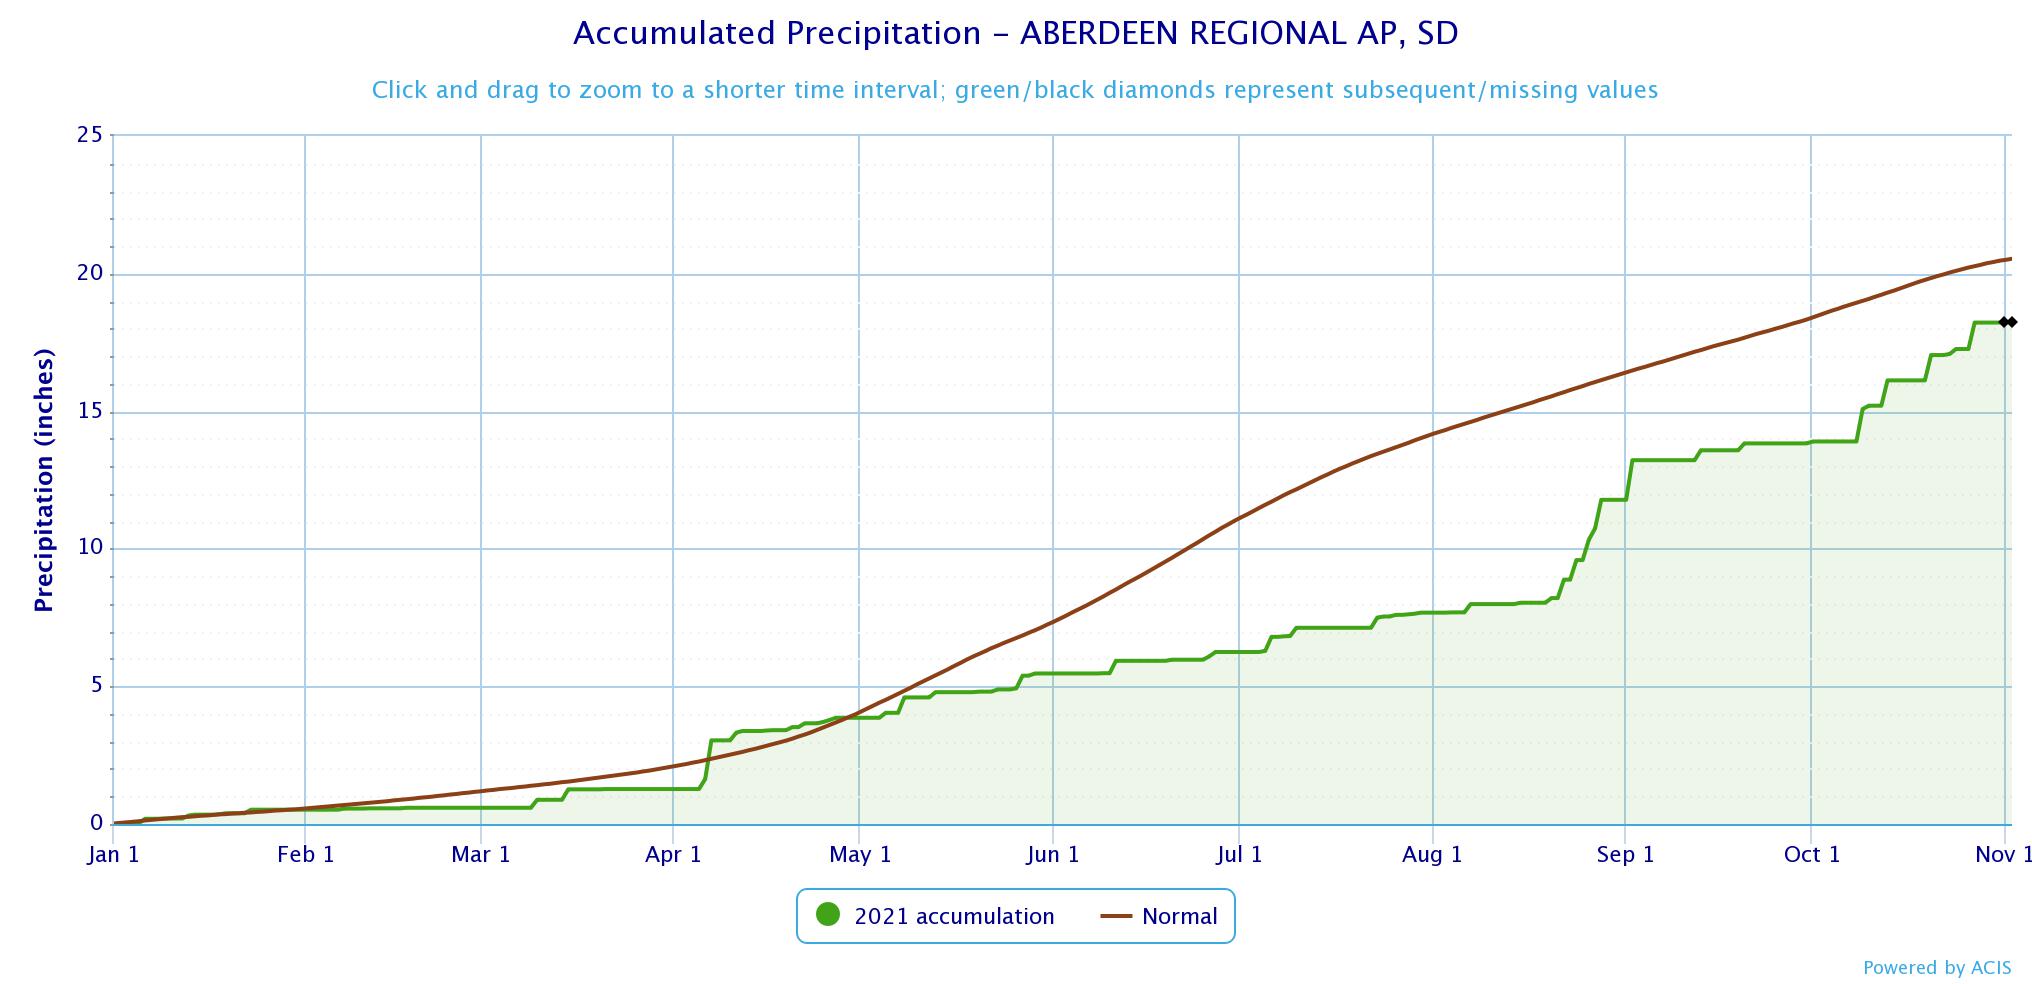
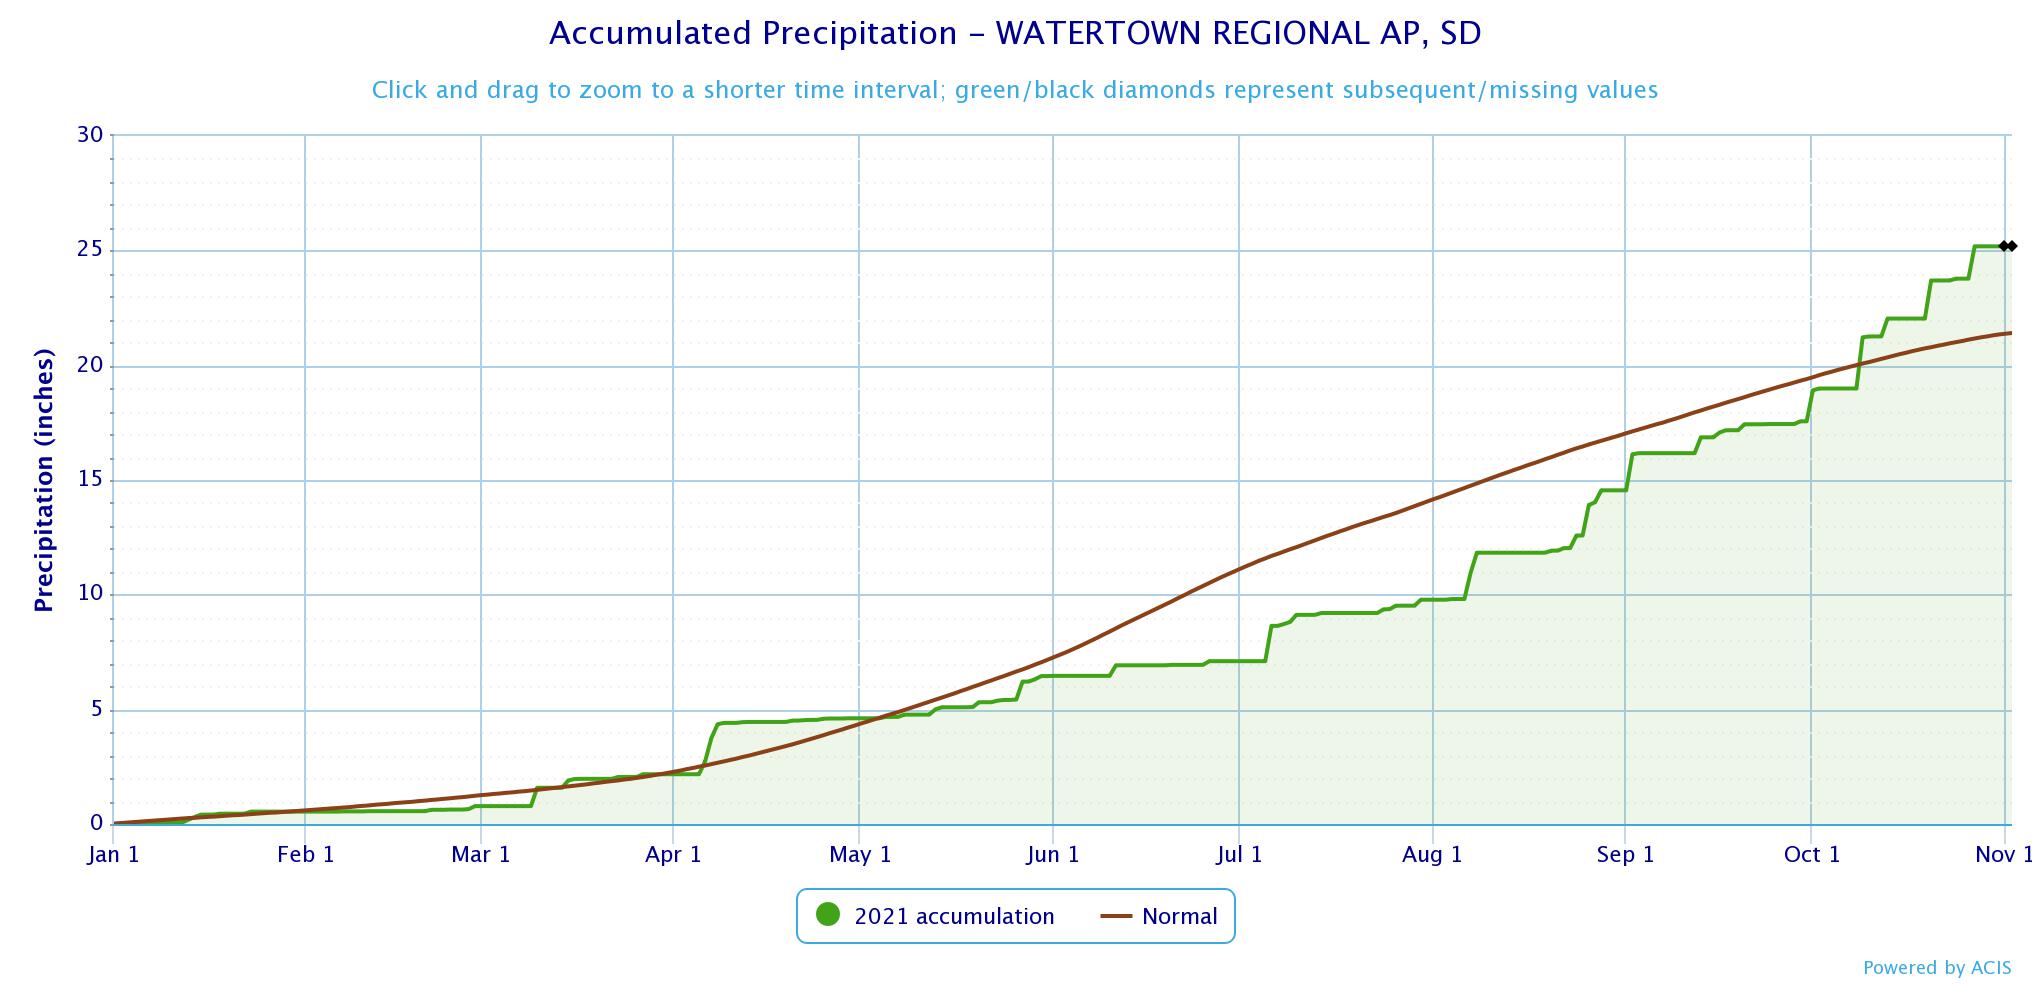
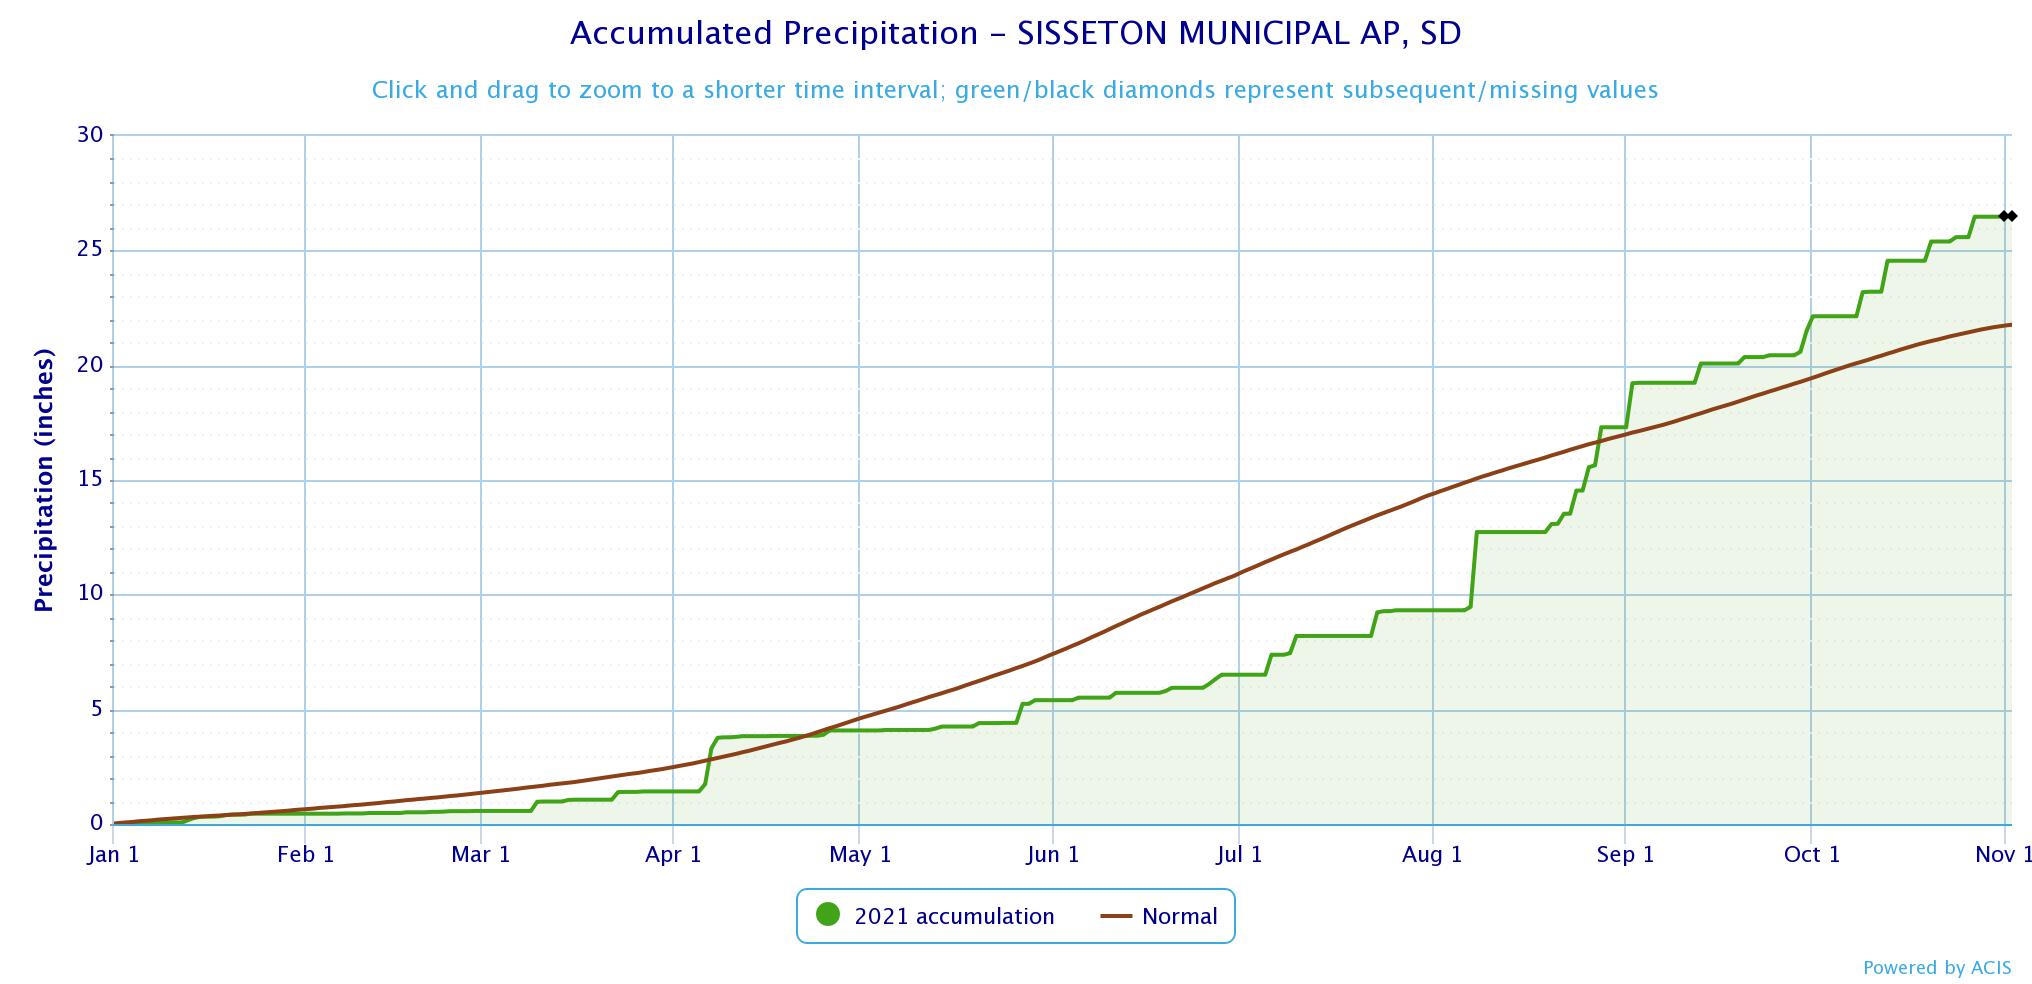
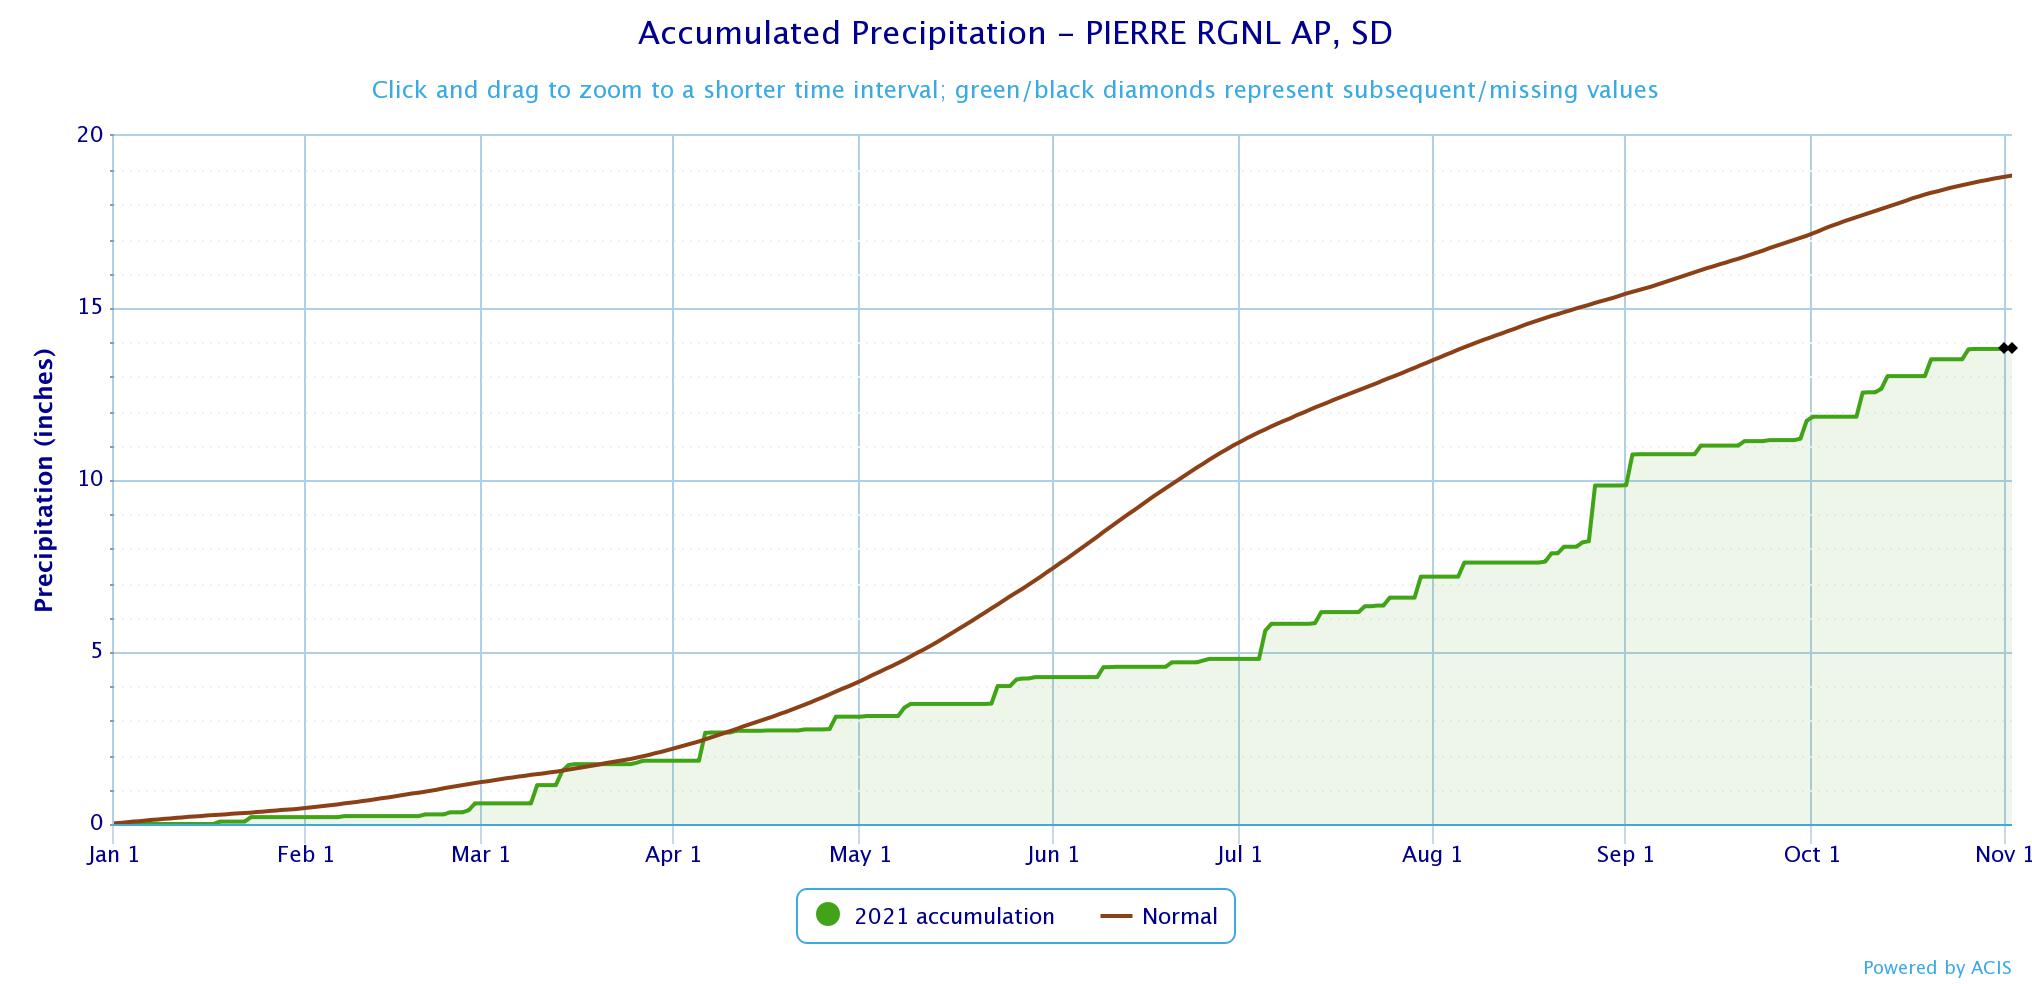
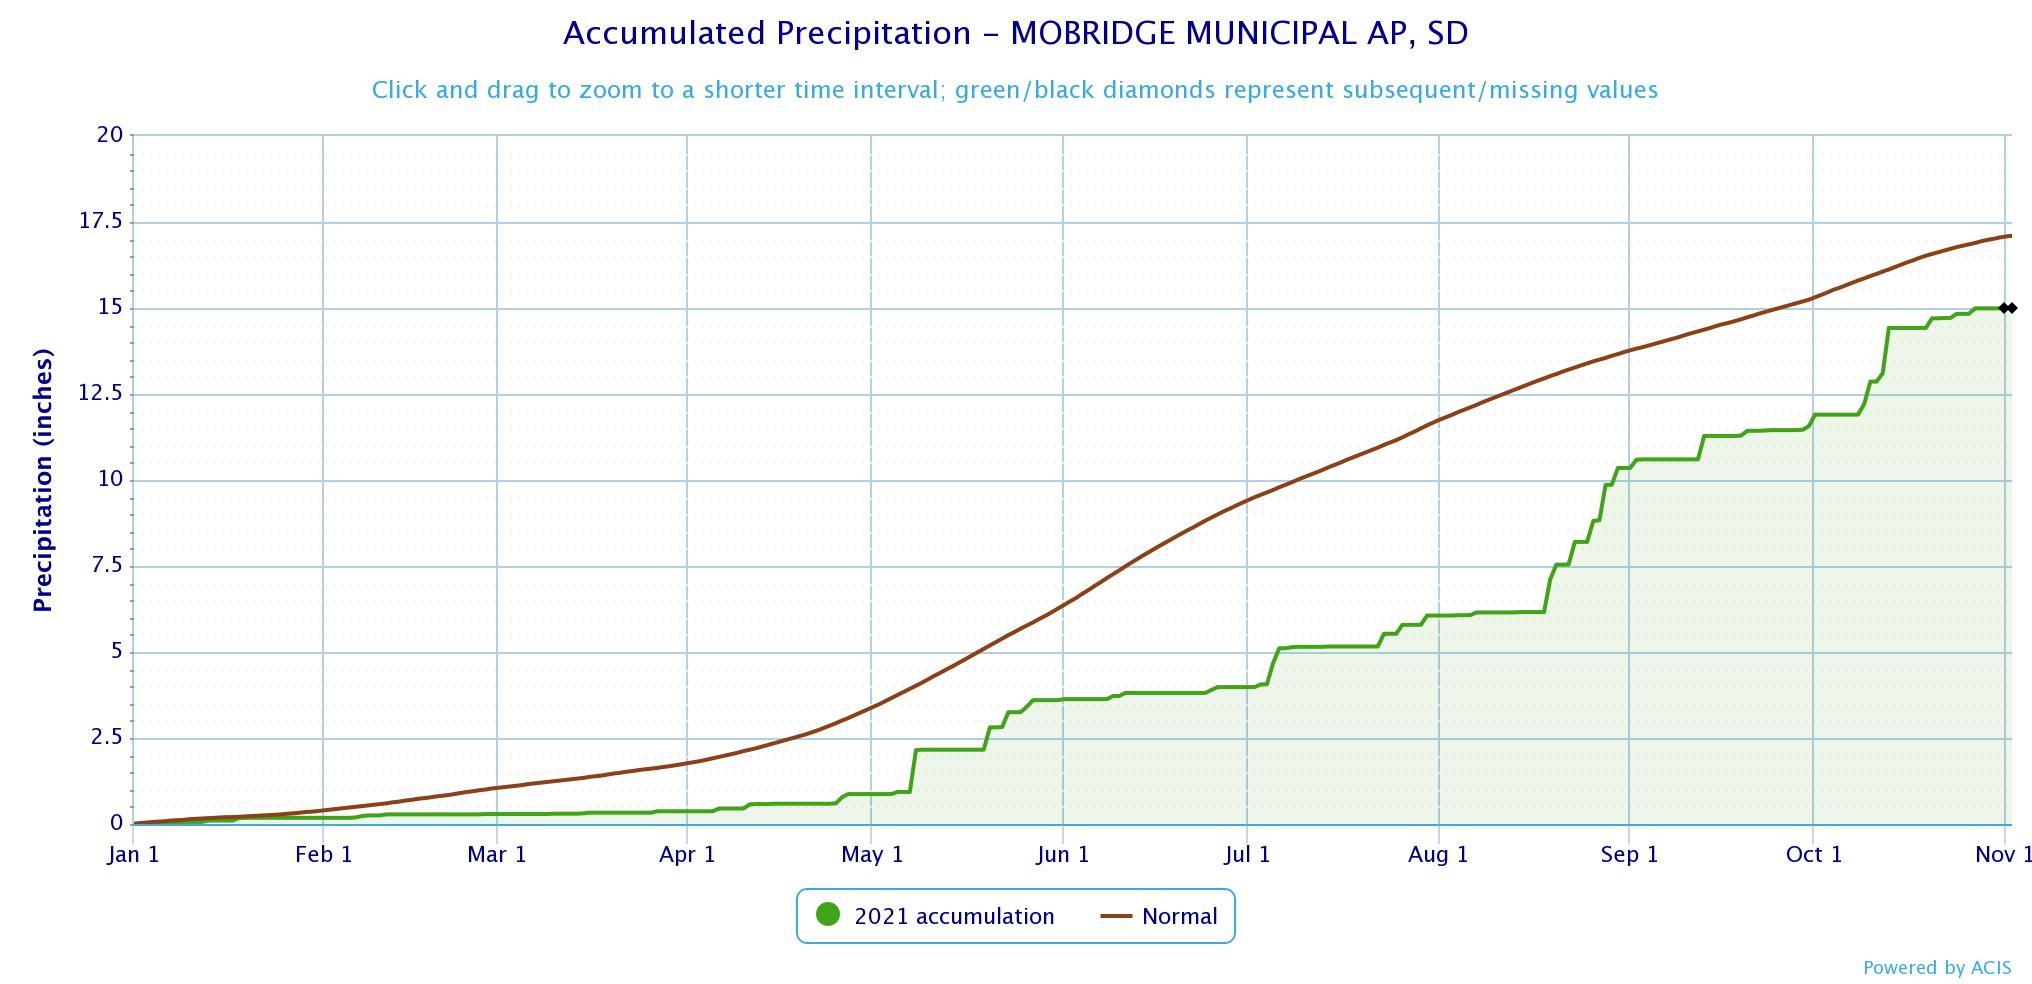
Precipitation accumulation graph from January 1st through November 1st, at Aberdeen, Watertown, Sisseton, Pierre and Mobridge (from top to bottom, in that order). At Aberdeen and Mobridge, more rain has fallen from Aug 18th - Nov 1st than from Jan 1st - Aug 18th (10.18" vs 8.04" at Aberdeen and 8.67" vs 6.16" at Mobridge). Also, notice that rainfall deficits have turned to surpluses at Watertown and Sisseton.