Widespread life-threatening flash and urban flooding continues in south-central Texas, with considerable flooding impacts possible across central Texas. Wildfire smoke is impacting air quality across much of the Great Lakes region into southern New England and the Mid-Atlantic. Monsoonal thunderstorms may produce isolated to scattered flash flooding across the Southwest into the Great Basin. Read More >
Spring Frost/Freeze Decision Support Page
Definitions of headlines issued by the National Weather Service in Aberdeen, SD:
Frost Advisory: Issued when conditions are favorable for temperatures to drop between 33 and 36 degrees Fahrenheit resulting in the possibility of widespread frost near the surface. Unprotected vegetation may be damaged.
Freeze Watch: Issued when conditions are favorable for temperatures to drop below 32 degrees Fahrenheit during the next 12 to 48 hours resulting in the possibility for significant damage to unprotected vegetation.
Freeze Warning: Issued when confidence is high that temperatures will drop below 32 degrees Fahrenheit within the next 24 hours resulting in significant damage to unprotected vegetation.
|
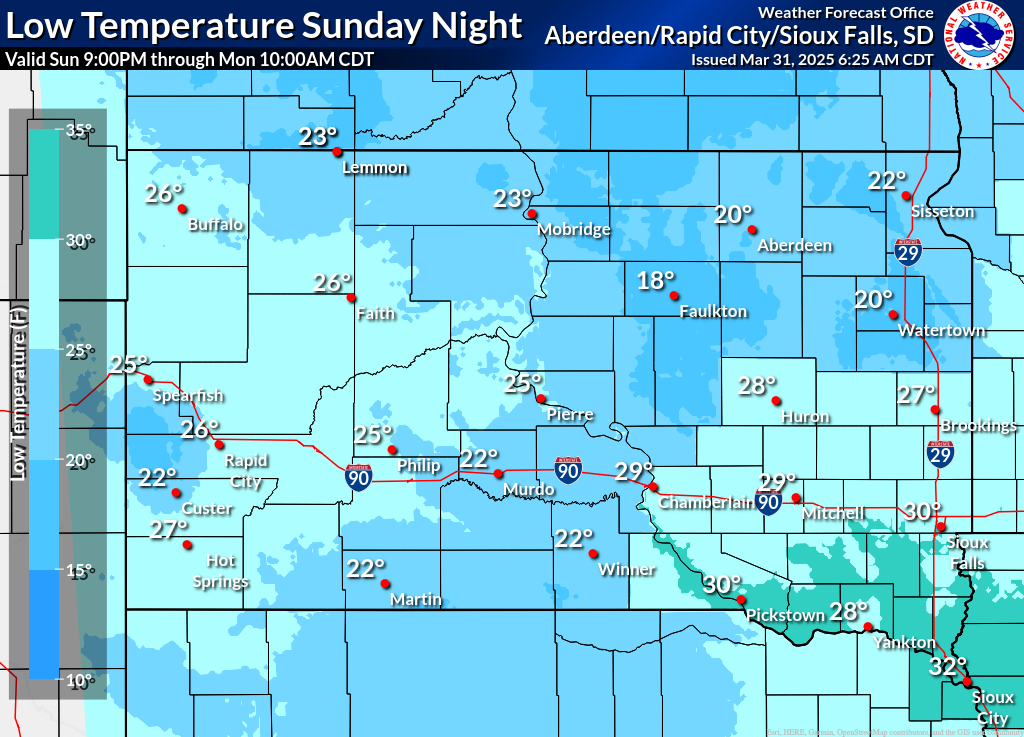
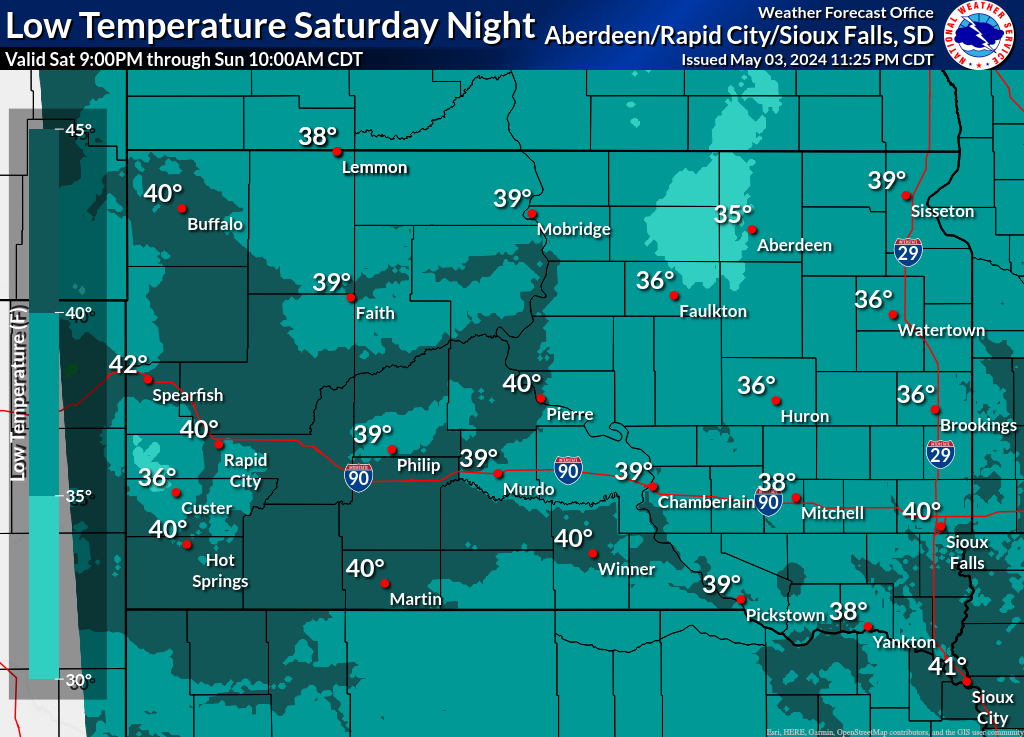
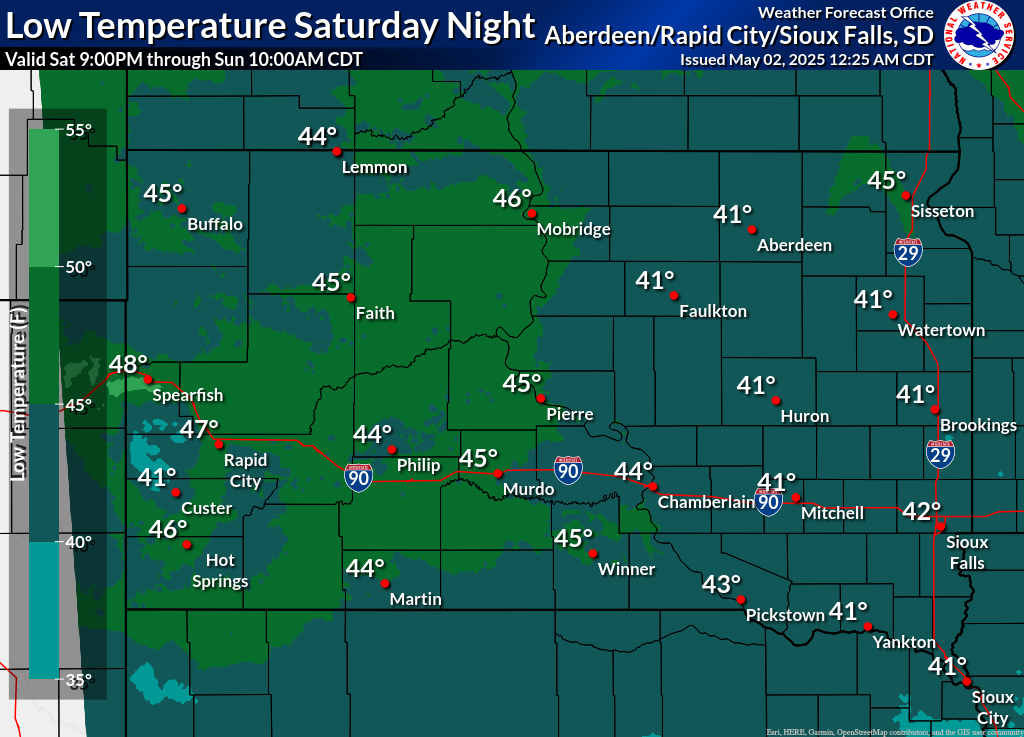
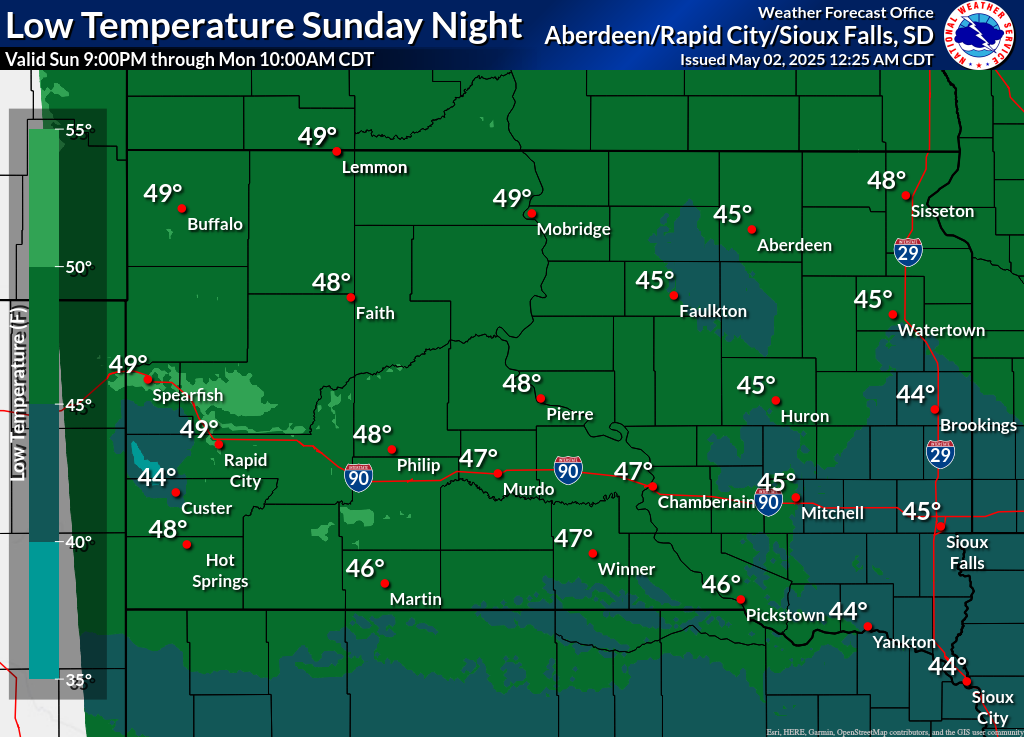
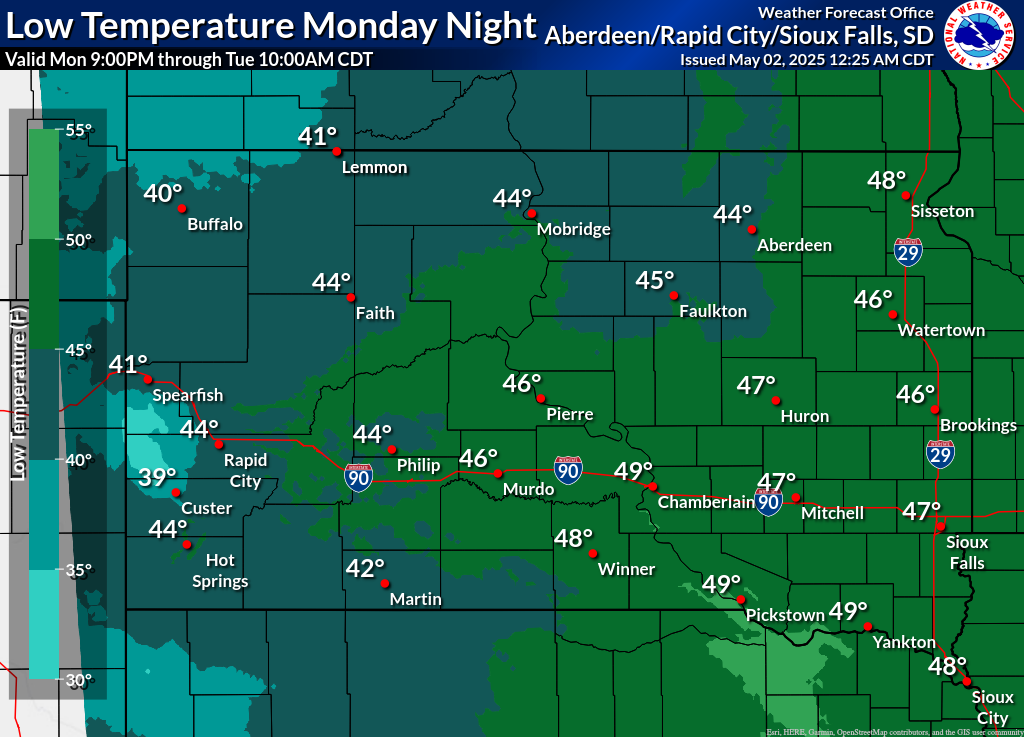
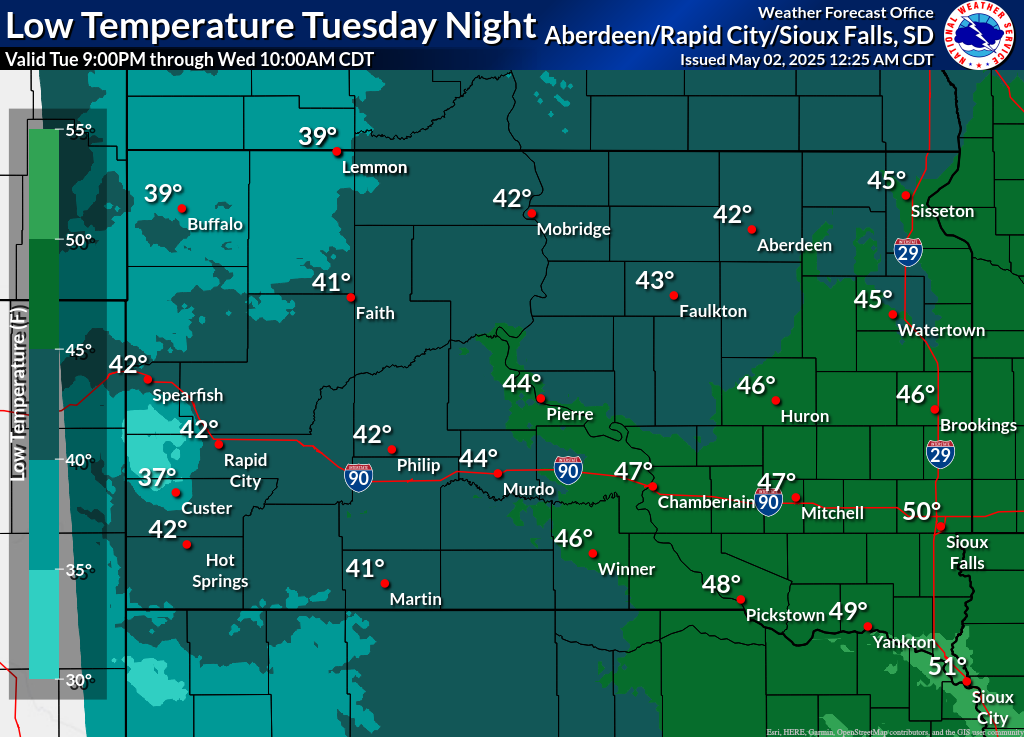
________________________________FORECASTS___________________________________ Click on the images below for the latest forecast temperature information |
|||
|
|
|
|
|
|
DAY 1 minimum temp forecast |
DAY 2 minimum temp forecast |
DAY 3 minimum temp forecast |
DAY 4 minimum temp forecast |
|
|
|
|
|
|
DAY 5 minimum temp forecast |
DAY 6 minimum temp forecast |
6-10 Day Temp Outlook |
8-14 Day Temp Outlook |
|
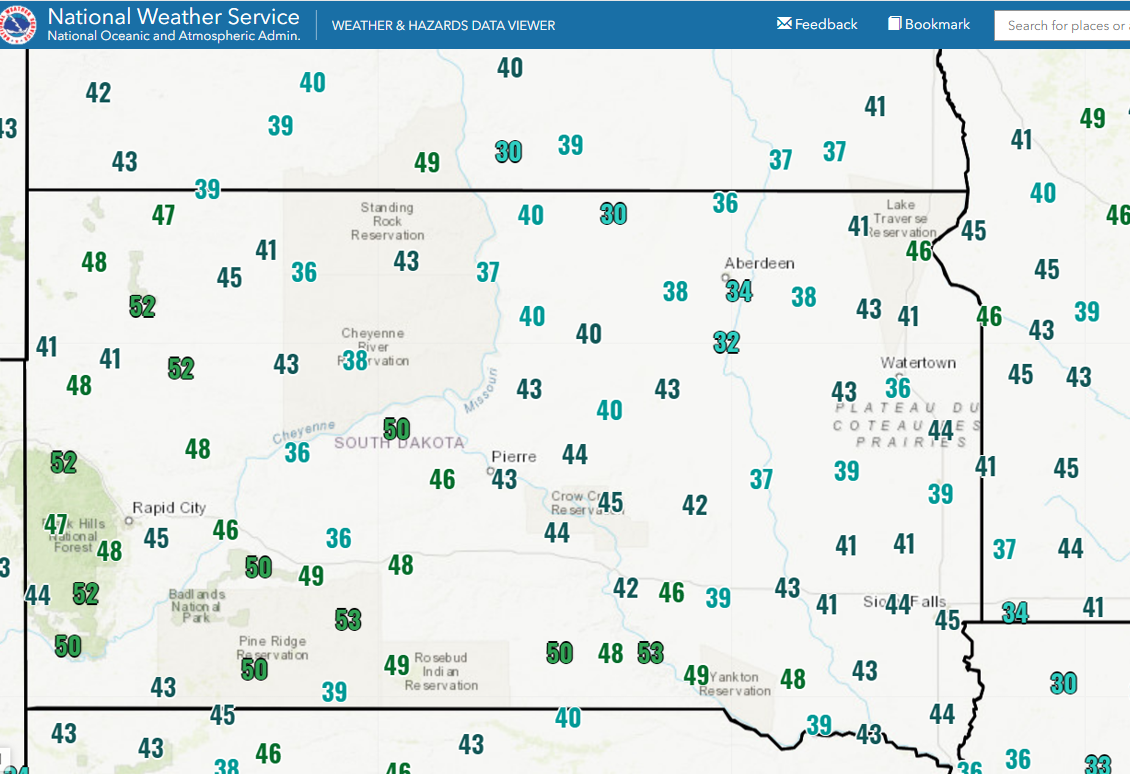
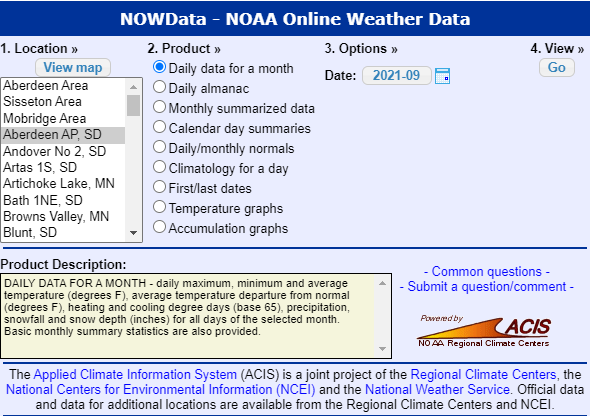
_______________________________OBSERVATIONS__________________________________ Find information regarding past and current temperature observations by clicking on the images below |
|||
|
|
|
|
|
|
Map display of current temperatures across the region |
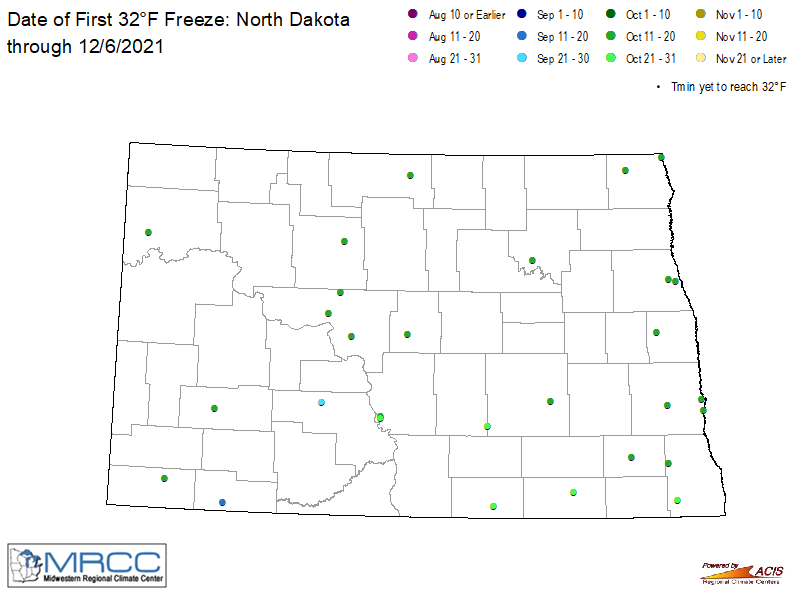
Map view of the season's last observed 32°/28° temperature |
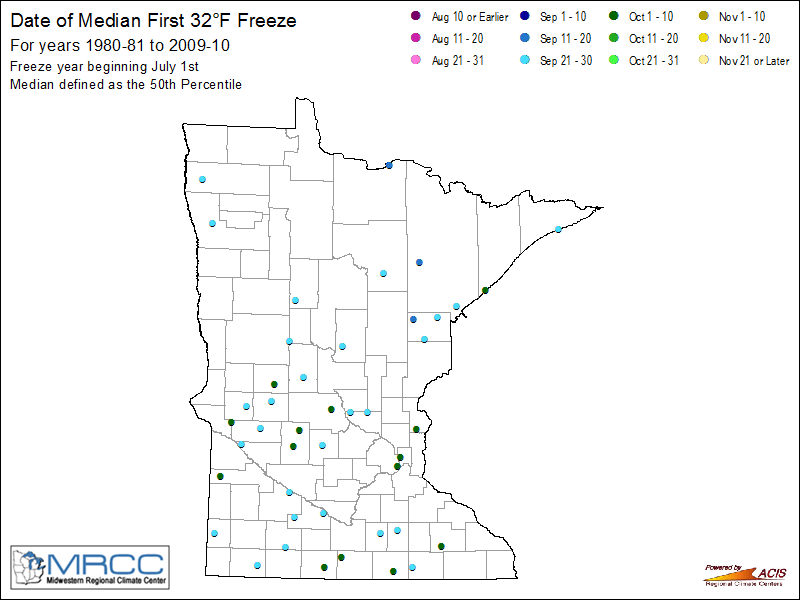
Map view of the season's last observed 32°/28° temperature across Minnesota |
Map view of the season's last observed 32°/28° temperature |
|
|
|
|
|
|
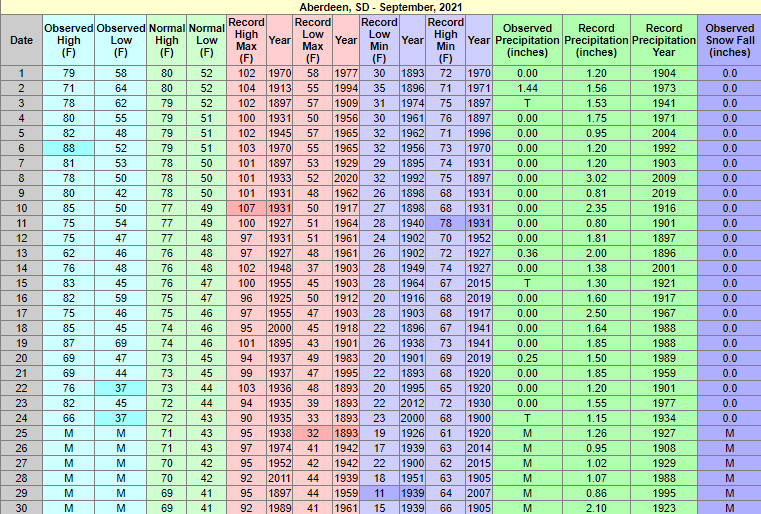
Table of daily lows at Aberdeen, Watertown, Pierre, Sisseton and Mobridge |
Table of daily lows at numerous additional COOP sites |
|
|
|
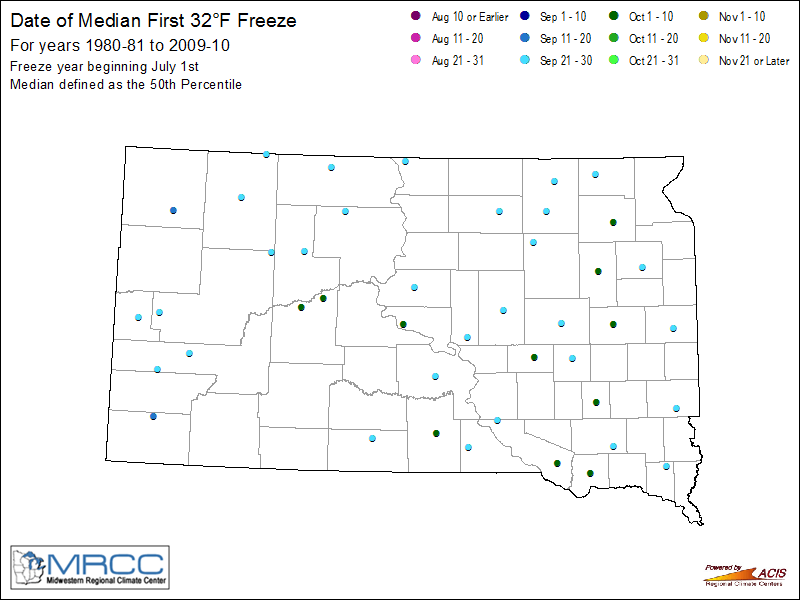
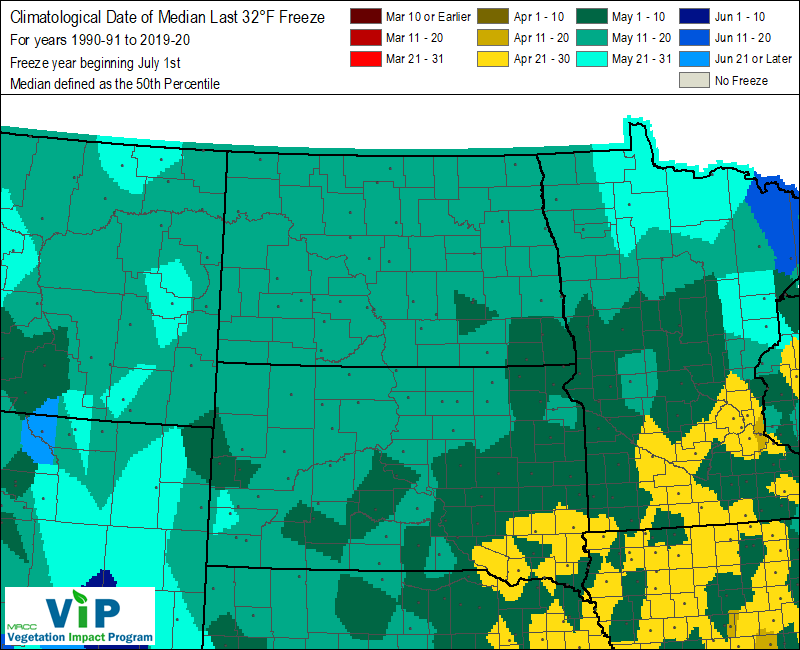
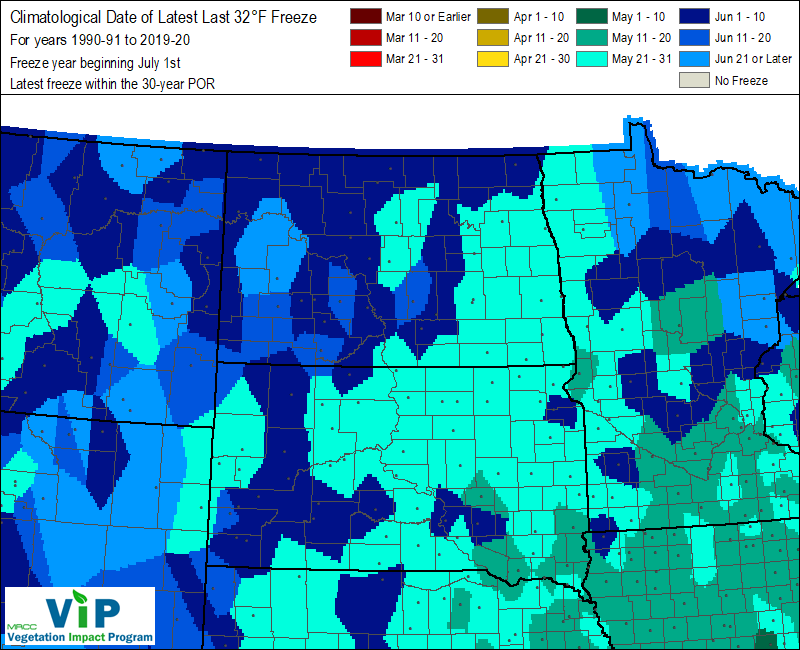
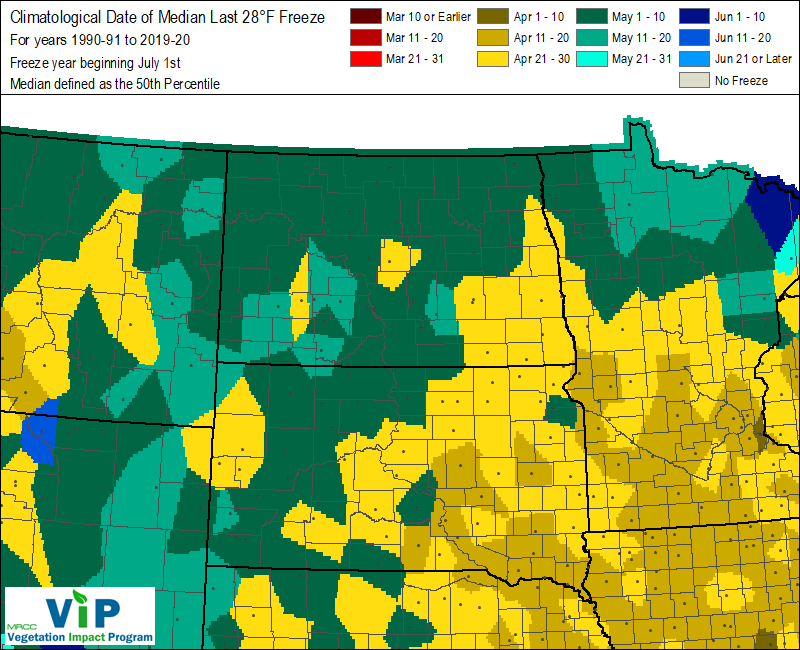
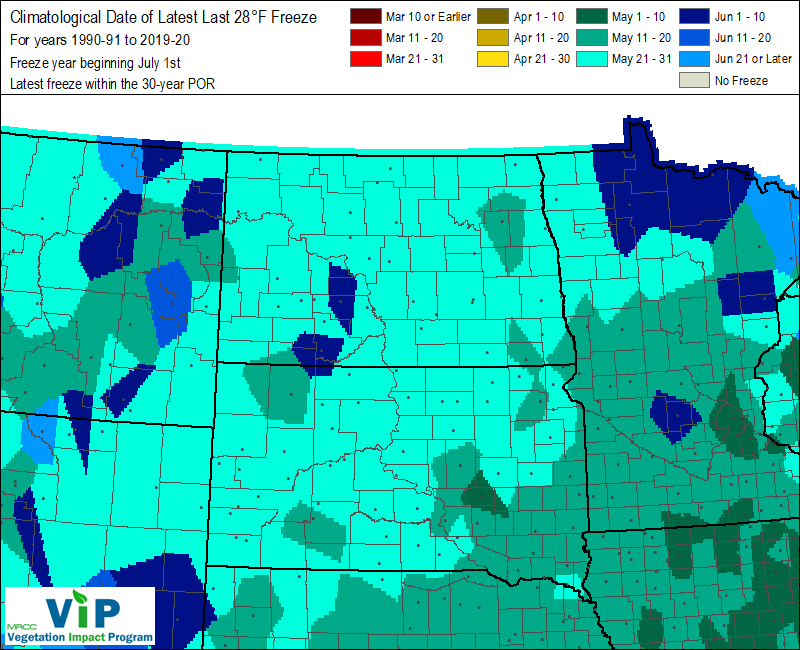
_______________________________CLIMATOLOGY__________________________________ Find climatology information pertaining to frost/freezes by clicking on the images below |
|||
|
|
|
|
|
|
Median Date of Last 32° Freeze |
Date of Latest Last 32° Freeze |
Median Date of Last 28° Freeze |
Date of Latest Last 28° Freeze |
 |
 |
||
|
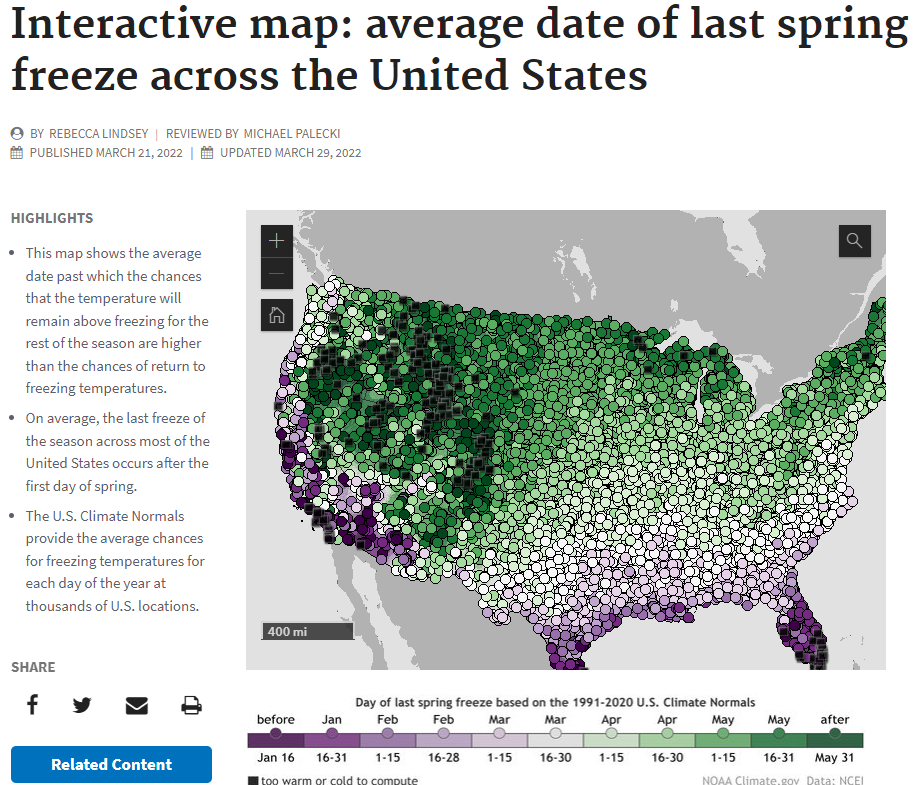
Interactive map of the average last spring freeze (32° F) |
Soil temperature climatology
|
|
|
_
The table below presents statistical data regarding the last spring frost/freeze using 1991-2020 data from several NWS COOP sites. "Area" following a location means there have been multiple stations used for the database (within 5 miles of each other). Below are a few examples on how to read the table, using Aberdeen:
While records go as far back as 1895 in some cases, the tables above use just a 30 year period, from 1991-2020. Why? 30 years is an internationally agreed upon timeframe to define "Climate Normals," as determined by the World Meteorological Organization back in 1935 because 1.) 30 numbers gives a statistically reliable estimate for an average and 2.) Climate changes over time. To compare what happens today to the entire period of record would be misleading - what's normal today is often very different than what was normal 50 or 100 years ago. Therefore a gradual adjustment is needed to provide context on what climate is like today. This is important for many practical purposes, such as regulation of power companies, crop selection and planting times, construction planning, and other disciplines and industries. You can see how much the climate has changed visually since the 1901-1930 period across the country via maps here. |
|||||||||||||||||||||||||||||||||||||||||||||||||||||||||||||||||||||||||||||||||||||||||||||||||||||||||||||||||||||||||||||||||||||||||||||||||||||||||||||||||||||||||||||||||||||||||||||||||||||||||||||||||||||||||||||||||||||||||||||||||||||||||||||||||||||||||||||||||