|
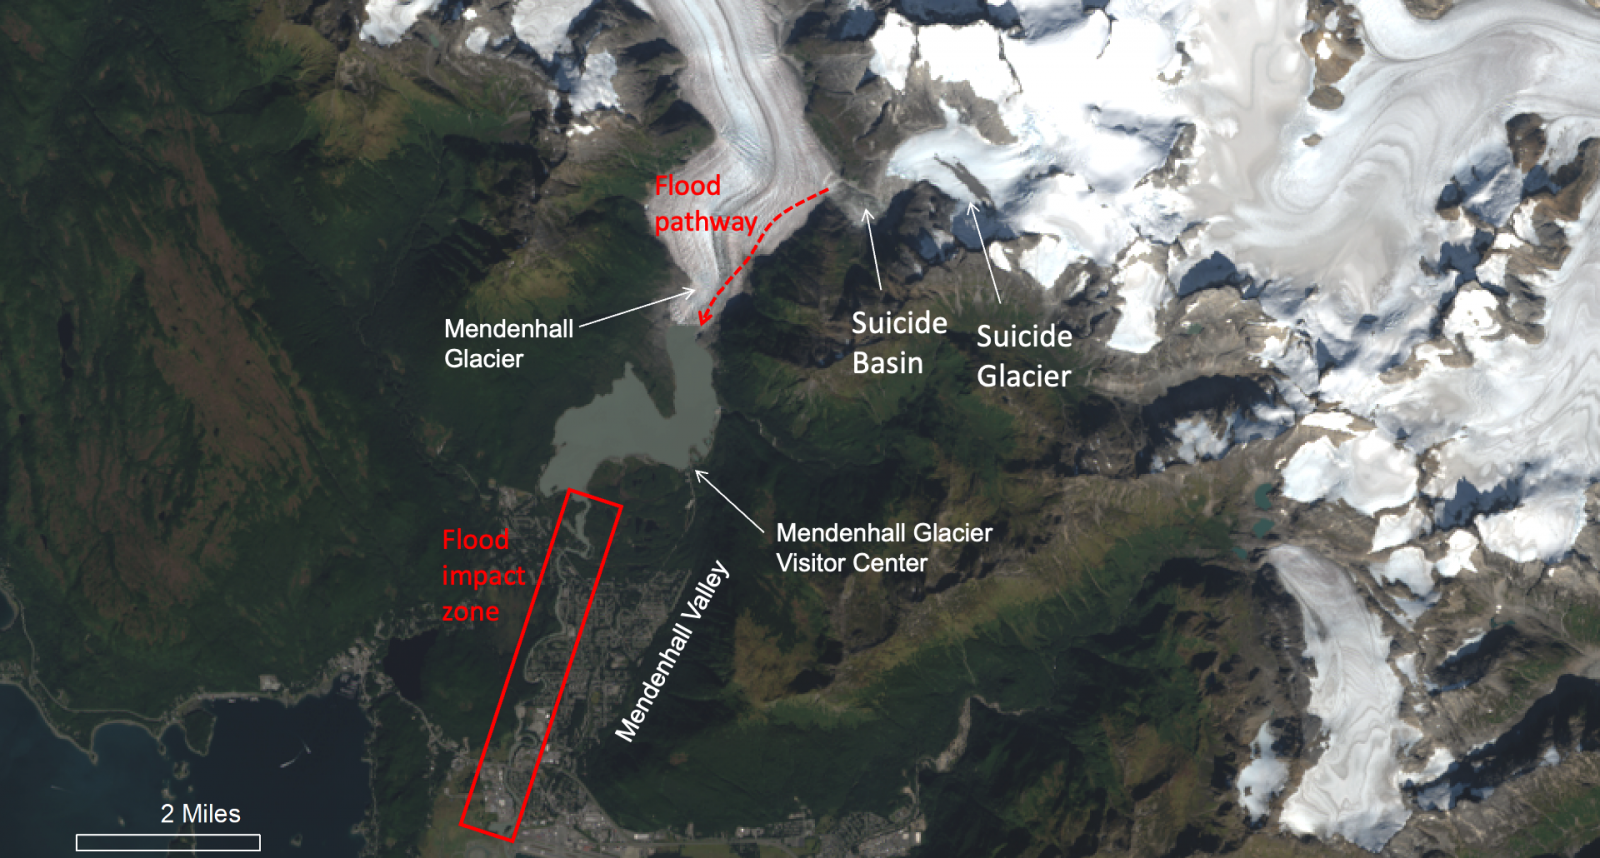
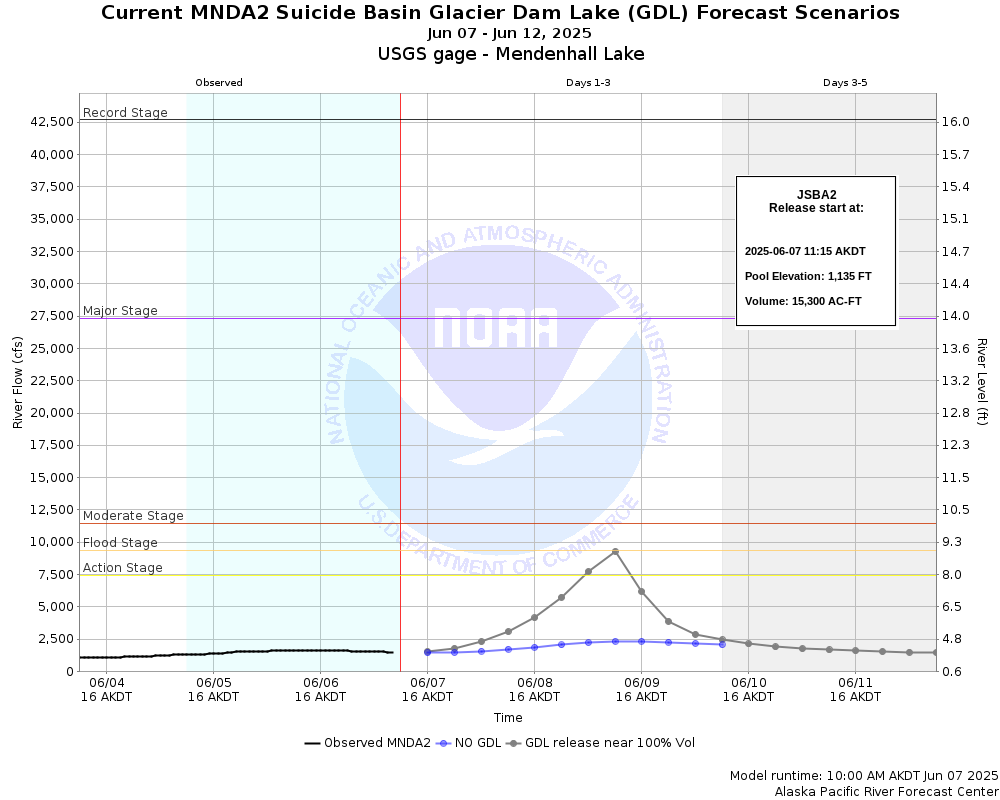
Suicide Basin is a side basin of the Mendenhall Glacier above Juneau, Alaska. Since 2011, Suicide Basin has released glacier lake outburst floods that cause inundation along Mendenhall Lake and River annually with the latest release causing a minor flooding on September 15, 2025. Monitoring Equipment Status: The USGS has shut down most of the monitoring equipment for the season. They hope to get images from the basin once a week to keep situational awareness in the basin. Basin/River Status: October 21st 2025 Suicide Basin started to refill between October 1 and 10th as seen on the latest camera images. The amount of filling(input) will slow through the fall and winter months as the temperatures and freezing levels drop. We do not anticipate another significant release this year. NWS will continue to monitor the basin into the winter months and release any new information as we get it so check back for updates. Suicide basin released for a second time on September 15th and the Mendenhall Lake crested at 9.6 ft, just above minor flood stage of 9ft. Here is the NWS event report from the record 16.65ft major flooding event that occurred on August 13th 2025.
|
Visit the Juneau Glacial Flood Dashboard to learn more about Suicide Basin and flood impacts including: inundation maps, forecast data basics, history, and other FAQ! Educational videos about outburst floods, how to find data, terminology and other information are on NWS Juneau's YouTube channel, here. |
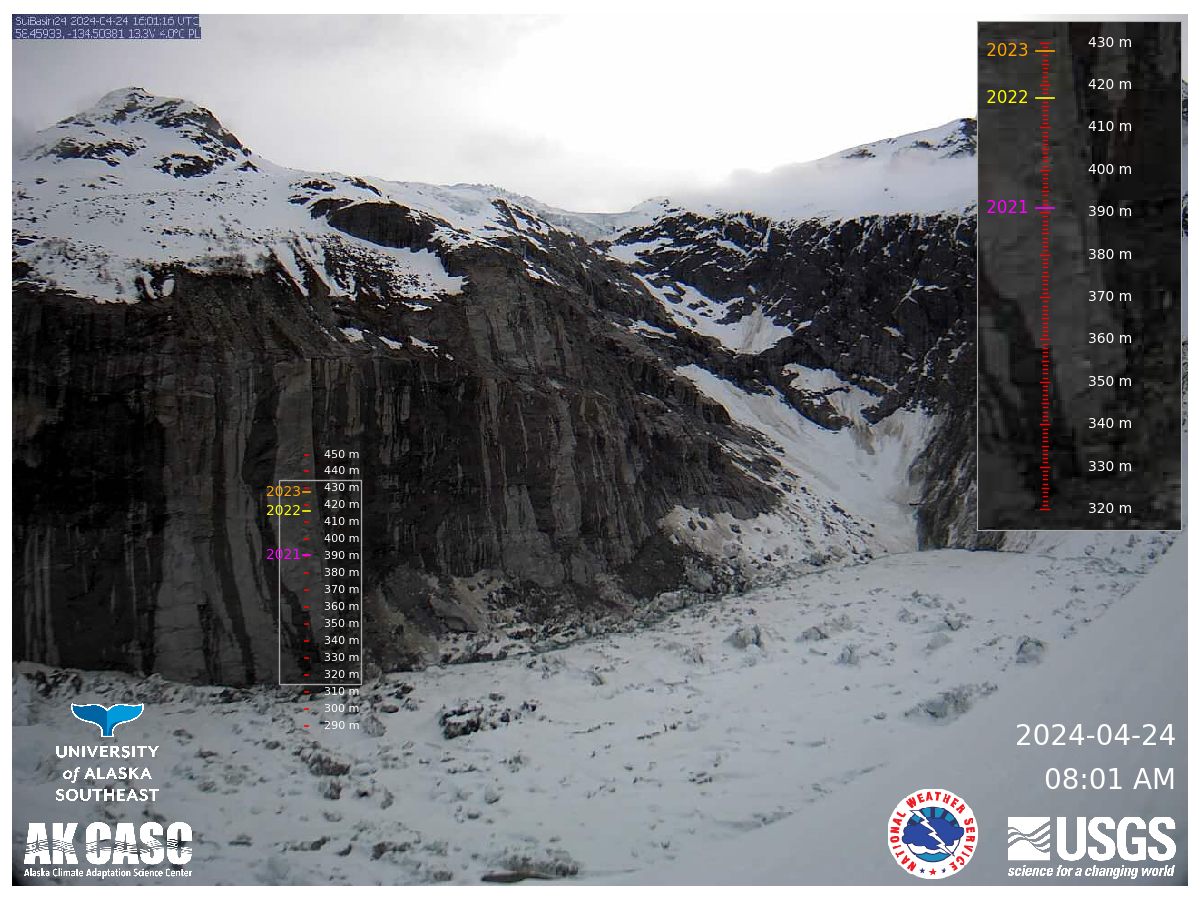
Latest Basin Image - ScalesMost recent image from the basin, updated at daily to sub-daily intervals (see time-stamp bottom right). The camera is placed at the basin entrance and faces northeast, into the basin. Click on image to enlarge and read basin levels. Click on the links below the image to see a full-season viewer or recent timelapse.
|
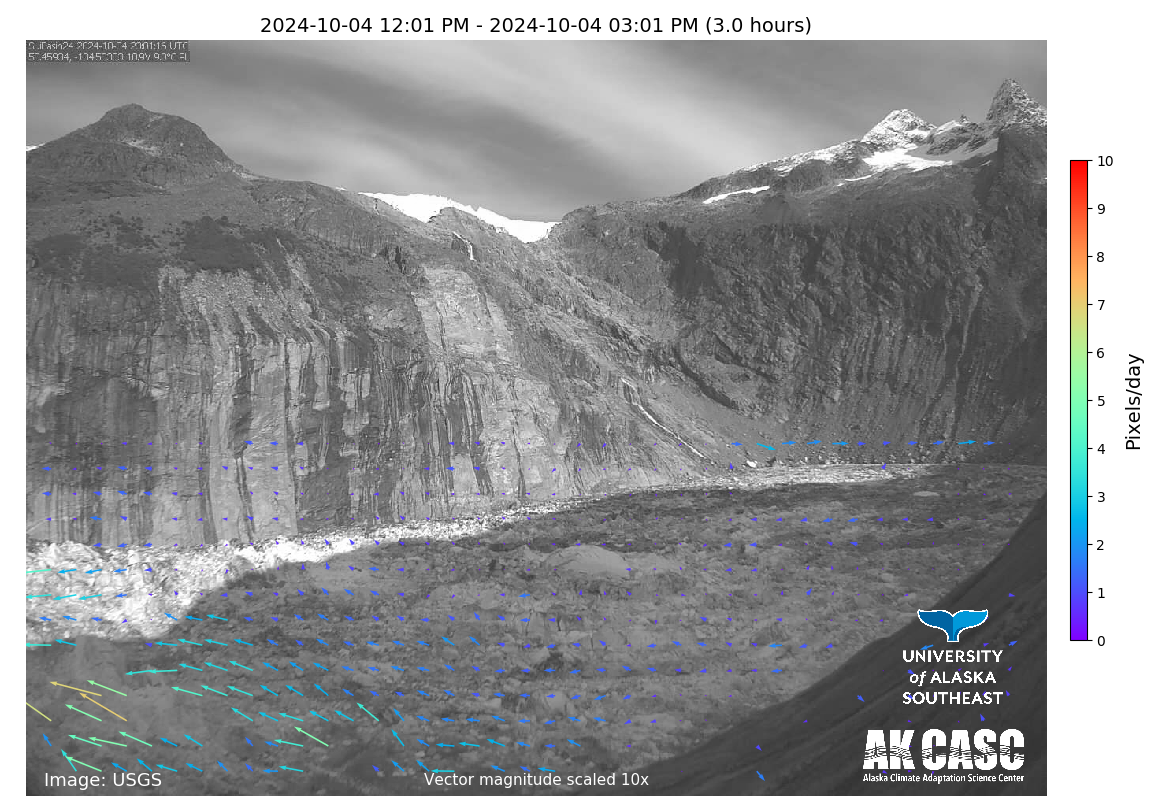
Latest Basin Image - VectorsMost recent image from the basin (same as on the left) with vectors indicating ice motion direction and magnitude. Click on image to enlarge. Click on the links below the image to see a full-season viewer or recent timelapse.
|
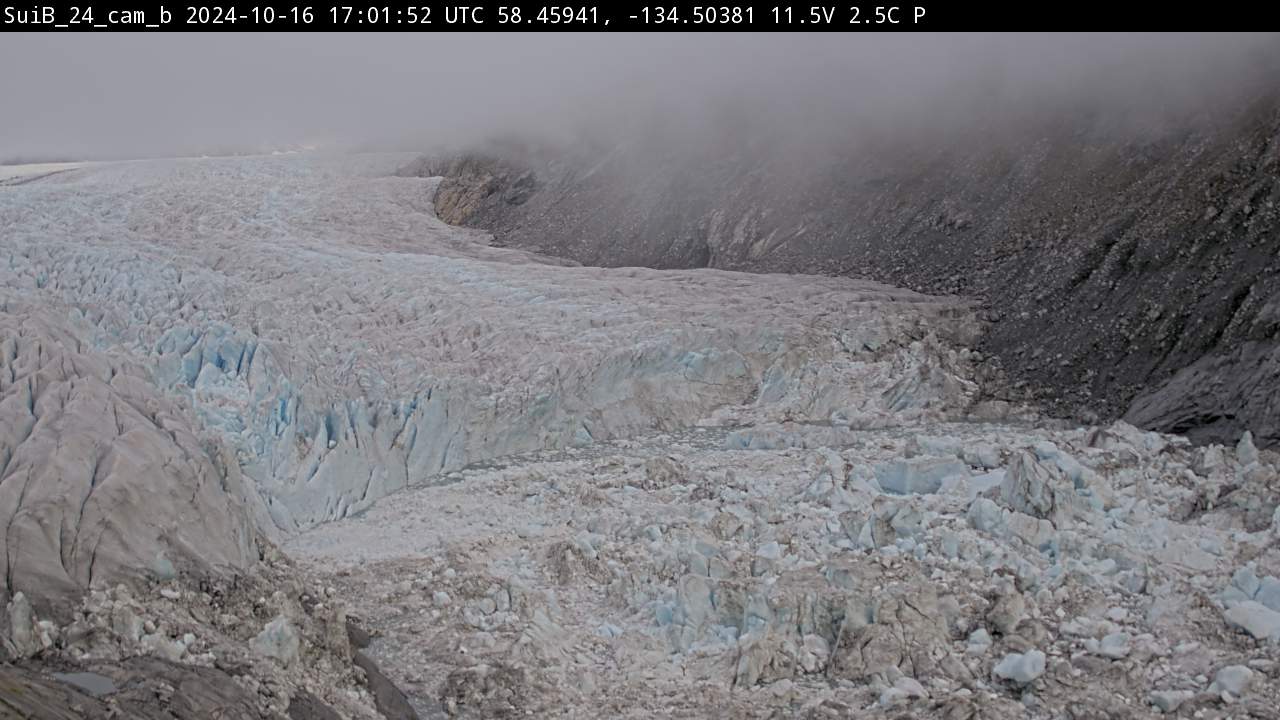
Latest Basin Image - Front of BasinMost recent image from the camera taking images with a view of the front of the basin. This image will be updated at daily to sub-daily intervals. Click on the image to enlarge. Click on the links below the image to see a full-season viewer or recent timelapse.
|
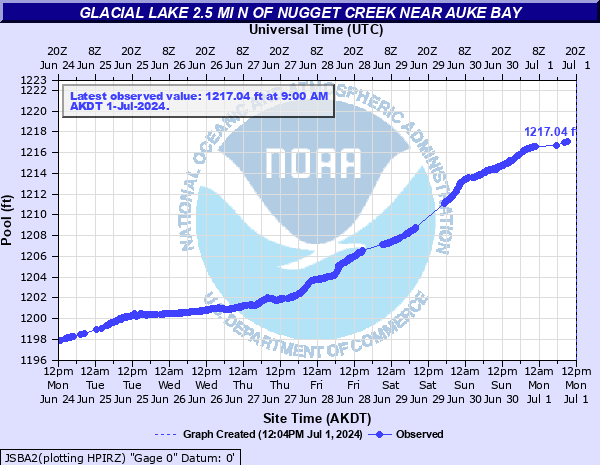
Suicide Basin Level (Pool Height)Graph showing the current (blue) pool height of Suicide Basin. Click on the image for more details (NWPS). At this time, values are from the USGS laser detection system.
|
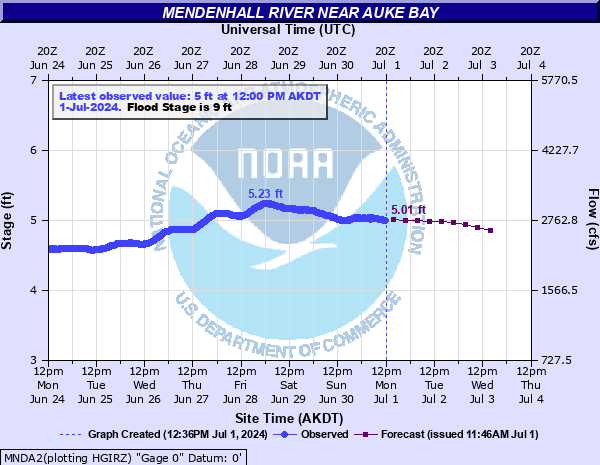
Mendenhall Lake Stage LevelGraph showing the current (blue) and predicted (purple) stage level at Mendenhall Lake. Stage levels are annotated on the left y-axis on the graph. The graph also shows the Mendenhall River discharge (right y-axis), which is derived from the Mendenhall Lake stage level via rating curve. Click on the image for more details (NWPS).
|
Mendenhall River Stage Level @ Backloop BridgeGraph showing the current (blue) stage level of the Mendenhall River at the Backloop Bridge. Stage levels are annotated on the left y-axis on the graph. Click on the image for more details (NWPS). NOTE: Refer to the Mendenhall Lake gauge for forecast data and impact statements.
|
Mendenhall River Stage Level @ Pedestrian BridgeGraph showing the current (blue) stage level of the Mendenhall River at the Pedestrian Bridge. Stage levels are annotated on the left y-axis on the graph. Click on the image for more details (NWPS). NOTE: Refer to the Mendenhall Lake gauge for forecast data and impact statements.
|
Mendenhall River Stage Level @ Brotherhood BridgeGraph showing the current (blue) stage level of the Mendenhall River at the Brotherhood Bridge. Stage levels are annotated on the left y-axis on the graph. Click on the image for more details (NWPS). NOTE: Refer to the Mendenhall Lake gauge for forecast data and impact statements.
|
 |
||
|
|
|
|


