Authors and Contributors:
NWS Cleveland Summer Student Volunteers: Steven Weinstein (2019) and Michael Garberoglio (2018)
NWS Cleveland Hollings Student: Dallas McKinney
NWS Cleveland Meteorologists: Raelene Campbell and Zach Sefcovic
References: Thunder in The Heartland (Schmidlin J., Schmidlin T.), NOAA NWS Storm Prediction Center
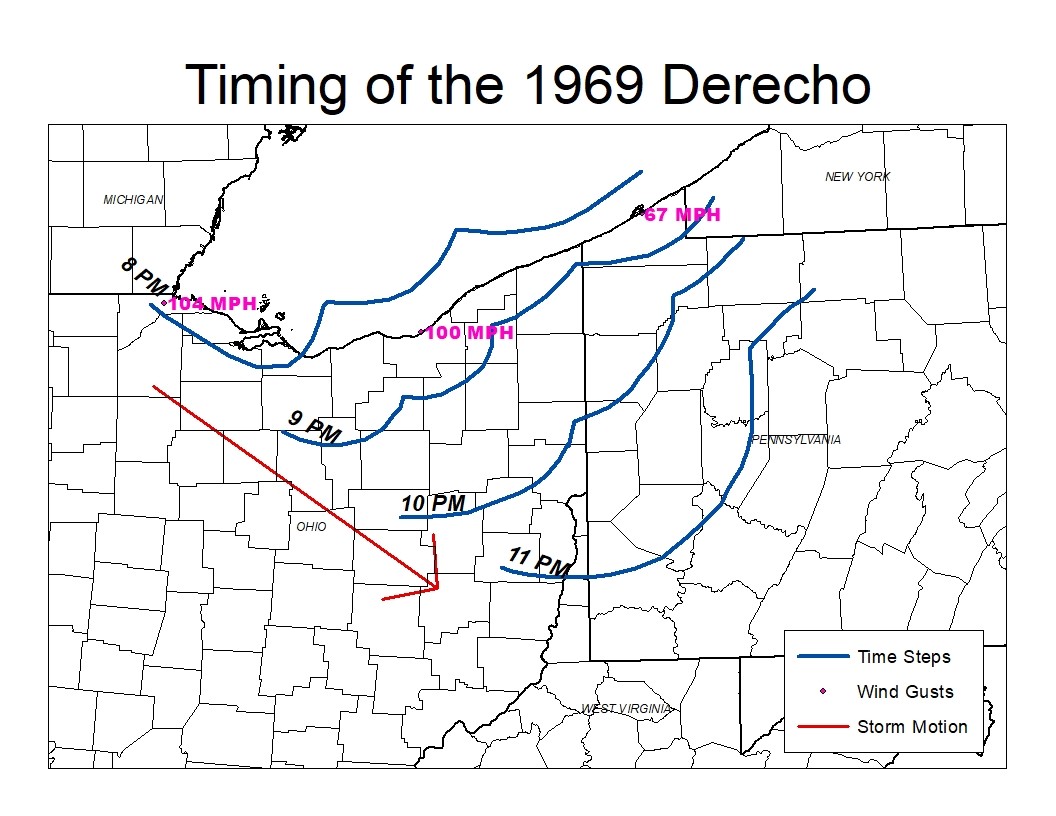
Areas affected by the July 4, 1969 derecho with the approximate hourly positions of the leading edge of the winds, and approximate wind gusts from the system. The red arrow represents the direction of the propagation of this storm system.
July 4th, 1969 started as a regular day of holiday fun. Families from all over the area gathered along the Lake Erie coastline for food and fireworks. However, unknown to the general public, a series of storms had developed over southeast Michigan. Several of these storms produced damaging winds, large hail, and several small tornadoes. Over the next few hours into the early evening, these storms evolved into a strong derecho as they moved southeast towards Lake Erie. These storms moved onshore very quickly before encountering a stationary boundary. The convection then slowed and stalled out for over 8 hours, causing catastrophic flooding. The derecho was responsible for millions in damages and several dozen fatalities.
Although forecasts early in the day pointed at the possibility for severe weather, when no storms turned up by late afternoon, the masses began to gather for what they thought would be a grand fireworks display. People along the lakeshore were completely unaware of the dangers brewing just some 50 to 75 miles to their northwest. Storms had fired over Lake Michigan and Lake Erie around 6 pm local time, but the masses carried on with the festivities, and were instructed to “think dry.” Shortly after, the storms over the lake merged into a strong line, then into a bow echo before moving to the southeast.
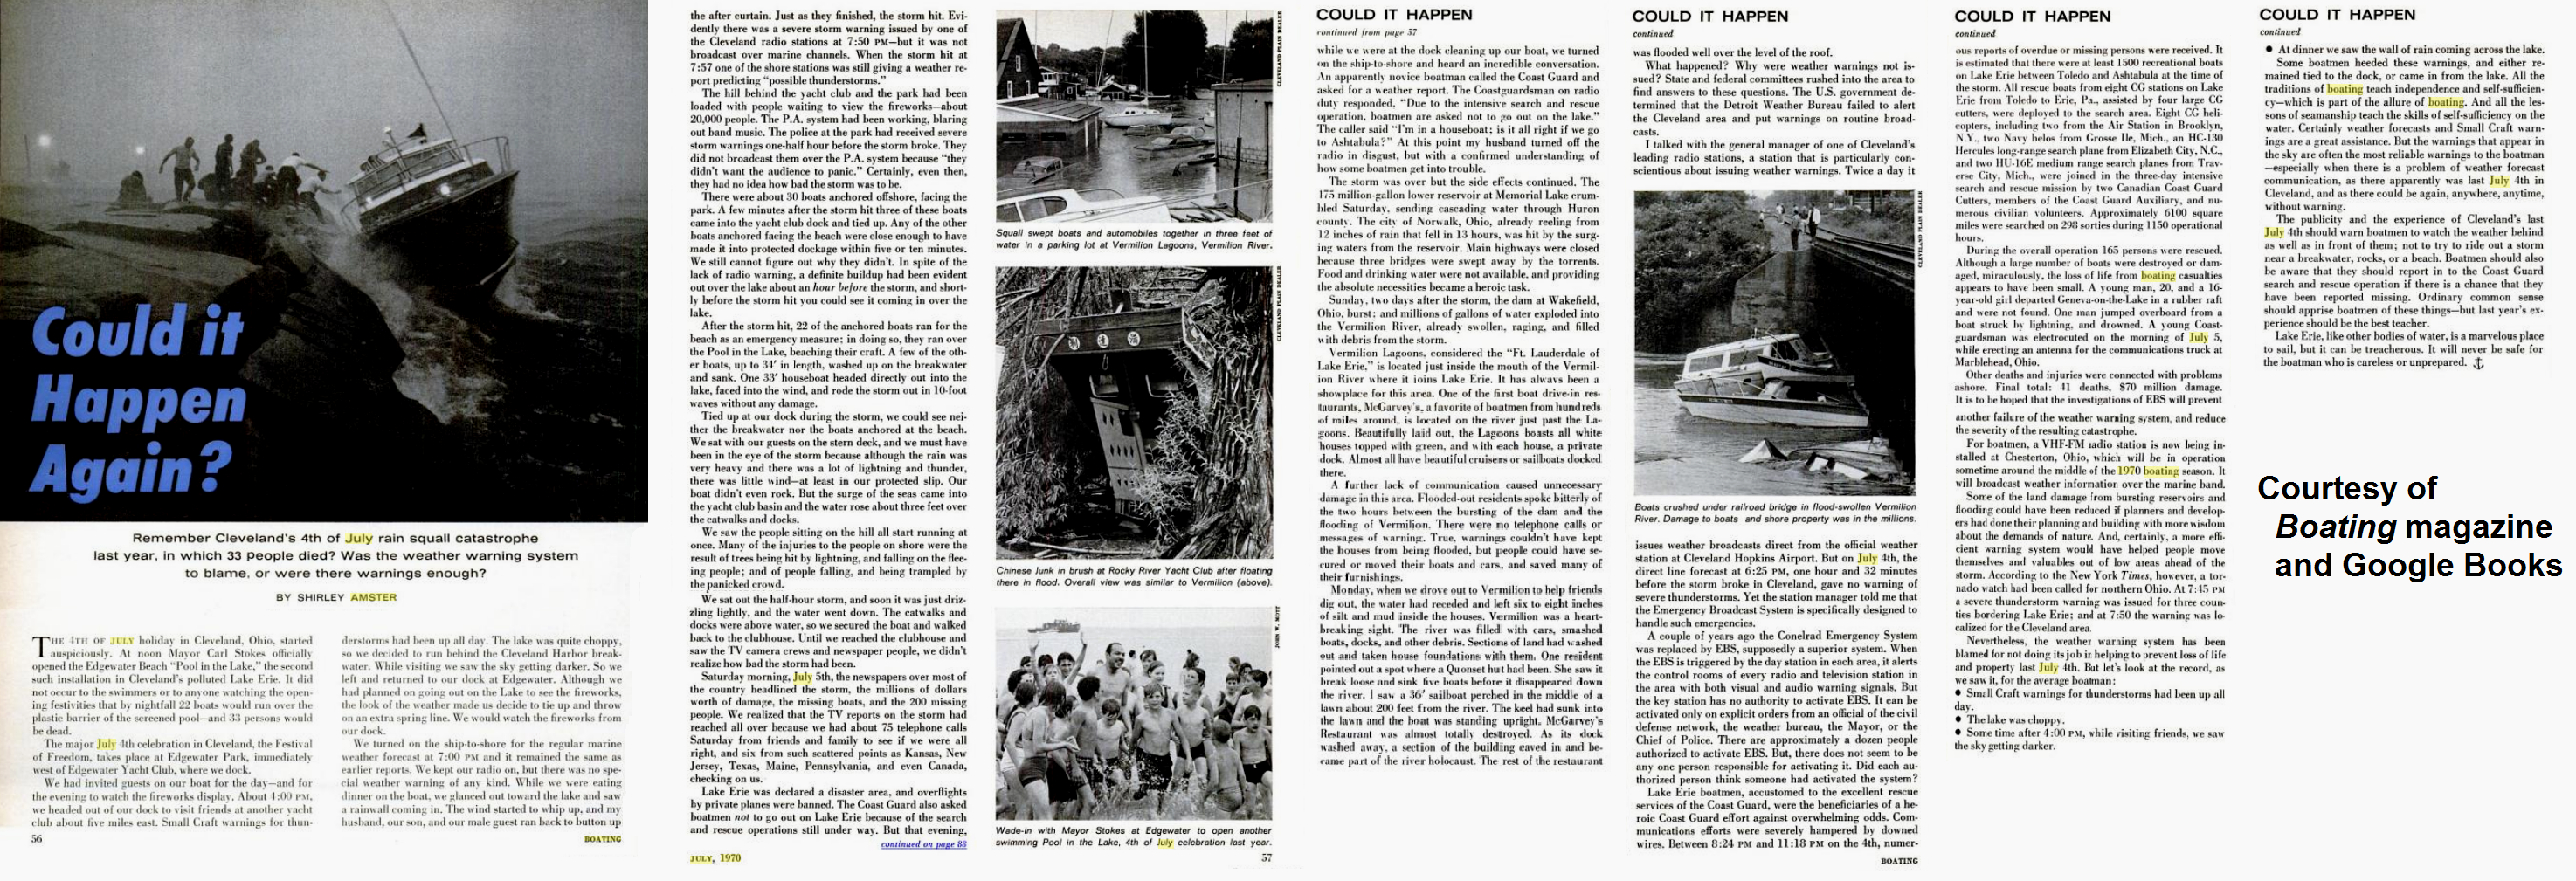
Around 7:30 pm (local time here on), local forecasters from the National Weather Service (NWS) received their first alert that storms were approaching the area from the northwest. At 7:45 pm, the NWS informed the emergency broadcast system that an upgrade to a tornado warning was expected. This warning, however, was never issued. At Edgewater Beach, just west of downtown Cleveland where Independence Day festivities were in full swing, warnings were never relayed to the local public. According to a local account by Shirley Amster, a severe storm warning was issued and relayed by the Cleveland radio stations around 7:50 pm local time just before the derecho impacted the Lake Erie coastline but was not relayed over the marine channels. At the Edgewater Yacht Club around 20,000 people had gathered to watch the fireworks. While police at the park had received the weather alert, it was not broadcasted over the P.A. because “they didn’t want the audience to panic.” Shortly after, and just before the storms moved into the Lake Erie coastline, the storms merged into a stronger line, and then into a bow echo, before moving off to the southeast.
The 1969 derecho, appropriately named the Ohio Fireworks Derecho, blasted on shore around 8 pm, right as holiday festivities were beginning in earnest all along the lakefront. Widespread winds wracked the entirety of the lakeshore, with a boater near Toledo recording a gust of 104 mph, and gusts of 100 mph reported in Cleveland. The derecho continued its southeastern track reaching the Akron area between 9 pm and 10 pm and eventually into the Pittsburgh area between 10 pm and 11 pm. After 11 pm the derecho began to dissipate and the strongest winds along the leading edge ceased. However, the danger was far from over as a stationary frontal boundary persisted. As a result of the wind damages, thousands of trees were uprooted and thrown, buildings and homes were damaged and destroyed, and boats were flipped and capsized, drowning 4 people in the process while also causing 100 others to need rescuing by the Coast Guard. People waiting outside for fireworks were offered a much different show than anticipated as rain, wind, and lightning ripped apart outdoor venues and caused mass power outages. One of the hardest hit areas was Toledo where the winds knocked down 5,000 trees and damaged several homes, leaving 75,000 homes without electricity. After the storms, according to the Cleveland Plain Dealer as reported by the Cleveland Electric Illuminating Company, 175,000 customers were without power. Another hard hit area was Lakewood, located just to the west of Cleveland, where the damage and destruction was extensive.
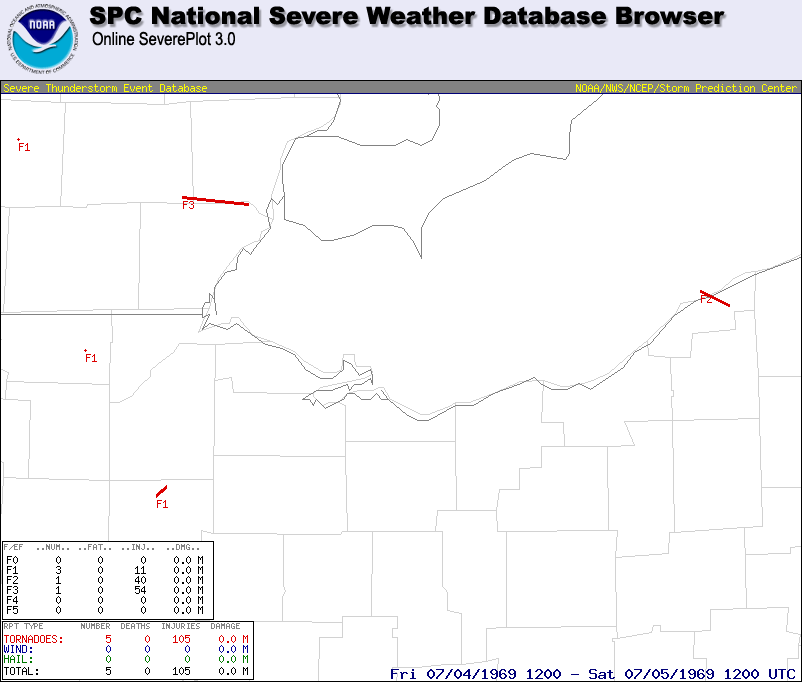
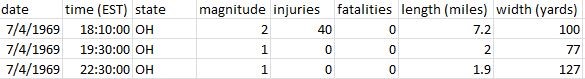
Image and table showing the locations and statistics of the three reported tornadoes from the evening of July 4th, 1969 associated with the derecho. The 1st tornado in the table corresponds to the F2 tornado reported to the Northeast of Mentor in Perry in Lake County, the 2nd tornado report corresponds to the F1 tornado reported to the West of Toledo in Delta in Fulton County, and the 3rd tornado report corresponds to the F1 tornado reported North of Findlay in Hancock County.
Unfortunately, the evening also saw 3 tornadoes, one of which was rated as an F-2, which tracked through Perry around 8:10 pm, injured 40 people, and also destroying several homes. Also, an F-1 tornado that touched down at 7:30 pm near Delta uprooted trees, damaged several homes, and demolished 2 barns. One other F-1 tornado touched down at 10:30 pm to the North of Findlay, and destroyed barns, damaged 4 homes and caused 1 minor injury (Thunder in the Heartland, 213). Luckily, there were no related fatalities from these tornadoes.
The winds from this derecho caused extensive damage throughout the Northern Ohio region, with the worst of this damage reported along the lakeshore as the derecho first rolled onshore. However, the storm system continued its destruction as it tracked into Pennsylvania, causing additional power outages and damage to trees and homes. In Meadville, 5 people were injured from the high winds of this derecho. Within Ohio, a total of 18 people were killed due to the high winds associated with the derecho.
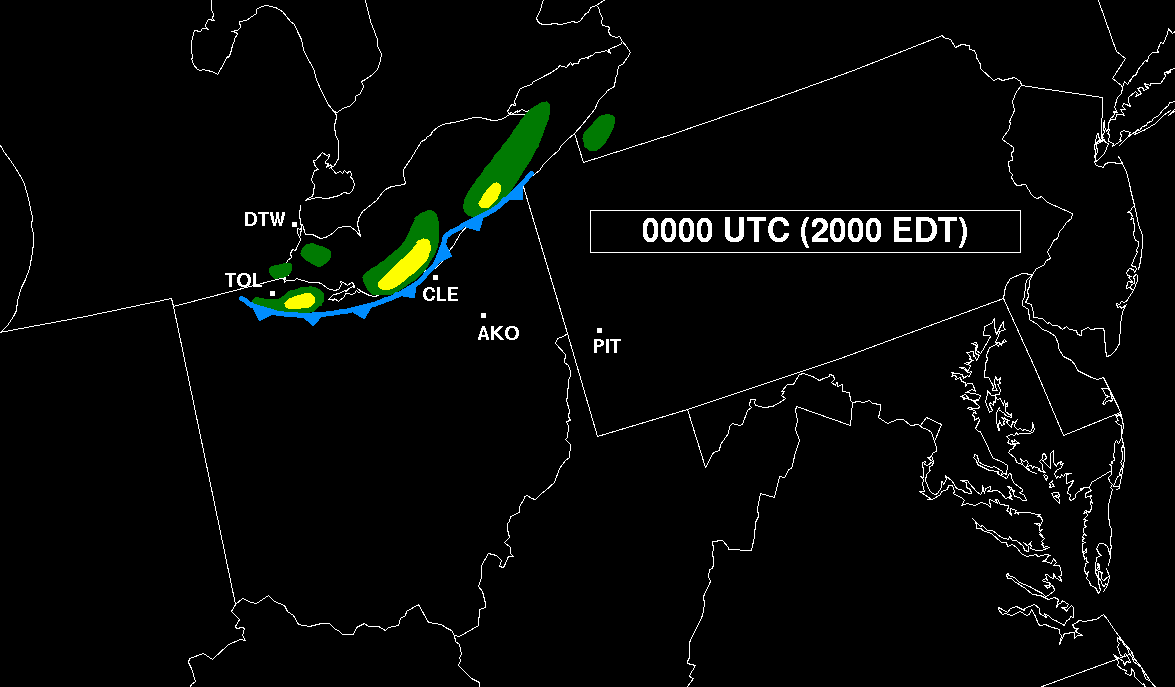
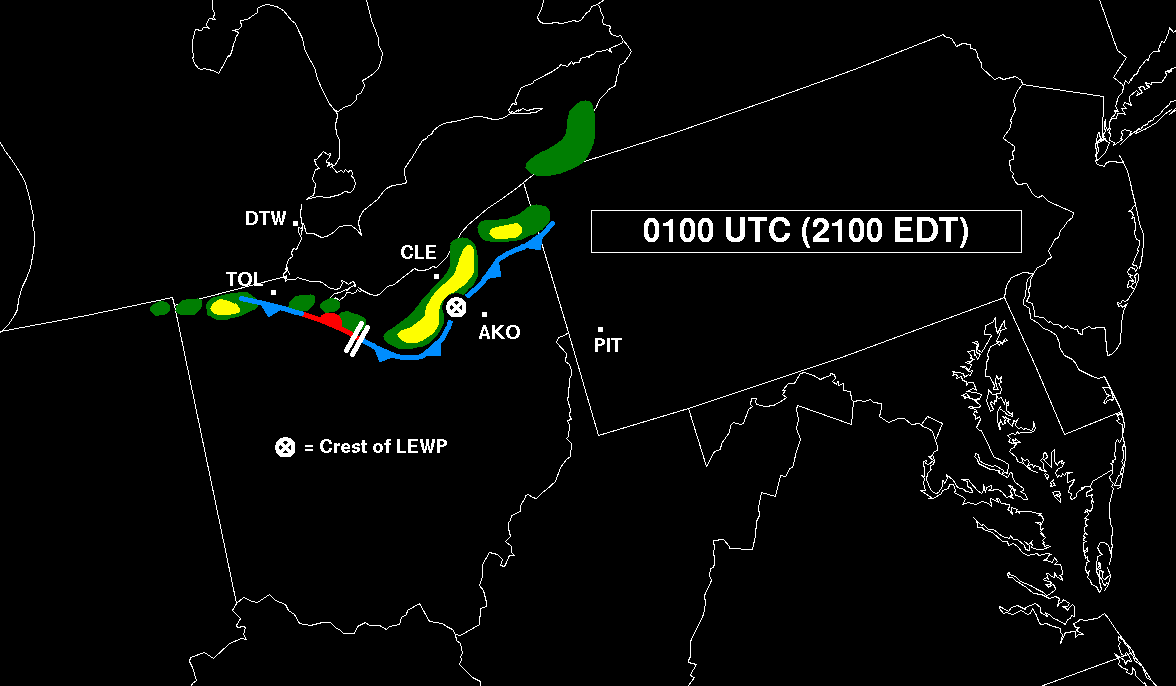
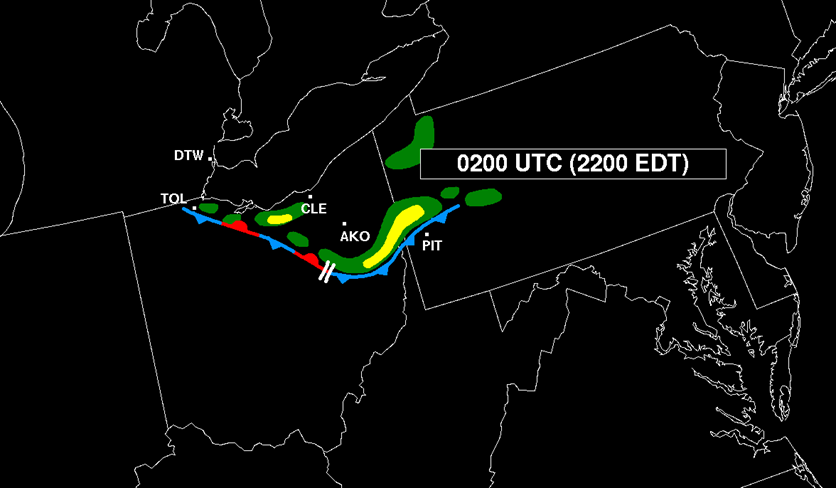
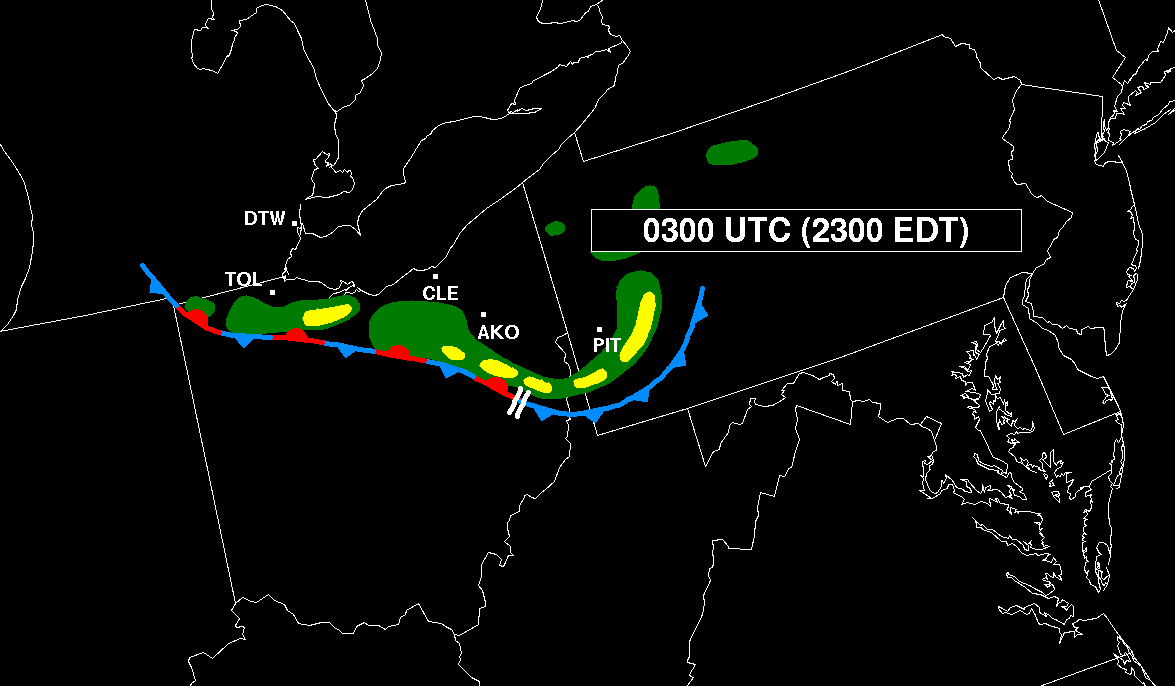
Series of images showing the hourly sequence of smoothed radar reflectivity, based on hand-drawn sketches made from the Pittsburgh, PA WSR-57 radar data that appear in Hamilton 1970. Subjectively-analyzed outflow boundaries depicted by conventional frontal symbols. The two reflectivity levels shown loosely correspond to "heavy" (green, VIP level-4) and "intense" (yellow, VIP level-6) WSR-57 calibrated echo strength. The cross symbol in the 0100 UTC (2100 EDT) image marks the approximate location of the line-echo wave pattern (LEWP) shown in Figure 2. The three-letter airport IDs denote locations mentioned in the text (Akron, OH (AKO), Cleveland, OH (CLE), Detroit, MI (DTW), Pittsburgh, PA (PIT), and Toledo, OH (TOL)). (Adapted from the Storm Prediction Center website).
DERECHO METEOROLOGY
A derecho is defined as “A widespread, convectively induced straight-line windstorm, more specifically, any family of downburst clusters produced by an extratropical mesoscale convective system.” (American Meteorological Society, 2014). Furthermore, derechos generally have swaths of damage that extend around 250 to 400 miles in length, around 60 miles in width, and these systems contain 58 mph winds along most of that damage path with a few 75 mph or greater gusts. The definition mentions ‘mesoscale convective systems’ (or MCS), which is a specific type of organized thunderstorm structure. The most familiar type of MCS is a squall line; a long line of storms moving quickly with a single boundary, typically a cold front. Commonly, derechos occur in a special type of squall line, called a bow echo. Bow echoes are different from traditional squall lines due to the presence of much more intense straight-line winds, which cause the line of storms to bend (giving it the shape of a handheld bow). These storms are often associated with severe wind damage on par with that of tornadoes. More intense straight-line winds lead to more intense bowing segments of storms, which can occasionally bend so much they can produce directionally sufficient wind shear to create tornadic rotation (referred to as bookend vortices).While both bookend vortices can produce tornadoes, the northern end is more favorable due to its cyclonically rotating nature. In June of 2012, another derecho blew through Indiana, Ohio, and West Virginia wracking communities with winds gusting over 70 mph across the area. The storm resulted in $2.9 billion in damages, millions of power outages spread across two-thirds of the state, and 22 deaths.
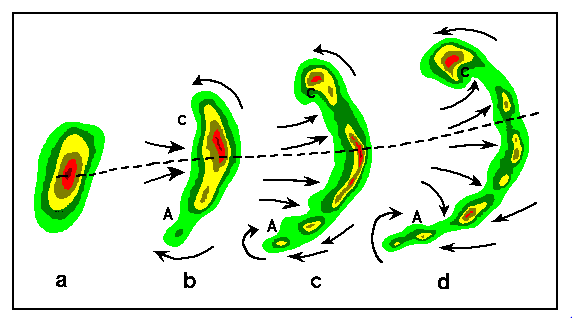
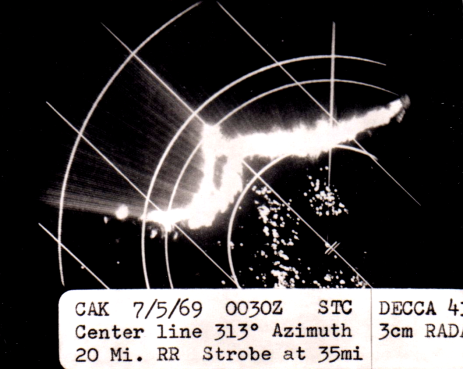
Typical evolution of a thunderstorm radar echo (a) into a bow echo (b,c), and into a comma echo (d). Dashed lines indicate axis of greatest downburst potential. This bow echo was a feature of the July 4th 1969 derecho and can be seen on a radar image from Akron, Ohio as one of the first bow echoes recorded. Arrows indicate storm-relative winds. Regions of cyclonic rotation (C) and anticyclonic rotation (A) are both capable of supporting tornado development (especially C). (Source: National Weather Service page on Bow Echo development).
This image above shows the typical structure of a bow echo feature which is an MCS feature often found in squall lines and derechos. This feature played a key role in the July 4th, 1969 derecho event and was responsible for some of the damaging winds that produced the extensive damage across Northern Ohio. This feature was again a key factor in the June 29th, 2012 derecho which also produced extensive wind damage across Indiana, Ohio, and West Virginia.
The following series of images represents an example of radar reflectivity from a typical derecho event, as well as the extensive swath of damage reports and the filtered storm reports from June 29th, 2012. Both of these images serve as an example from the June 2012 derecho that also impacted a good portion of Ohio. Evident in the radar reflectivity is the bow echo feature with bookend vortices, as well as the expanse of that features. Furthermore, the strong winds from this feature can clearly be seen with numerous wind gusts of 70 and 80 mph from this event. However, the highest gust from this event was a report of a 91 mph wind gust in Northern Indiana, comparable to the 100 mph wind gusts experienced from the July 1969 event. Furthermore, evident in the storm reports image are the immense amount of wind damage reports (close to 700 from the June 2012 derecho case), as well as the spatial expanse of those reports. These images truly capture the expanse of these derecho events and damaging winds, just like that of the July 4th, 1969 event.
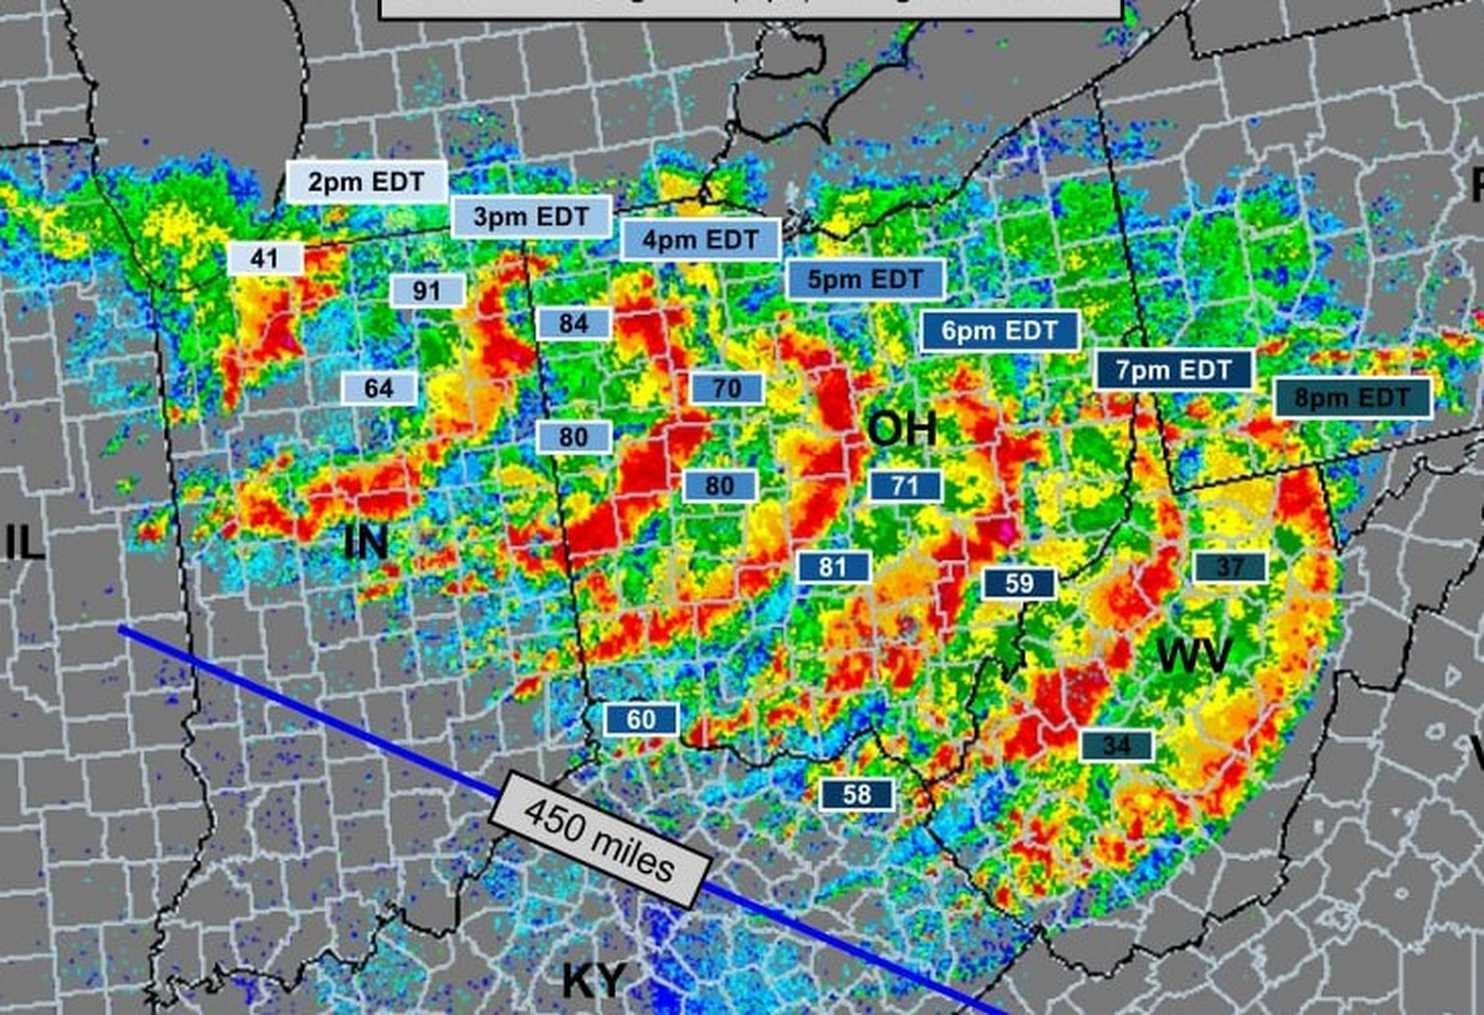
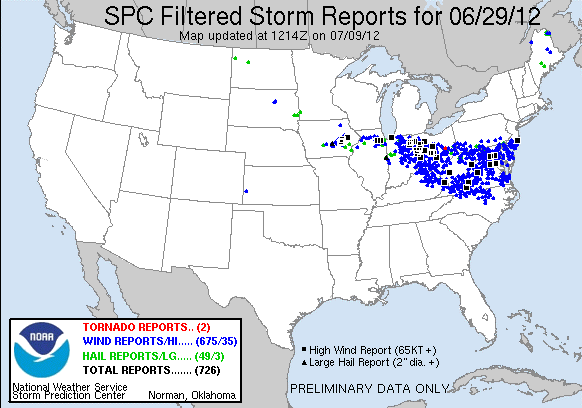
Images showing the progression of the June 29th, 2012 derecho through radar reflectivity, as well as the storm reports that followed the event. The numbers in the first image represent the maximum recorded wind gusts in miles per hour at given locations. (Source: Storm Prediction Center).
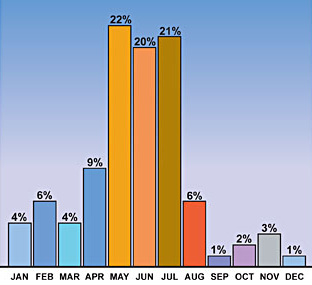
Image showing the seasonality of derecho events within the United States. (Source: Storm Prediction Center and Dennis Cain).
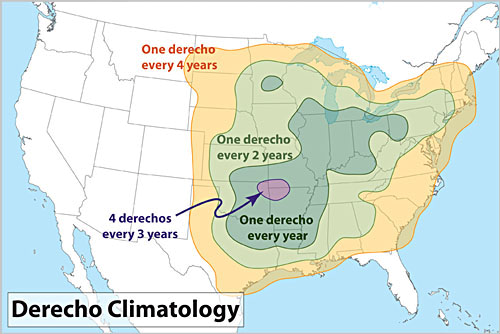
Image showing the climatology of derechos within the United States. (Source: Storm Prediction Center and Dennis Cain).
The images above show the climatology and seasonality of derecho events within the United States and specifically within our region of Northern Ohio and Northwestern Pennsylvania. It should be noted that derecho events have been documented within parts of Europe, but are most commonly seen within the United States, as the meteorological setup is the most favorable there. As can clearly be seen, derecho events are most likely to occur in the spring to summer time frame. In fact greater than 75% of derechos occur during the months of April to August. This start of a potential derecho season uncoincidentally lines up with the start of thunderstorm season as the necessary ingredients for thunderstorm and severe weather development come together. The derecho climatology map above clearly indicates the most likely locations of seeing a derecho within a given amount of years. The bullseye in this map is in the Southwestern Missouri, Northwestern Arkansas, and Northeastern Oklahoma region, which sees on average around 4 derechos every 3 years.Our region in Northern Ohio and Northwestern Pennsylvania is within the dark green shade of this map meaning that we see generally see a derecho in every one or two years. It should be noted that this map is just an estimation of the frequency of derecho related events. Also, it can be seen that there is a sharp cutoff to the West of the Great Plains in derecho occurrences as conditions are much less favorable in this region. However, while rare, derechos can occur in the Western US especially during the spring and summer. One such example of this is the Utah/Wyoming derecho of May 31st, 1994 which. Furthermore, while derechos are less likely during the cold season of September through April, derechos during this timeframe are most likely to occur in the Southeastern US.
ATMOSPHERIC INGREDIENTS FOR DERECHOS
There are a few basic ingredients for a powerful derecho, and the Midwest was sitting in a perfect setup for severe storms on the morning of July 4th, 1969. The general ingredients for any thunderstorm are moisture, instability (tendency of an air parcel to accelerate vertically upward), and a lifting mechanism such as a frontal boundary like a cold front or warm front. For severe thunderstorms and other severe weather, such as tornadoes, a fourth component is required. That fourth component is vertical wind shear, which is the change in wind direction with height (directional shear), or wind speed with height (speed shear). Specifically for derechos, regarding the moisture component, you need sufficient moisture near the surface, as well as high temperatures (temperatures in the 80s or higher, with dewpoints in the upper 60s or higher). Regarding the wind shear component, for derechos you need at least moderate wind shear with northwesterly (from the northwest) flow at mid-high levels (around 500 mb) to maximize the intensity of the straight-line winds and to drive the derecho to the southeast. Typically, this setup for derechos provides the most intense results and allows for the development of the Rear-Inflow Jet (RIJ; a wind speed max that is found aloft at the rear of the storm compelx) which provides warm, moist inflow to feed the storm system. This allows the storm complex to persist over great distances, and allowing the storm complex to produce bow echoes, which can evolve into a derecho if long-lived. The RIJ can produce bow echoes as the air from the RIJ is advected downward by the storm downdraft and outward at the surface. This causes regions of faster winds in the storm complex, causing the leading outflow ahead of the storms to surge ahead in specific areas. This leads to bow echo features in radar reflectivity and radar velocity products. These bow echo features can produce damaging wind gusts. In addition to derechos, bow echo features can also be found in other Mesoscale Convective Systems (MCS’s) such as squall lines and Mesoscale Convective Vortices (MCV’s). Often times the onset of a derecho, squall line, or thunderstorm contains a shelf cloud. A shelf cloud is a wedge-shaped cloud extending out from the main outflow from a thunderstorm. The onset of a derecho can be accompanied by a shelf cloud, but that is not necessarily always the case. Images of shelf clouds can be seen in the photographs below.
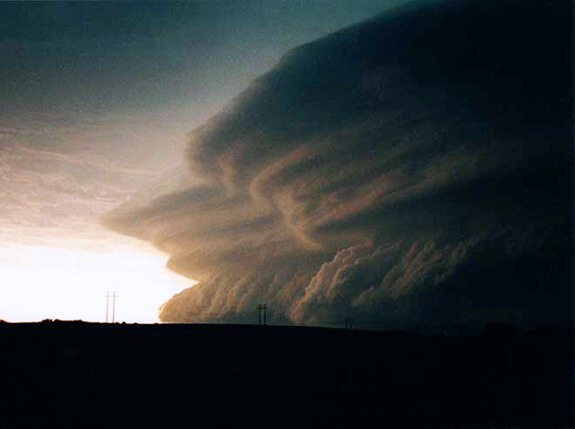
Photograph showing a multi-tiered shelf cloud associated with the onset of a derecho-producing storm in Oklahoma on May 27th, 2001. (Source: Storm Prediction Center and photographed by Douglas Berry).
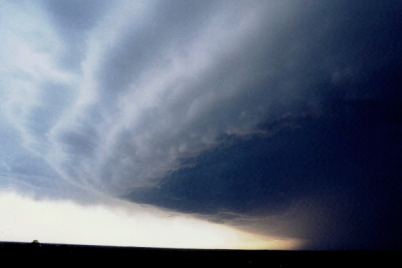
Photograph showing a shelf cloud associated with the leading edge of a derecho storm in Texas in April 2000. (Source: Storm Prediction Center and photographed by Stephen Corfidi).
ATMOSPHERIC INGREDIENTS PRESENT ON JULY 4TH, 1969
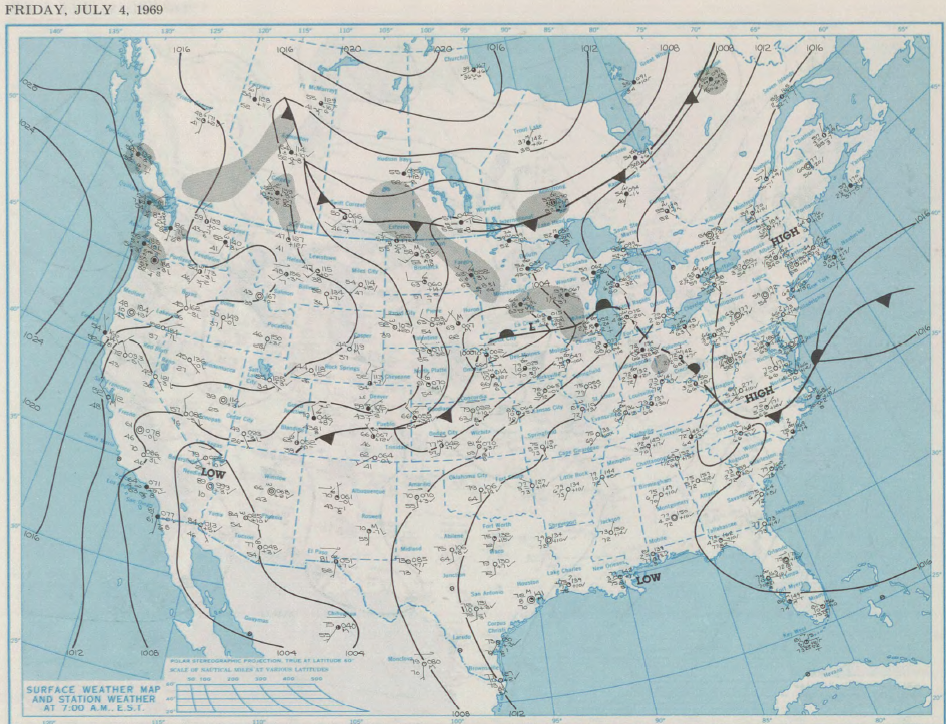
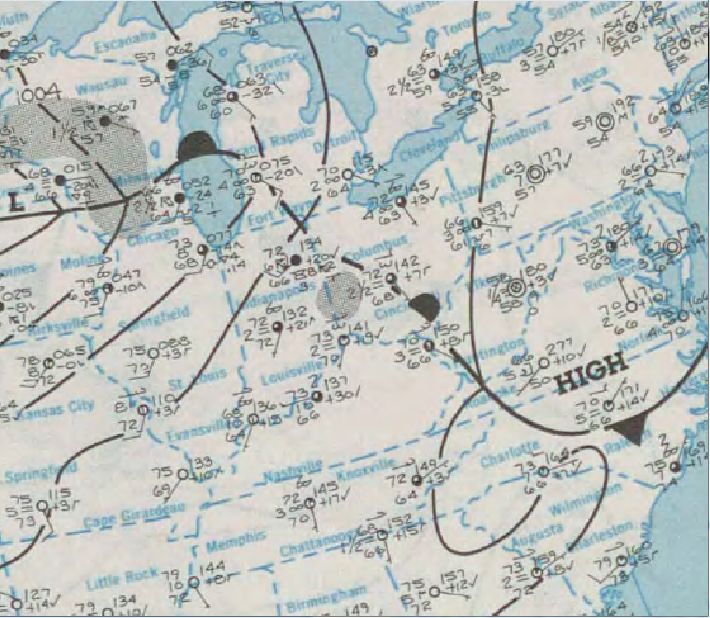
Surface analysis maps from July 4th, 1969 showing the U.S. with a zoomed in image of the Midwest and Northeast U.S. (the main area of severe weather on this day) (Source: library.noaa.gov)
This surface map is valid for 7 am (EST) on July 4th, 1969. The map indicates that the majority of the surface winds across Ohio and Michigan (where the storms for that day initially fired off) have a strong southerly component, which will factor in later in bringing up sufficient moisture from the Gulf of Mexico (a key component for any severe weather event). This southerly flow was a key component in supplying ample upper level and surface moisture, which is one of the key ingredients required for severe thunderstorms and derechos. This ample moisture can be seen on the surface analysis map which indicates dewpoints in the 60s and 70s even as early as 7 am across much of Ohio, Michigan, and Indiana. Additionally, surface temperatures are warm for how early it is, just above 70 in Ohio and in the upper-60s in Michigan. This, along with the minimal cloud cover over the region throughout the day, would assist in providing sufficient daytime heating. This daytime heating (as is the case for most thunderstorm and severe weather events) is then pertinent in adding the necessary instability to the environment to fuel convection. This indicates that the other key ingredient for severe thunderstorms, instability, was at play in a big way on this day allowing for explosive thunderstorm development. This was especially favorable for a derecho event given the high to extreme instability present. Analyzing the surface analysis map shows that a strong low pressure system was located over the Minnesota/Iowa border. This pressure system was one of the other main sources for instability and uplift on this day as it tracked eastward into the Ohio/Michigan region later that day. Moreover, note the frontal boundary that can be seen on the surface analysis images cutting through portions of Western Michigan and Ohio. This frontal boundary served as the other key component for severe thunderstorms, a lifting mechanism, which was present on this day. This frontal boundary would add to the daytime heating and lead to more uplift and thus instability across the region. Also, while this frontal boundary is currently a warm front, it would evolve into a stationary front later on this day, allowing massive amounts of moisture and instability to remain in the region even after the initial line of storms from the derecho had passed. It is this factor that would allow massive flooding to occur overnight throughout much of North-Central Ohio.
Moreover, the fourth and final key ingredient, wind shear, was also present on this day. The upper air analysis map below shows the flow at 500mb, which allows us to look at wind shear. As can be seen, the winds over the Ohio and Michigan region are fairly strong (around 50 knots) and are from the northwest. With the mainly weak and southerly surface flow around 5 knots across much of the region (as seen from the surface analysis maps), this provides very noticeable wind shear. This type of directional wind shear (where wind direction turns clockwise with height) is called veering and is favorable for severe weather. These veering winds with height specifically aid in providing more warm air advection into the region which assists in daytime heating and instability. Comparing the 500mb flow map with the surface analysis maps also indicate the presence of significant speed shear of around 45 knots between the surface and 500mb. This speed shear that was present helped the storms that formed over Southeast Michigan to maintain their structure and thereby strengthen as they tracked across Ohio and into Western Pennsylvania. Specifically, speed shear aids in keeping developing storms and their updrafts focused along the outflow boundary, and thus restrains the outflow boundary along the updraft region. Otherwise, the outflow from the storms would push out ahead of the main line of storms rather quickly, cutting off the source of inflow and main updraft required to maintain the storms. This situation would result in the storms dissipating rather fast and would not allow for a long-lived damaging wind event such as a derecho. Thus the presence of this speed shear on this day helped storms to maintain their structure and be longer-lived as it pushed them quickly to the southeast with the assistance of the high pressure seen to the south on the 500mb flow map. With 0-3km bulk shear of greater than 30 knots and 0-6km bulk shear of greater than 40 knots on this day, a long-lived and widespread damaging wind event such as a derecho was very possible. Moreover, with the available moisture from the surface winds, the high to extreme instability present, and the favorable shearing profile, this is a textbook severe weather environment.
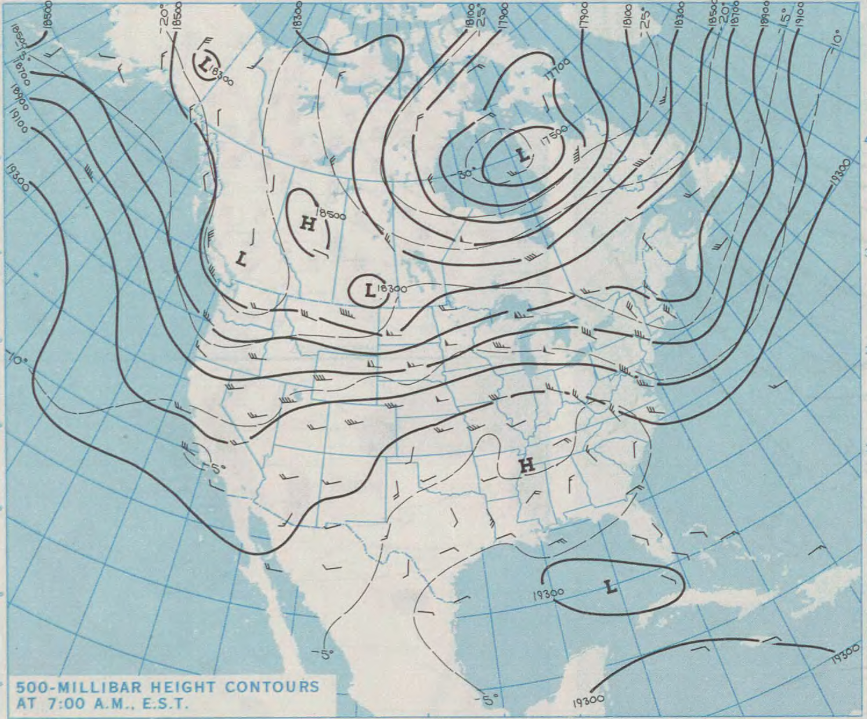
Upper air analysis map showing the 500mb flow across the U.S. from July 4th, 1969. (Source: library.noaa.gov).
THE UNFORSEEN DERECHO AFTERMATH: THE JULY 4-5TH, 1969 FLOODING EVENT
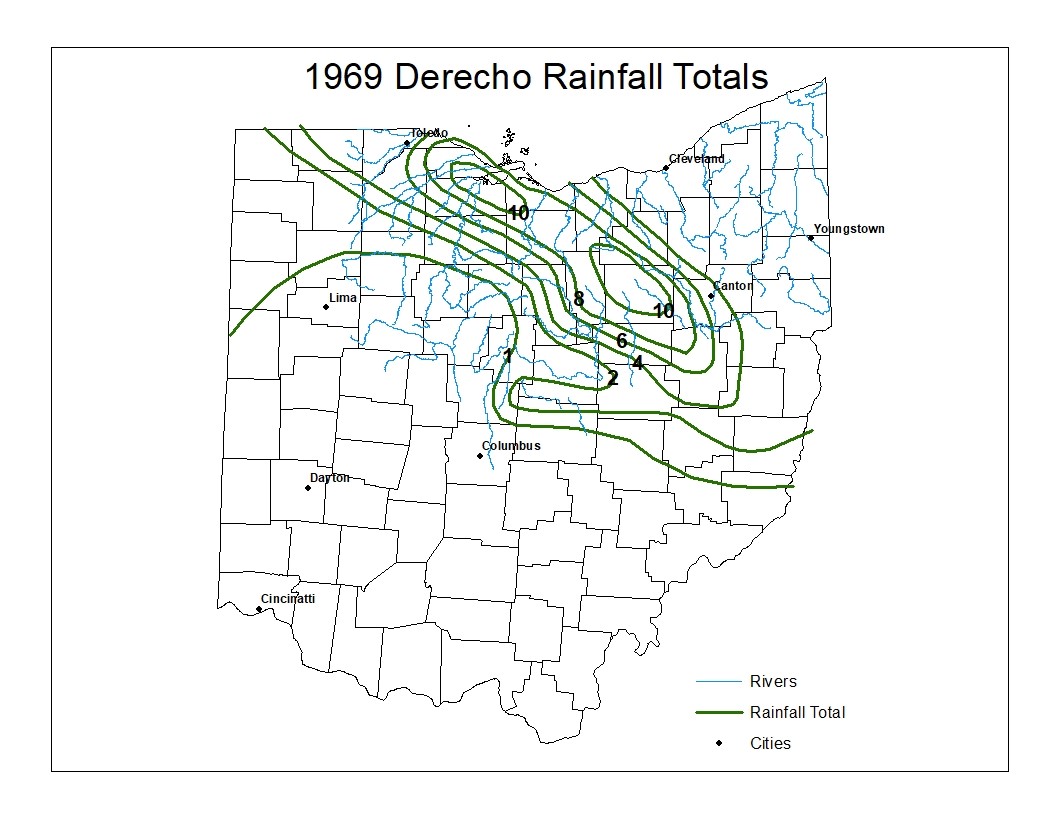
Reproduced image showing the rainfall (in inches) on July 4-5th 1969. The local area rivers and streams are also represented on this image in the blue outlines.
Despite the wind damages left behind from the powerful derecho, this was not the end of the storms reign in Northern Ohio. Most of the damages and fatalities associated with this event were to follow the derecho winds. Unfortunately, the fast-moving derecho, which should have moved on from the region rather quickly, left a strong pocket of instability and ample upper level and surface moisture behind. These ingredients resulted in additional storms firing overnight along the stationary front that evolved from the warm front seen on the 7 am surface analysis.
The excessive rainfall that fell was the result of northwesterly winds across the surface in Northern Ohio that persisted after the main bowing segment of the derecho had passed. Specifically, it is these winds that brought in warm, moist air from the west throughout the overnight hours which caused the storms and rainfall to persist into the early morning hours on July 5th. Furthermore, these surface winds combined with the trailing regions of the derecho’s outflow which became nearly stationary along a northwest-to-southeast line that extended from southern Michigan into northern Ohio to produce the deluge of rainfall seen in the above map. The stationary front also aided in causing storms to persist throughout the night of July 4th, and to continuously dump rain over the entire area for over 8 hours, causing widespread flooding and flash flooding. Ultimately, more than 10 inches of rain, with as much as more than 14 inches, fell over the duration of just 8 to 12 hours across portions of North-Central Ohio leading to disastrous impacts.
While the leading outflow associated with the derecho-producing convective system moved out of the Northern Ohio region by 10 pm local time, the persistence of the moisture and instability in the region continued to promote convection and storm development across the Northern Ohio with the “training” of the storms (rainfall persisting in a specific area) occurring. By 1 am local time, after hours of heavy rains, flash floods were breaking out over a large swath of Ohio, along a line 20 miles wide that ran from the Toledo area clear into Wheeling, West Virginia. Rainfall rates exceeded a staggering 2 inches per hour in most areas, and rain accumulation totals were well into the double digits. In most of these areas, flooding was prominent as far as the eye could see. This was especially the case in Ottawa and Sandusky counties where fields, homes, and roads were all flooded. In the city of Toledo, an 8 million gallon water and oil storage basin overflowed, creating an oily pond in the area. In the city of Fremont along the Sandusky River, floodwaters were 4 feet deep, and further southeast in Norwalk the floodwaters pushed through the road network and the lower reservoir southeast of the city broke, knocking out the power plant and leaving the city without power or clean drinking water for 5 days. Within the city of Norwalk, floodwaters were as deep as 7 feet inundating houses, buildings, and cars. Also in Huron County, the water remained 3 feet deep in the city of Bellevue a full week after the flooding began. Further southeast in Northern Ashland County, most areas were without power for two days after the floodwaters receded, and 30 bridges in Ashland County alone were damaged. All of Wayne County got more than 9 inches overnight, with Chester Township reporting a whopping 14.8 inches in just over 8 hours while observations at Marshallville and Wooster recorded 9.44 and 10.36 inches of rain. With 110 destroyed or damaged bridge structures and widespread flooding over major road networks, virtually every road leading in or out of Wooster was closed. The city’s water plant wasn’t operational until July 11th, while Orrville (also in Wayne County) suffered from a total power loss. They didn’t manage to restore power to even 10 percent of the city until the 7th. Sixty-six bridges were damaged within Erie and Huron Counties with another sixty-five bridges damaged in Holmes County.
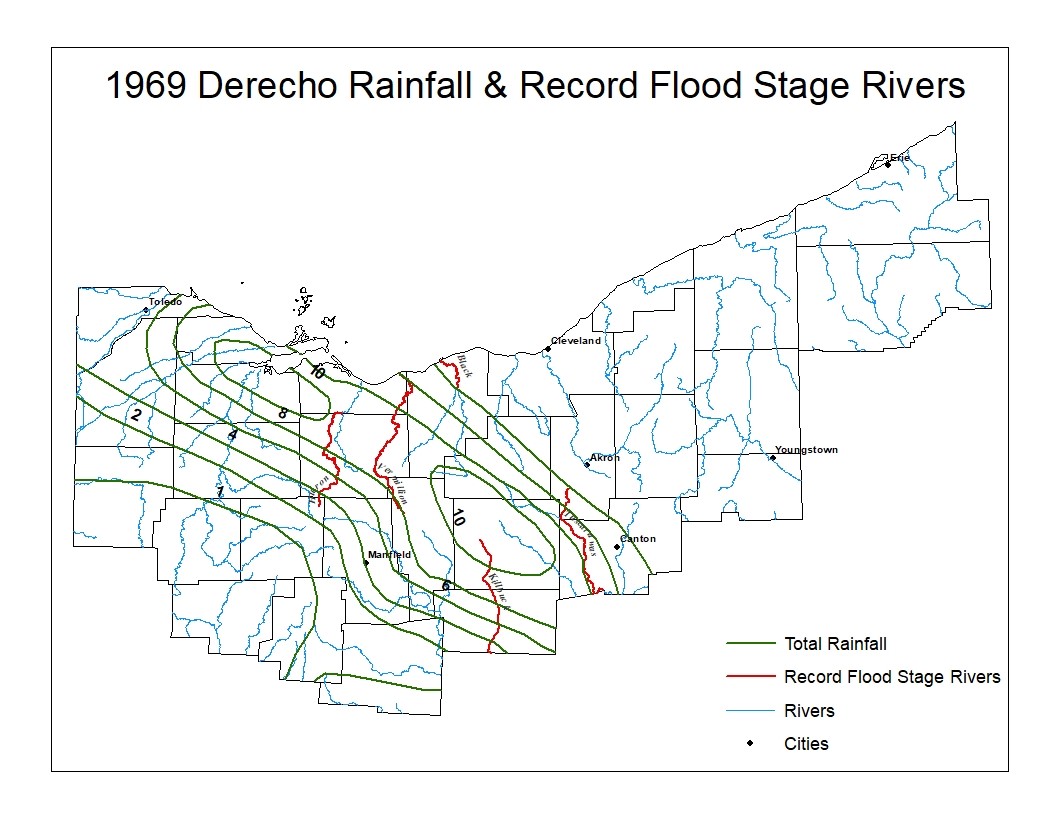
Reproduced image of NWS Cleveland’s CWA (forecast area) showing the rainfall (in inches) on July 4-5th 1969. This image also depicts the local rivers and highlights those which reached record flood stage and had the biggest impacts during the event (those include the Huron River, Vermillion River, Black River, and Tuscarawas River).
The worst of the flooding and its impacts, however, was associated with the flooding of the river basins, with several rivers reaching critical flood stage levels. Due to the suddenness of the heavy rain that fell as well as the excessive runoff into the local rivers and streams, several of the rivers reached into moderate or major flood stages. Some of the rivers even reached record flood levels. Some of those rivers still have the July 4th-5th, 1969 flooding event as the flood of record to this day. It is possible that even more rivers across Northern Ohio would have experienced record or near-record flooding if gauges and data had existed for the rivers at this time. The Killbuck creek rose 20ft from its usual levels, breaking an all-time record for the area and putting 95 percent of all standing structures in the town under water. On July 5th, 1969 the stage in Killbuck at the gauge KILO1 was reported as 26.4 feet, which is 7.9 feet above the present day major flood stage level. This resulted in hundreds of residents spending days living in the local elementary school. The Ashland Reservoir dam gave way the morning of the 5th, inundating the Jerome Fork Watershed with about 110 million gallons of water. This disaster cost the city of Killbuck a third of its entire water supply. The Vermilion and Elyria river site gauges along the Vermilion and Black Rivers also reached record flood stages from this event which still hold to this day. On July 6th, 1969 the stage at the VERO1 gauge along the Vermilion River just to the south of Vermilion reached 17.14 feet, 1.64 feet above the present day major flood stage level. Also on July 6th, the stage at the ELRO1 gauge along the Black River in Elyria reached 26.4 feet, 8.4 feet above the present day major flood stage level. As a result of both the flooding of the Vermilion and Black Rivers, 440 homes were evacuated within Lorain County. Further west, the Huron River in Milan at gauge location MILO1 also reached record flood level from this event. On July 5th, 1969 the river rose to a staggering 31.1 feet, a whole 8.6 feet above the present day major flood stage level. As a result, more than 4,800 people were evacuated from their homes in Erie County due to the excessive rainfall and flooding of the river. Other rivers that had this in the record books included the MLNO1 gauge along the Tuscarawas River in Massillon where the river crested to its second highest level ever on record, second only to the flooding caused by the Great Flood of 1913. On July 5th, 1969 the river reached a stage of 16.43 feet on, which is 0.43 feet above the present-day moderate flood stage level for the river gauge.
All, however, was not terrible, as there were a few bonding heroic moments from the disaster of the evening of July 4th. Major flooding was avoided in Massillon, where twelve men courageously worked together to close gates on the railroad opening between levees near the flooded Tuscarawas River. The river would have crested 10 feet above flood stage and would have caused millions more in damages. Additionally, in Ashland, two highway patrol officers, a gas station owner, and a truck driver were able to pull a family of four from their car after it got caught in flood waters and was swept right off of I-71. There were also other reports of heroic rescues across the state of Ohio.
In total, the floods killed 14 people in Wayne County alone with more deaths coming as people were swept off the roadways in their vehicles by the floodwaters or as they drowned trying to escape the floodwaters. A total of 25 to 30 people were killed by the flooding, mostly by drowning.
In total, the Derecho of July 4th, 1969 and the following floods left an estimated 46 people dead, 559 injured, and over 66 million dollars in damages by 1969 dollars. Total damages from the winds, tornadoes, and flooding included the destruction of 32 homes, damage to approximately 10,000 homes, and the damage and destruction of around 300 mobile homes and 180 farm buildings. This event also led to the destruction of 104 small businesses, damaged and destroyed around 700 boats (as most were capsized and pushed around like feathers in the fierce derecho winds along the Lake Erie coastline), and around 7,000 cars. By 2019 standards, this would have translated to 450 million dollars in damages. With such a wide array of impacts from this event from damaging winds and lightning to catastrophic flooding, this event remains one of the most significant, costliest, and most deadly weather events in Ohio’s history. Luckily, technology and specifically observational data and radar over the last 50 years have greatly improved and have become much more readily available. This, in turn, has led to improved lead time on storms and warnings, so another tragedy like this one would be easily avoidable today. Furthermore, weather information in the form of forecasts and warnings are much more reliable and communicated more easily today meaning word on severe weather events and dangers spreads much faster. Therefore, with an event like this occurring today, damages and fatalities would be greatly mitigated owing to greater preparation. Derechos are much better understood and predictable nationwide today, with the possibility of one being forecasted up to a day in advance. This event came at the most inopportune time possible when thousands of people were crowded together outside; wanting some holiday fun they were reluctant to leave. As such, the Ohio Fireworks Derecho event was one for the ages and is well-remembered by surviving members of the community even now.
  |
 |
 |
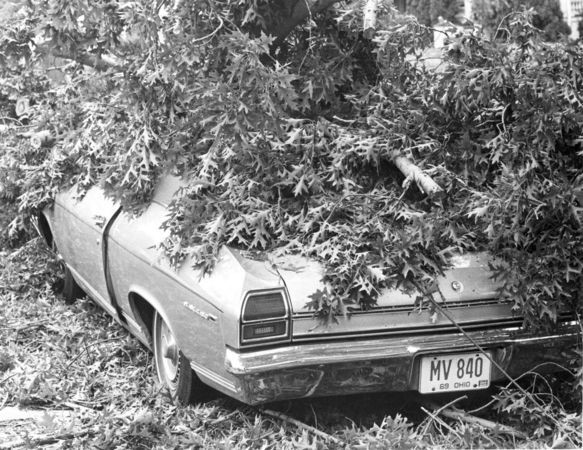 |
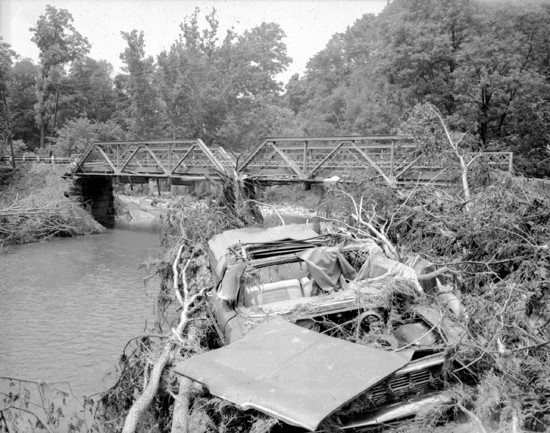
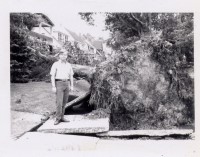
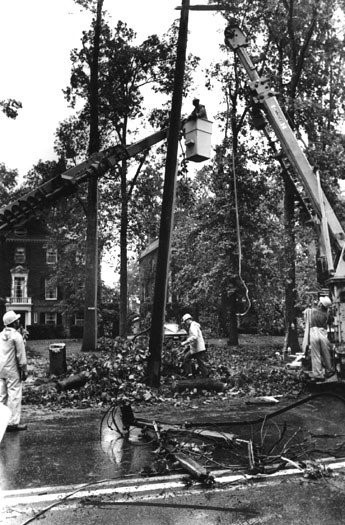
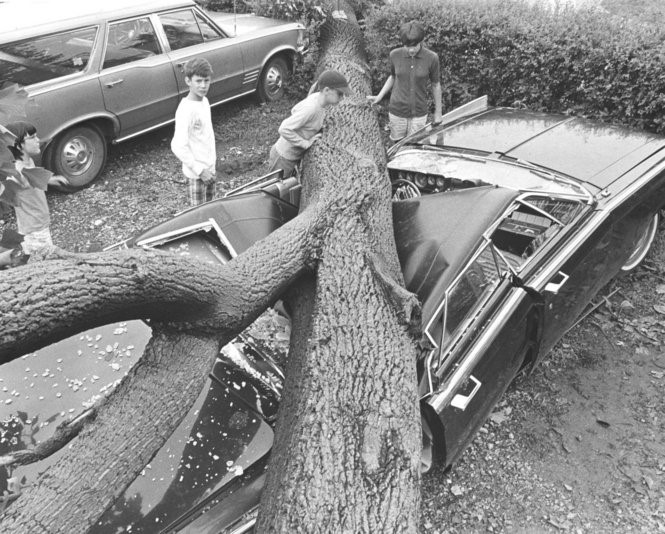
Images showing some of the wind damages across portions of Ohio brought on by the July 4th, 1969 derecho event. (Source: Storm Prediction Center).
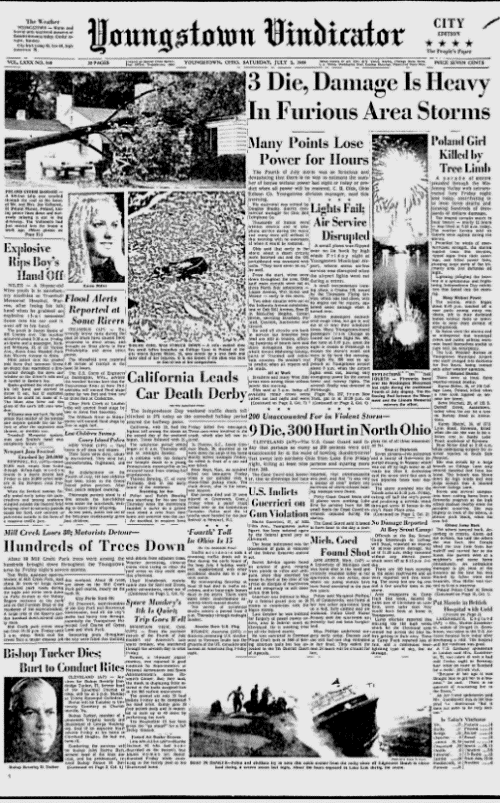
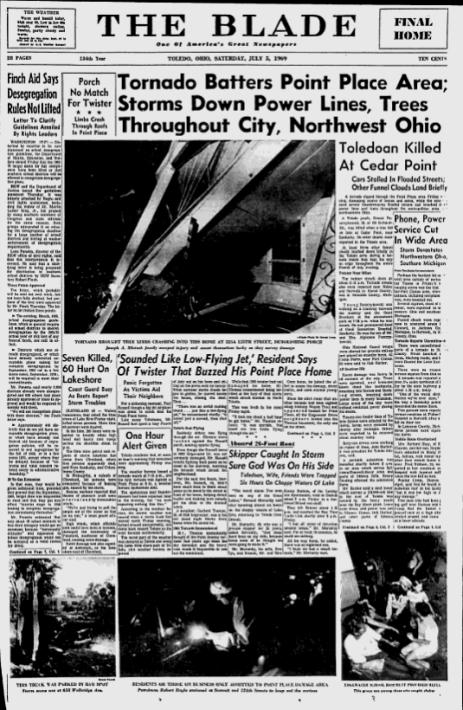
The Youngstown Vindicator and The Blade front page from July 5, 1969 referencing the damages and fatalities from the previous day’s derecho event. (Source: Google Newspaper Archive).
VIDEO LINKS:
[YouTube videos for radar and satellite from the June 29th, 2012 derecho to give an example of the spatial expanse occupied by a derecho event. The visible satellite imagery shows the amount of instability present in an event like this contributing to explosive thunderstorm development.]
Radar Reflectivity: https://www.youtube.com/watch?v=AIs_8wq_mFI
Visible Satellite Imagery: https://www.youtube.com/watch?v=Puytt0Ce3-M
[YouTube videos relating directly to the July 4th, 1969 event giving an overview of the event as well as a video showing some of the flash flooding that occurred.]
Overview: https://www.youtube.com/watch?v=r6ITrsEMLq0
Flooding in Ashland: https://www.youtube.com/watch?v=MIbS5hyiQVM
PERSONAL STORIES
Melinda Yerdon: “I was only 6 at the time, but remember sitting at my great-grandparent's house in Erie County watching it all happen. A huge cottonwood tree got blown over next door and I distinctly remember the Hayes Ave. (route 4) underpass in Sandusky was flooded almost to the railroad tracks above.”
Dylan Boli: “I remember sitting on the front porch in Akron and watching the sky turn black.”
Christiana Yonkings: “I remember getting ready to watch the fireworks then the storm came and trees & powerlines down everywhere on the west side. Took forever to get home from a friend’s house”
Brenda Eagleson Ward: “I was 12 and living in Huron County, Ohio... The lightning was constant for almost 24 hours. The rains were heavy. The Vermilion River flooded to within about 50 feet of our house (We lived about a quarter of a mile from it.). We had the neighbors’ animals in our yard for over a week. They had to wade through the flood to feed the peacock who wouldn't leave the top of the barn. They had to send the rescue crew in a boat to rescue some neighbors that refused to leave their house. The flood got to about 3 or 4 feet deep inside their house. (Upstairs, not the basement). We waded in the neighbors’ front yard even though there was diesel fuel floating in it. I still have the pictures from it.”
Ronda Snyder: “Spent the storm outside in a corner of my covered front porch in Cleveland Hts...a 13 year old that would not go inside despite my Mom's pleading. It was intense and I gained a lifelong respect for the weather and warnings that day. I scampered among the puddles afterwards and our neighborhood was lucky; not so with others and it was all the news for the next few days.”
Sue Wait McMahon: “I was 12 and in Cleveland that day. It was raining so hard we couldn't see out of the windows of the house we were at. We were near Hopkins Airport.”
Terri Sharp: “We were camping at Clare Mar. I was 11ish. That was scary. Spent part of the night in [the] bathroom because the lake rose and couldn't get [the] camper out. Unreal”
Stephanie Miller: “I was 4 years old and my mom, sister, grandmother (maybe my baby brother) and I were feeding the ducks in Castalia when we saw the storm approaching, we took off for home. We got caught in the storm driving back to Bellevue.... it was terrifying. The rain was coming down in buckets (I don’t know how my mom managed to see to drive at all.) I remember something about power lines down in the road. It rained like that all night and our street was flooded all the way up our house, fortunately missing us. I remember seeing the National guard on our street (and was concerned about the Vietnam War coming to our house.)”
Matt Tucci: “I grew up on the Eastside of Cleveland by Euclid Beach. The lake was a block away, we went down to the beach and all the debris from the sunken boats had come in. Tackle boxes, life jackets, coolers and all kinds of other stuff. There was boat and dock debris everywhere.”
Michael Flagg: “We were camping at Willow Lake Park, in Brunswick. I've never seen the sky so black as it was that evening. I've never heard thunder or seen lightning of that intensity go on for as long as it did. We were relatively shaded from the worst of the wind by a treeline, nevertheless, in the middle of the night, a large branch landed with a terrifying loud bang on the roof of our trailer. The next day we ran home to check on the house. Leaving the camp we saw all the tents that had been blown into the lake on the property. Yes, I remember it, like yesterday.”
Cathy Scalley Walsh: “I was 7 years old. I recall the day was hot. My sister went to Lakewood Park with her boyfriend to watch the fireworks. She was near where a tree fell and killed a girl. Back at home, on the far west side of Cleveland, the power went out. After the storm my parents, brothers and I sat on the front porch. A few hours later, the power on our side of the street returned but across the street, it was out for a couple days. I remember outdoor extension cords stretched across our dead end street from houses with power to those without so they could power their refrigerators. I remember driving with my dad the next day to go to Lawson's on Lakewood Heights Boulevard and seeing trees down. I also recall driving to Lakewood Park with my mom and seeing huge trees on the ground and the roots and soil attached to the bottom of them.”
Denise and Gary Fieldhouse: “We were at Firestone Park in Columbiana, prepared to watch the fireworks but only got to see 2 and the high winds started. As we headed home I recall metal stop signs turning 360° that's how high the wind velocity was!”
Debbie Wojtowicz: “My husband and his family were on their boat in Canada......came back to Huron Lagoons Marina.....everyone's cars had been washed away......marina looked like a war zone.”
Chris Mize: “I was a child and we had spent the day traveling around town to visit family. We were on the way to grandma's house when the storm hit. We made it safely and fortunately she had a basement, but it was quite a show on the way. Flooding on the generally flat terrain happened within minutes. The lightning was continuous, which illuminated the strange looking clouds at the base of the storm. As an adult many years later, I learned that they were mammatus clouds which are somewhat rare around here.
Barb Powell: “It was the day before our wedding. After rehearsal dinner, we decided to go with our wedding party to Cedar Point for the evening. There were also wedding guests coming in from out of state and my parents insisted my fiancé and I stay home in New Washington. My grandparents made it to Dover and stayed overnight due to the storm and never made it to my wedding because roads were washed out. Our groomsmen made it partway to Cedar Point and turned around because water was rushing over the road on route 4.”
Keith Klein: “I was 9. It was the only time I ever saw my Grandpa scared.
He and Grandma came to our house because (and I quote)...
‘If we are going to die, we'll die together.’
After it was over my brother and I blew up a wading pool and used it as a raft in our yard. Water was 2-3 feet deep. We lived a few blocks from Lake Erie.”
Maryann Kane: “We were at Edgewater Park, waiting for the fireworks. Sitting on the hill, then we were looking out to the lake, all of a sudden the wind started picking up. The boats on the lake started turning over. We tried getting up the hill; the winds were so very strong. …the wind started picking me up… Trees were down all over, on cars and roads.”
Amanda Bumgardner: “I was 10 years old and our family just got home and the sky was green. We holed up in the basement all night long in Eastlake. The rain was coming down so hard we put towels around our windows [because] it was just pouring in. We had about 4 inches of standing water in our back yard. Huge limbs everywhere and our backyard was a disaster. My first experience of such a horrendous storm I have never forgotten.”
David Terp: “I was working at Gem Beach on Catawba as a bartender. As I recall, we lost power and closed early. Going into Port Clinton was an adventure because of downed trees blocking many roads and streets. Ended up staying up all night helping clear the local streets of debris. One heck of a storm.”
Sandy Hovest: “I was at the homecoming carnival in Woodville with my friends. The storm came so fast and rain so hard, our parents could barely get there before the streets flooded. Kids got stuck on rides, the power went out. Scary times. No warnings I remember, you just watched the clouds.”
Alan Hopeswell: “I was at Boy's Village, near Wooster. We had water six feet deep in the basements of the cottages.”
Timothy Patton: “…a huge branch fell and just missed my new car. Edgewater Park was a disaster with hail and insane winds. Temps went into the 40's. Boats sank that were awaiting the fireworks. Craziest weather I ever saw!”
Cherie Clark: “I was 10 and my family was at the Painesville Speedway when it hit. Later, my step-father drove us all over to look for damage. We went to Fairport to see what the Mardi Gras looked like. We could only see three rides left standing.”
Carol Martin: “I was 8yrs old. I remember my grandma’s house being swept away in the flood. She lived in Milan. The river was behind her. I remember going to retrieve all her stuff we could find. It was devastation”
Jerry Klingerman: “Even though I was only six, I remember it like it was yesterday. My family celebrated the Fourth — and my grandfathers' birthday— with a picnic in eastern Holmes County. By the time the rain hit we were on our way home, passing through Mt. Eaton (Wayne County), where people were running like crazy to get out of the storm. I remember the pouring rain and lightning; lightning everywhere.
The next day, our family traveled from our home outside Apple Creek to relatives in Holmesville. Two major bridges along our normal route were simply gone, including the railroad bridge outside of Holmesville. The rail line that ran through many communities in our area was wiped out, and was never rebuilt. It is now a rails-to-trails path.
A very large tractor was ferrying people from inaccessible parts of Holmesville to where we needed to go. We soon discovered that my grandparents' home was completely flooded. They lived on the very edge of the swamps. It was a basement home and they lost everything. The entire extended family spent the rest of the summer building a new home on top of that foundation.
I will never, ever forget the stench of that floodwater. Years afterward that smell lingered in the foundation, and I can still smell it in my mind.
Days after the flood my aunt, siblings and I walked to the site of the missing rail bridge that went over Salt Creek, just north of Holmesville. I was awed and very scared at the thought that this bridge and the road could simply be wiped away by water.
Final thought: The water, mess and muck left behind was a public health hazard. Someone (Red Cross?) organized free tetanus shots for the public at the Holmes County Courthouse. Because our family was literally knee-deep in the cleanup, we went. I remember the long, long lines of people...and I will never, ever, forget the flood of '69.”
References
Amster, Shirely. (2019). [online] Spc.noaa.gov. Available at: https://www.spc.noaa.gov/misc/AbtDerechos/casepages/69jul04_boating_whole.png. Accessed 1 July 2019.
Schmidlin, Thomas W., and Jeanne Appelhans Schmidlin. Thunder in the Heartland: a Chronicle of Outstanding Weather Events in Ohio. Kent State University Press, 2011. 211-214. Print.
The Ohio Fireworks Derecho, www.spc.noaa.gov/misc/AbtDerechos/casepages/jul41969page.htm. Accessed 1 July 2019.
US Department of Commerce, and Noaa. “Derecho.” National Weather Service, NOAA's National Weather Service, 5 June 2015, www.weather.gov/lmk/derecho. Accessed 1 July 2019.
“ABOUT DERECHOS.” Facts About Derechos - Very Damaging Windstorms, www.spc.noaa.gov/misc/AbtDerechos/derechofacts.htm#flashfloods. Accessed 1 July 2019.
“Collections.” NOAA Central Library, https://library.noaa.gov/Collections/Digital-Collections/US-Daily-Weather-Maps. Accessed 1 July 2019.
“Tornado Tracks Tool.” MRCC, https://mrcc.illinois.edu/gismaps/cntytorn.htm. Accessed 1 July 2019.
“Toledo Blade.” Google News Archive Search, Google, https://news.google.com/newspapers?nid=8_tS2Vw13FcC&dat=19690705&printsec=frontpage&hl=en. Accessed 1 July 2019.
“Youngstown Vindicator.” Google News Archive Search, Google, https://news.google.com/newspapers?nid=pqgf-8x9CmQC&dat=19690705&printsec=frontpage&hl=en. Accessed 1 July 2019.

