Rain, Rain, Go Away |
Spring 2011 |
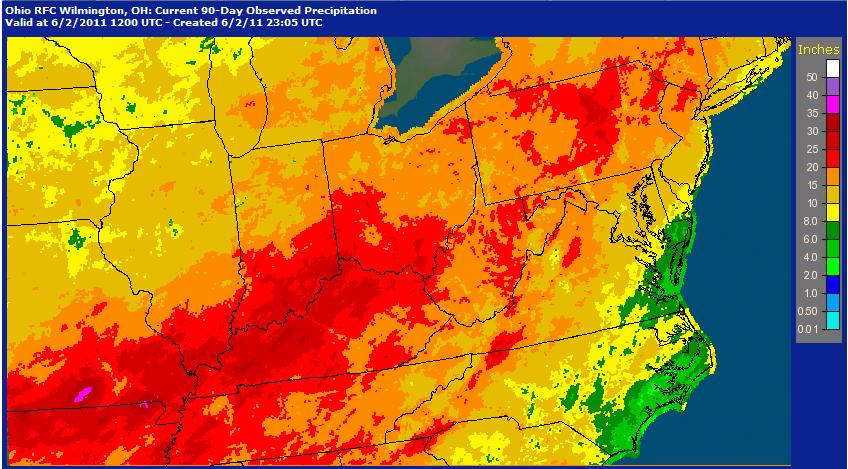
Precipitation across the Ohio valley from the 90 days preceding 6/2/11
March, April, May
|
|
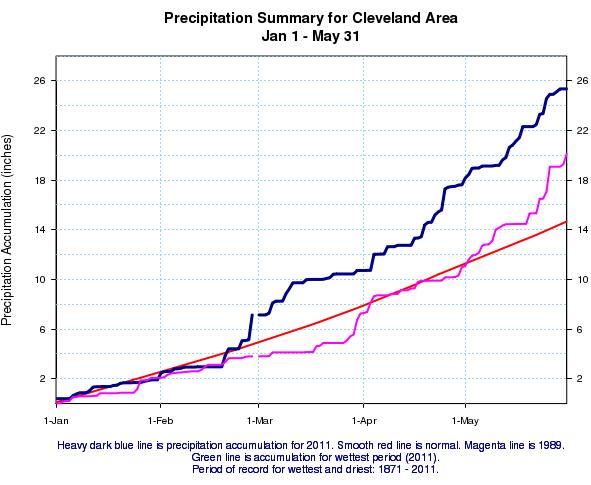
CLEVELAND |
TOLEDO |
MANSFIELD |
AKRON/CANTON |
YOUNGSTOWN |
ERIE, PA |
|
Precipitation (inches) |
18.21 (new record) |
15.30 |
18.41 (new record) |
16.63 |
20.33 (new record) |
19.76 (new record) |
|
Number of inches above normal |
+8.40 |
+6.30 |
+6.46 |
+6.13 |
+10.50 |
+9.91 |
 |
Spring: Top Ten Wettest (Year/Inches)
|
||||||||||||||||||||||||||||||||||||||||||||||||||||||||||||||||
Spring: Top Ten Wettest (Year/Inches)
|
Spring: Top Ten Wettest (Year/Inches)
|
Spring: Top Ten Wettest (Year/Inches)
|
|||||||||||||||||||||||||||||||||||||||||||||||||||||||||||||||
|
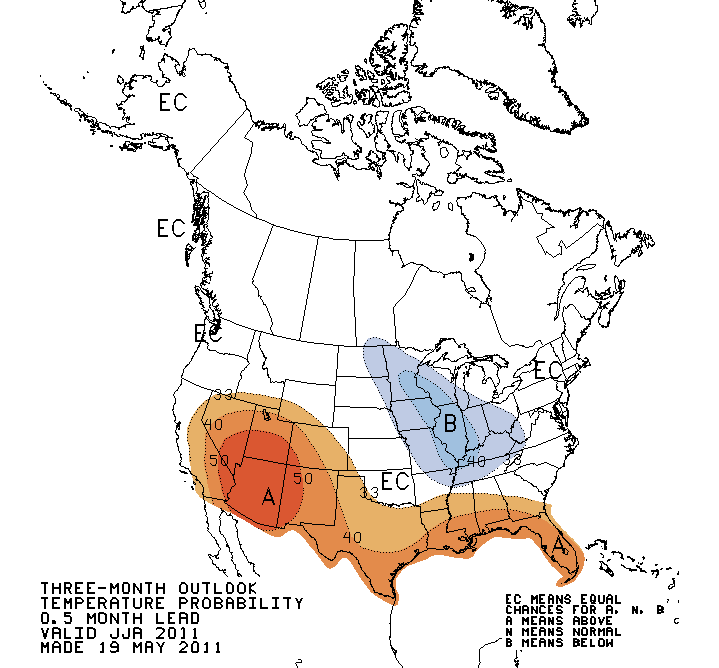
For the most part, the area has equal chances of being above, below, or near normal this summer. The rest of the midwest has a better chance of being below normal while the desert southwest and the south are expected to have a better chance of above normal temperatures. |
|||||||||||||||||||||||||||||||||||||||||||||||||||||||||||||||||
|
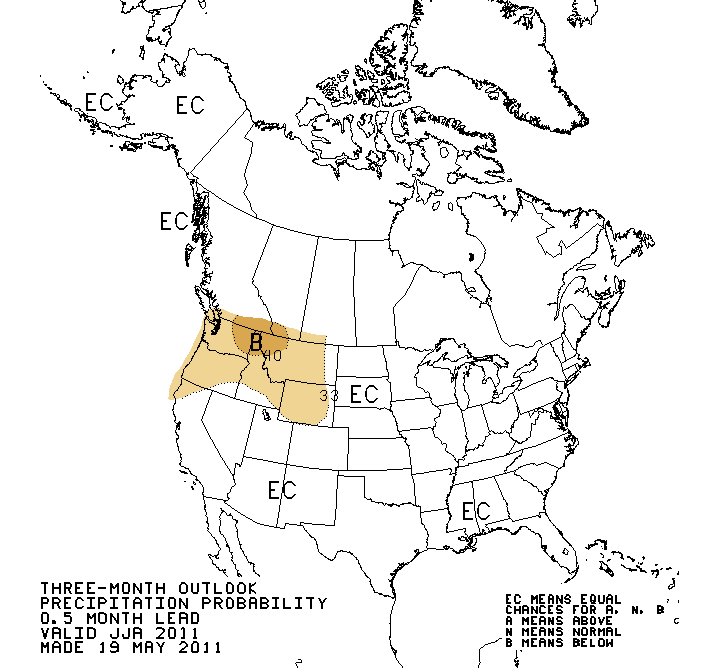
There are no strong signals that point significantly one way or another. Much of the country has equal chances at being above, below, or near normal in precipitation this summer. |
|||||||||||||||||||||||||||||||||||||||||||||||||||||||||||||||||