Overview
|
A powerful and long-lived complex of thunderstorms called a derecho developed over northern Indiana during the early afternoon hours of June 29, 2012. This line of storms intensified as it moved across Central Ohio later in the afternoon before tracking across the Appalachians and through the densely populated Mid-Atlantic region. Extensive damage was reported over far southern parts of the National Weather Service Cleveland county warning area. The worst swath of wind damage occurred in Hancock, Wyandot, Marion, Morrow and Knox Counties. Lesser amounts of damage were reported just to the north of these counties. The damage from this Derecho is comparable to the damage from the remnants of Hurricane Ike in 2008. Hundreds of thousands of people in these counties lost power for as long as a week. Power was not fully restored in Hancock County until July 6th. Thousands of trees and hundreds of utility poles were downed by this line of storms. Hundreds of homes and buildings were damaged by winds estimated to be more than 80 mph. An 84 mph wind gust was measured in Findlay. Automated sensors at area airports failed to record peak gusts because of power outages. Dozens of roads and streets had to be closed because of fallen trees and power lines. Significant crop losses also occurred as the winds flattened corn stalks. Clean up costs were significant from this storm, and the clean up efforts were hampered by an ongoing heat wave with afternoon temperatures as warm as 100 degrees. |
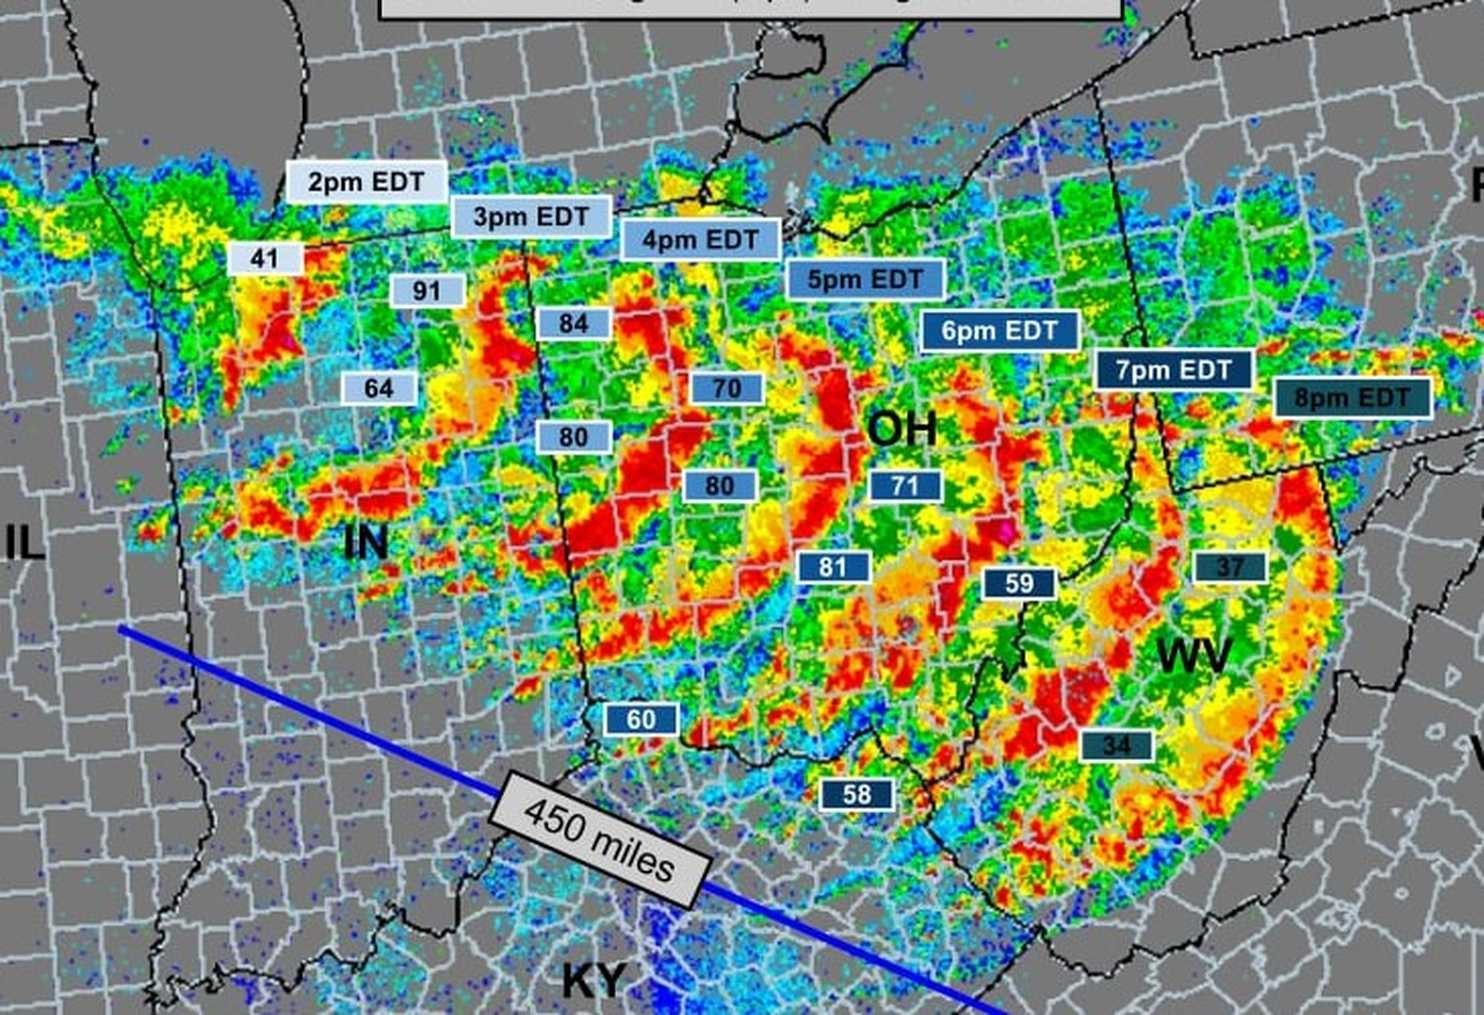 The radar images meshed together above show the progression of the derecho across Ohio and measured wind gusts along its path. Note the gusts of 91 mph in Fort Wayne, Indiana, 84 mph in Findlay, Ohio, and 71 mph in Columbus, Ohio surrounded by numerous other gusts of 70 to 80 mph! |
 |
 |
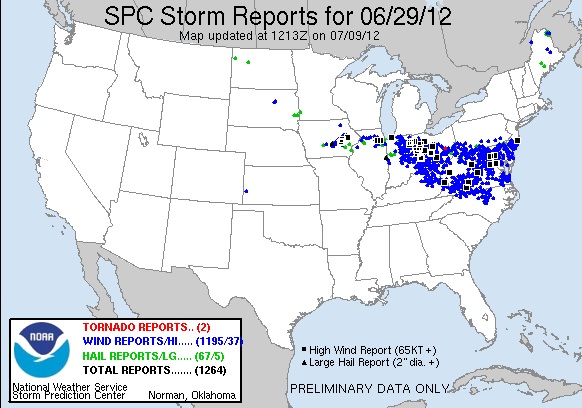 |
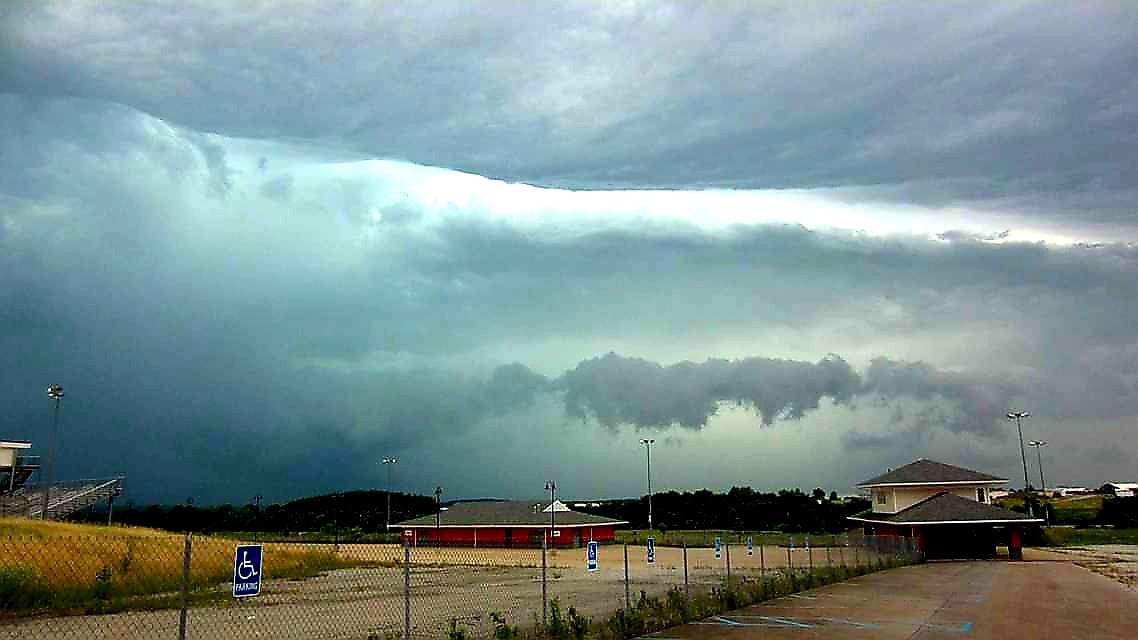
| Shelf cloud approaching Mansfield from Jimmy Baker | Regional radar loop of the derecho progressing from the Chicago area through the Mid-Atlantic | National storm reports map |
What is a Derecho?
A derecho is defined as “A widespread, convectively induced straight-line windstorm, more specifically, any family of downburst clusters produced by an extratropical mesoscale convective system.” (American Meteorological Society, 2014). Furthermore, derechos generally have swaths of damage that extend around 250 to 400 miles in length, around 60 miles in width, and these systems contain 58 mph winds along most of that damage path with a few 75 mph or greater gusts. The definition mentions ‘mesoscale convective systems’ (or MCS), which is a specific type of organized thunderstorm structure. The most familiar type of MCS is a squall line; a line of storms moving quickly. Commonly, derechos occur in a special type of squall line, called a bow echo. Bow echoes are different from traditional squall lines due to the presence of much more intense straight-line winds, which cause the line of storms to bend (giving it the shape of a handheld bow). These storms are often associated with severe wind damage on par with that of tornadoes. More intense straight-line winds lead to more intense bowing segments of storms, which can occasionally bend so much they can produce directionally sufficient wind shear to create tornadic rotation (referred to as bookend vortices).While both bookend vortices can produce tornadoes, the northern end is more favorable due to its cyclonically rotating nature. The June 29, 2012 derecho was a classic bow echo with an intense bookend vortex on the northern end which enhanced the destructive straight line winds. The schematic image below shows the typical evolution of the radar signatures from a single thunderstorm into a bowing line of thunderstorms.
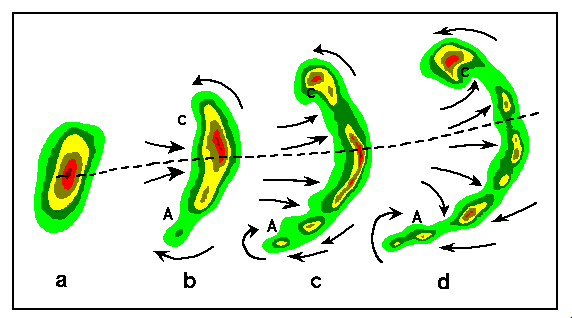
Typical evolution of a thunderstorm radar echo (a) into a bow echo (b,c), and into a comma echo (d). Dashed lines indicate the axis of greatest downburst potential. This bow echo was a feature of the July 4th 1969 derecho and can be seen on a radar image from Akron, Ohio as one of the first bow echoes recorded. Arrows indicate storm-relative winds. Regions of cyclonic rotation (C) and anticyclonic rotation (A) are both capable of supporting tornado development (especially C). (Source: National Weather Service page on Bow Echo development).
How Common Are Derechos in Northern Ohio?
Most derecho events occur during the warm season from late Spring through mid Summer, with 63% occurring from May through July as seen below.
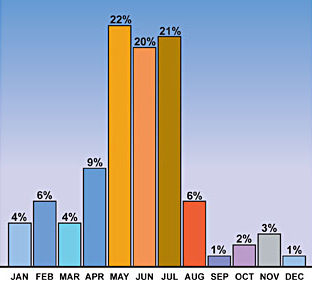
Image showing the seasonality of derecho events within the United States. (Source: Storm Prediction Center and Dennis Cain).
Research by the Storm Prediction Center and Dennis Cain shown below suggests that much of the central and eastern United States averages one derecho every two years, but a wide area from the lower Mississippi Valley through the Ohio Valley and southern Great Lakes averages one derecho every year. This “Derecho Alley” makes these events somewhat more common than one would expect, including in northern Ohio.
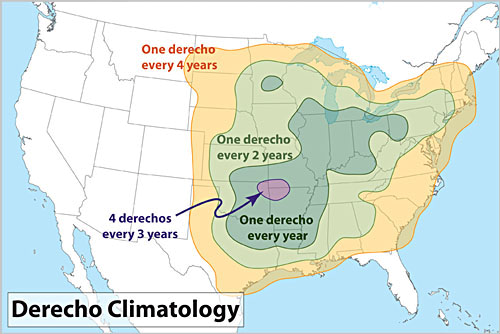
Image showing the climatology of derechos within the United States. (Source: Storm Prediction Center and Dennis Cain).
Types of Derechos
(credit NOAA/Storm Prediction Center Facts About Derechos: https://www.spc.noaa.gov/misc/AbtDerechos/derechofacts.htm)
There are two primary types of derecho events; the progressive derecho and the serial derecho.
The type of derecho most often encountered during the spring and fall is called a serial derecho. These are produced by multiple bow echoes embedded in an extensive squall line (typically many hundreds of miles long) that sweeps across a very large area, both wide and long. This type of derecho typically is associated with a strong, migratory low pressure system with strong low-to mid-tropospheric flow. An example of a serial derecho with a very extensive squall line and embedded smaller scale bow echoes is the one that affected Florida, Cuba, and adjacent parts of the Gulf of America, the Caribbean Sea, and the Atlantic Ocean during the early stages of the "Storm of the Century" on March 12-13, 1993.
The second type of derecho is called a progressive derecho. These are associated with a relatively short line of thunderstorms (typically from 40 miles to 250 miles in length) that may at times take the shape of a single bow echo, particularly in the early stages of development. In some cases, the width of a progressive derecho and its associated bow echo system remain relatively narrow even though they may travel for hundreds of miles. An example of this type is the "Boundary Waters-Canadian Derecho" that occurred on July 4-5, 1999. In other cases, the progressive derecho and associated bow echo system begin relatively small, with a narrow path, but over time grow to exceed 250 miles in width. The line of thunderstorms of a progressive derecho often begins as a single bow echo that evolves into a short squall line, typically with more than one embedded bowing segment. Such development occurred with the "I-94 Derecho" over the north-central United States on July 19, 1983. Progressive derechos may travel for many hundreds of miles along paths that are relatively narrow compared to those of serial derechos. They sometimes are associated with an area of weak low pressure at the surface. However, the low-to mid-tropospheric flow in the neighborhood of progressive systems typically is not strong, suggesting that, in contrast to serial-type events, the intense surface winds observed result more from storm-induced downdrafts than from the downward transfer of fast mid-tropospheric flow.
Below are schematic diagrams showing the meteorological conditions favorable for spring and fall serial derechos vs summer progressive derechos.
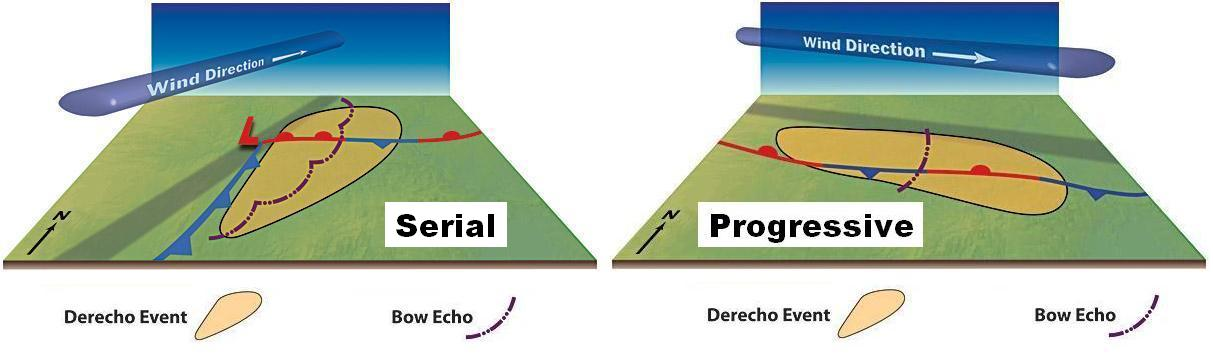
Image modified from illustration by Dennis Cain
The derecho that impacted our region on June 29, 2012 was a classic progressive derecho that tracked along the northern fringe of a large-scale heat wave centered over the Midwest and eastern United States.
Derecho Events Related to Heat Waves
(credit NOAA/Storm Prediction Center Facts About Derechos: https://www.spc.noaa.gov/misc/AbtDerechos/derechofacts.htm#types)
Some of the most intense summer derechos, especially those of the progressive type (see below), occur on the fringes of major heat waves. Examples include the July 1983 "I-94" derecho in the upper Mississippi Valley, the Mid-July 1995 derechos in New York and Canada, and the more recent Ohio Valley / Mid-Atlantic derecho of June 2012. The relationship is more than statistical. It turns out that the meteorological conditions favorable for large-scale heat waves often also are conducive to derechos. In the United States, this is especially true from the Upper Mississippi Valley and Upper Great Lakes into the Ohio Valley and Northeast.
The primary link between heat waves and derechos is the presence of an elevated mixed layer, or EML. An EML is a layer of mid-tropospheric air that originates over the arid, elevated terrain. Because of their origin, EMLs exhibit sharp decreases in temperature with height. The large vertical temperature differentials (or "steep" lapse rates) in EMLs are analogous to those observed over black-topped roofs and parking lots on sunny days. Such thermal stratification encourages the formation of strong updrafts that can lead to the development of thunderstorms. In fact, the frequent presence of an EML on days otherwise favorable for thunderstorm formation to a large extent accounts for the intensity of the storms commonly encountered over the Great Plains.
During a typical heat wave over the central and eastern United States, a large, stationary upper-level high pressure area usually is present over the south-central states. Persistent westerly winds on the poleward side of the high allow EMLs generated over the Rocky Mountains to extend eastward into the Ohio Valley and Northeast, well beyond their usual range over the Plains. Warm air aloft associated with the base of the EML acts as a "cap" or "lid" that prohibits thunderstorm development along much of the extent of the EML, southward into the heat wave-associated "high." But on the northern fringe of the EML, where low-level uplift frequently is focused along a stationary front marking the northern edge of the heat wave, updrafts that form in the strongly heated air near the ground may breach the cap, resulting in an explosive release of instability. If other conditions are favorable (e.g., low-level moisture is abundant along the front, winds are largely unidirectional, parallel to it, and increase with height), additional storms may erupt in concentrated fashion along the boundary, yielding a band of downstream-developing storms and, on occasion, a full-blown derecho.
The illustration below illustrates the idealized, large-scale meteorological environment favorable for progressive derechos on the northern fringe of a quasi-stationary high pressure cell associated with a major heat wave over central and eastern United States. The location of the EML in such situations is approximated by the brown-tinted band behind the word "Progressive," with the mean mid-tropospheric flow depicted by the arrow marked "Airflow," and the high pressure center by an "H." The region most susceptible to serial-type derechos in such a pattern also is shown.
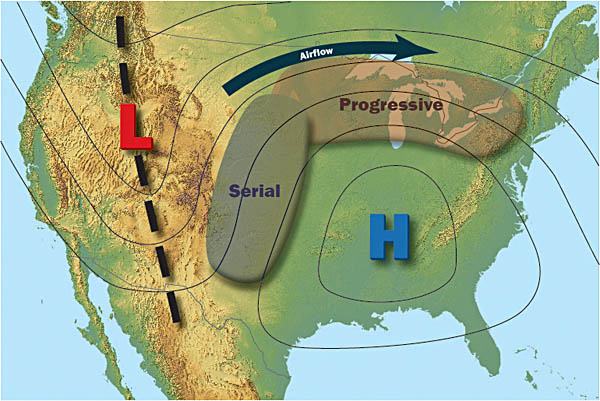
Illustration by Dennis Cain
Heat Wave of 2012
Widespread 95-105 degree heat
When the June 29, 2012 derecho impacted northern Ohio, an intense heat wave had been affecting our region as well as the entire southern Plains, Ohio Valley, and Southeast for several days prior. On June 29th, several sites, including Charlotte, Nashville, and Raleigh tied or set all-time June maximum temperature records (with readings of 104, 109, and 105 (°F), respectively). A high of 104 in Washington D.C was the hottest ever observed in June in 142 years of record. This derecho developed and tracked along a stationary east-west frontal boundary that stretched from Iowa through central Ohio to the Mid Atlantic on the northern fringe of the heat wave. This boundary marked the northern edge of the EML where explosive amounts of instability and moderately strong low to mid tropospheric flow oriented parallel to the front provided a very favorable pattern for a progressive derecho event to move through the region.
The 500 mb height composite mean and surface temperature composite anomalies for June 29-30, 2012 shown below clearly show the broad area of above normal heights and extreme heat from the Midwest through the Ohio Valley and Mid-Atlantic to the north of a stationary mid/upper level high centered over the southern United States. The broad westerly flow to the north of the high advected a stout EML from the Rockies through the Midwest, Ohio Valley, and Mid-Atlantic providing a long corridor of explosive instability on the northern fringe of the high height anomalies and corresponding heat wave where the stationary front was stretched out.
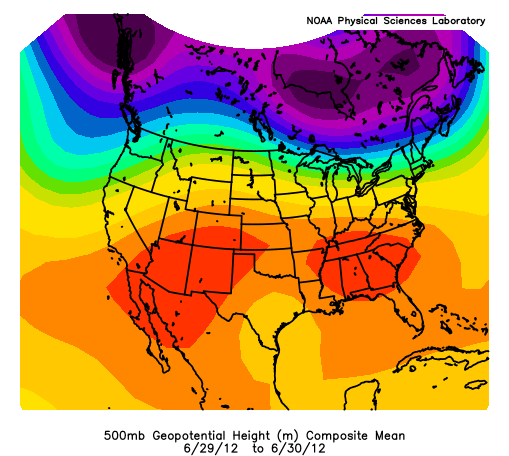
Image from NCEP/NCAR Reanalysis
Image from NCEP/NCAR Reanalysis
The national watch, warning, and advisory map from NOAA/NWS on June 29, 2012 showed the huge expanse of excessive heat advisories and warnings from the central and southern Plains through the Midwest, Ohio Valley, and Mid-Atlantic as seen below. This is another way to visualize the scope and intensity of the heat wave and the large corridor of fuel that the derecho had to work with on the northern fringe of the heat wave.

Image from NOAA/NWS
The regional radar loop with surface temperatures overlaid shown below show the development and progression of the derecho on the northern edge of a wide area of temperatures in the upper 90s to low 100s and dew points in the upper 60s to low 70s. Temperatures in central and southern Ohio were near 100 degrees when the derecho approached with dew points around 70, while temperatures to the north of the stationary front over northern Ohio were in the mid 90s with dew points in the mid to upper 60s.
Image from the IWX page on the June 29, 2012 derecho
Photos & Video
 |
 |
|
.jpg) |
| Trees down in Findlay (From multi-office StoryMap project) |
More down trees in Findlay (UB Central) |
Shelf cloud in Mansfield as the derecho approached (Jimmy Baker) |
Large tree down in Findlay (David Flick) |
 |
 |
 |
 |
| Extensive damage in Findlay (David Flick) |
S Main street in Findlay (Shannon Renee) |
Hancock County Fairgrounds (Shannon Renee) |
Putnam Street in Findlay (Shannon Renee) |
 |
 |
 |
 |
| Western Avenue in Findlay (Shannon Renee) |
Huge tree down in Findlay (David Flick) |
Trees and wires down in Findlay (David Flick) |
Uprooted pine tree in Findlay (David Flick) |
Radar Analysis
Presentation slides of MARC signature
The images below analyze a mid altitude radial convergence (MARC) signature and cross sections of radial velocity and radar reflectivity.
.jpg) |
.jpg) |
 |
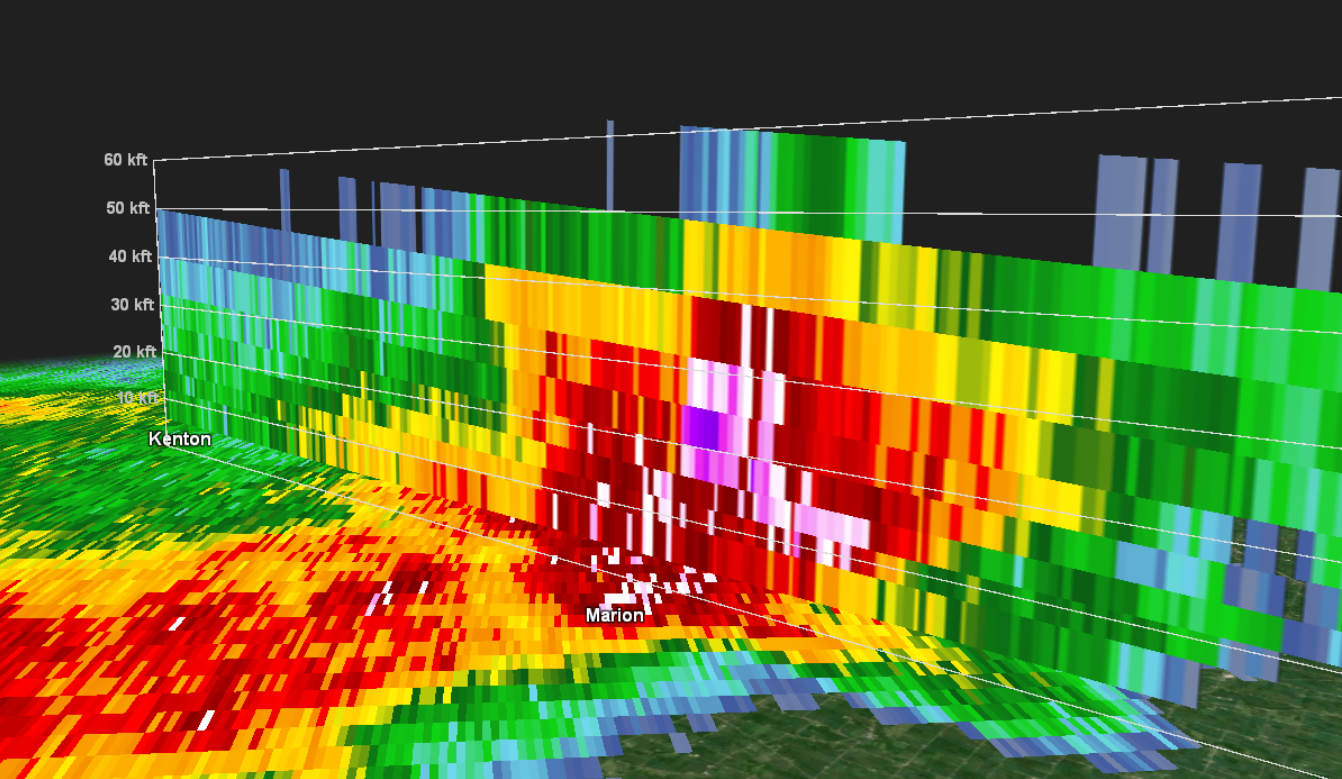 |
| Displayed is radar reflectivity (left) and radial velocity (right) on the 0.9 deg slice from the KCLE WSR-88D at 4:23 PM June 29, 2012. In the velocity, the outbounds and inbounds converge into each other in the mid-levels. This is known as the mid-altitude radial convergence (MARC) signature, which can indicate strong surface winds within a squall line. Typically a 50 kts measurement of a MARC can signify severe winds, and in this case a 70 kts MARC was measured. | Displayed is a vertical cross section of the radial velocity from the KCLE WSR-88D at 4:22 PM on June 29, 2012. Arrows depict the descending rear inflow jet (left) and the ascending updraft (right), both of which were responsible for the intense winds in the Findlay area. | Displayed is a cross section of radar reflectivity from the KCLE WSR-88D from 4:00 PM to 4:31 PM on June 29, 2012. The development of a strong core aloft and the soon after descent of that core resulted in a particularly intense area of winds up to 80 mph in the Findlay area. | Displayed is a cross section of radar reflectivity from the KCLE WSR-88D from about 4:30 PM on June 29, 2012 depicting 60 dBZ echoes up to about 35,000 feet above ground level near Marion. This indicates a significant hail core over the Marion area in addition to the destructive straight line winds. Indeed, golf ball sized hail was reported near Marion. |
Storm Reports
PRELIMINARY LOCAL STORM REPORT...SUMMARY
NATIONAL WEATHER SERVICE CLEVELAND OH
949 PM EDT FRI JUN 29 2012

..TIME...   ...EVENT...      ...CITY LOCATION...     ...LAT.LON...
..DATE...   ....MAG....      ..COUNTY LOCATION..ST.. ...SOURCE....
            ..REMARKS..

0410 PM     TSTM WND DMG     MCCOMB                  41.11N 83.79W
06/29/2012                   HANCOCK            OH   TRAINED SPOTTER

            8-10 INCH TREE DOWN.

0415 PM     TSTM WND DMG     JENERA                  40.90N 83.73W
06/29/2012                   HANCOCK            OH   PUBLIC

            TREES DOWN.

0415 PM     TSTM WND DMG     FINDLAY                 41.04N 83.64W
06/29/2012                   HANCOCK            OH   TRAINED SPOTTER

            NUMEROUS TREES DOWN.

0415 PM     TSTM WND DMG     FINDLAY                 41.04N 83.64W
06/29/2012                   HANCOCK            OH   EMERGENCY MNGR

            STURCTURES DAMAGED IN FINDLAY WITH ROOFS BLOWN OFF.

0415 PM     TSTM WND GST     FINDLAY                 41.04N 83.64W
06/29/2012  U70.00 MPH       HANCOCK            OH   BROADCAST MEDIA

            PENNY HAIL.

0415 PM     TSTM WND DMG     7 S FINDLAY             40.94N 83.64W
06/29/2012                   HANCOCK            OH   TRAINED SPOTTER

            TREES DOWN. BARN BLOWN OVER.

0420 PM     TSTM WND DMG     FINDLAY                 41.04N 83.64W
06/29/2012                   HANCOCK            OH   BROADCAST MEDIA

            4 OR 5 SEMI TRUCKS BLOWN OVER ON I-75 BETWEEN FINDLAY AND
            BLUFFTON. TREES DOWN.

0425 PM     TSTM WND GST     FINDLAY                 41.04N 83.64W
06/29/2012  M84.00 MPH       HANCOCK            OH   TRAINED SPOTTER

0425 PM     TSTM WND DMG     2 SW KIRBY              40.79N 83.45W
06/29/2012                   WYANDOT            OH   TRAINED SPOTTER

            DAMAGE OCCURRED ACROSS MUCH OF JACKSON TOWNSHIP IN
            SOUTHWEST WYANDOT COUNTY. THE ROOF WAS BLOWN OFF OF A
            COUPLE OF BARNS. ROOF SHINGLES AND SHEET METAL WAS BLOWN
            OFF SEVERAL BARNS AND HOUSES. NUMEROUS TREES WERE DOWNED.
            POWER LINES AND UTILITY POLES WERE DOWNED AS WERE SOME
            FENCES AND SIGNS.

0435 PM     TSTM WND DMG     6 WNW MARION            40.62N 83.23W
06/29/2012                   MARION             OH   TRAINED SPOTTER

            SEVERAL TREES AND LIMBS DOWN.

0437 PM     TSTM WND DMG     VANLUE                  40.98N 83.48W
06/29/2012                   HANCOCK            OH   TRAINED SPOTTER

            TREES DOWN.

0440 PM     TSTM WND DMG     4 N MARION              40.64N 83.13W
06/29/2012                   MARION             OH   TRAINED SPOTTER

            SEMI TRUCK ROLLED OVER.

0442 PM     TSTM WND DMG     2 SW MARION             40.56N 83.15W
06/29/2012                   MARION             OH   TRAINED SPOTTER

            TREES DOWNED. SHEET METAL STRIPPED OFF BARNS AND BARN
            ROOF.

0444 PM     TSTM WND DMG     3 SW NEW RIEGEL         41.02N 83.36W
06/29/2012                   SENECA             OH   TRAINED SPOTTER

            NUMEROUS TREES DOWN, NO POWER.

0445 PM     HAIL             3 ESE MARION            40.57N 83.08W
06/29/2012  E1.00 INCH       MARION             OH   TRAINED SPOTTER

0447 PM     HAIL             1 E MARION              40.58N 83.11W
06/29/2012  E1.75 INCH       MARION             OH   TRAINED SPOTTER

0449 PM     HAIL             6 NE MARION             40.65N 83.05W
06/29/2012  E0.88 INCH       MARION             OH   TRAINED SPOTTER

0454 PM     TSTM WND GST     MARION                  40.58N 83.13W
06/29/2012  M62.00 MPH       MARION             OH   DEPT OF HIGHWAYS

            ODOT GARAGE SENSOR.

0456 PM     TSTM WND GST     MOUNT GILEAD            40.55N 82.84W
06/29/2012  E70.00 MPH       MORROW             OH   TRAINED SPOTTER

0500 PM     TSTM WND GST     3 WNW MOUNT GILEAD      40.57N 82.89W
06/29/2012  E80.00 MPH       MORROW             OH   TRAINED SPOTTER

            70-80 MPH ESTIMATED GUST IN EDISON.

0502 PM     TSTM WND DMG     GALION                  40.73N 82.79W
06/29/2012                   CRAWFORD           OH   EMERGENCY MNGR

            WALL OF ATTACHED GARAGE BLOWN OUT/DAMAGED.

0502 PM     TSTM WND DMG     4 SSE MOUNT GILEAD      40.50N 82.81W
06/29/2012                   MORROW             OH   TRAINED SPOTTER

            UTILITY POLES DOWN.

0505 PM     TSTM WND DMG     8 NE MOUNT GILEAD       40.63N 82.73W
06/29/2012                   MORROW             OH   TRAINED SPOTTER

            SIDING OFF OF TWO HOMES.

0510 PM     TSTM WND GST     3 WNW LEXINGTON         40.69N 82.64W
06/29/2012  E60.00 MPH       MORROW             OH   TRAINED SPOTTER

            AT MID OHIO RACE TRACK.

0510 PM     HAIL             3 WNW LEXINGTON         40.69N 82.64W
06/29/2012  E1.75 INCH       MORROW             OH   TRAINED SPOTTER

            GOLF BALL HAIL AT MID OHIO RACE TRACK.

0517 PM     TSTM WND GST     LEXINGTON               40.68N 82.59W
06/29/2012  E65.00 MPH       RICHLAND           OH   TRAINED SPOTTER

0518 PM     TSTM WND GST     LEXINGTON               40.68N 82.59W
06/29/2012  E60.00 MPH       RICHLAND           OH   TRAINED SPOTTER

            LARGE BRANCHES DOWN.

0520 PM     TSTM WND DMG     MOUNT VERNON            40.39N 82.48W
06/29/2012                   KNOX               OH   TRAINED SPOTTER

            TREES DOWN ON MAIN STREET AND A UTILITY POLE DOWN.

0520 PM     TSTM WND DMG     1 E BUTLER              40.59N 82.40W
06/29/2012                   RICHLAND           OH   TRAINED SPOTTER

            10-12 INCH DIAMETER TREE LIMBS DOWN.

0523 PM     TSTM WND DMG     BELLVILLE               40.62N 82.51W
06/29/2012                   RICHLAND           OH   TRAINED SPOTTER

            TREES DOWN.

0547 PM     TSTM WND DMG     7 S MILLERSBURG         40.45N 81.92W
06/29/2012                   HOLMES             OH   TRAINED SPOTTER

            SEVERAL TREES AND LIMBS DOWN IN CLARK.

0547 PM     TSTM WND DMG     1 W LOUDONVILLE         40.63N 82.25W
06/29/2012                   ASHLAND            OH   TRAINED SPOTTER

            MULTIPLE TREES DOWN IN MOHICAN STATE PARK.
Environment
Synoptic Analysis
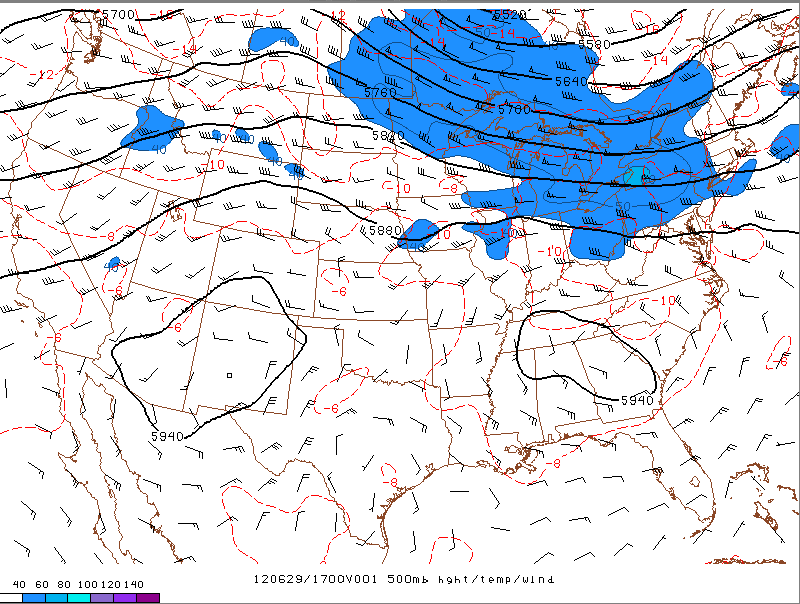
The 500 mb analysis at 17Z (1 PM EDT) on June 29, 2012 seen in Figure 1 shows the mid/upper ridge responsible for the heat wave very clearly. A closed 594 DM high is centered over the Tennessee Valley and Deep South with 588 DM heights arcing from the Midwest through Ohio and into the Mid-Atlantic. Seasonably strong 50-60 knot 500 mb winds are cresting the broad ridge, with these winds oriented from the WNW from Indiana and Ohio through the Mid-Atlantic, supporting ESE propagation of a convective complex.
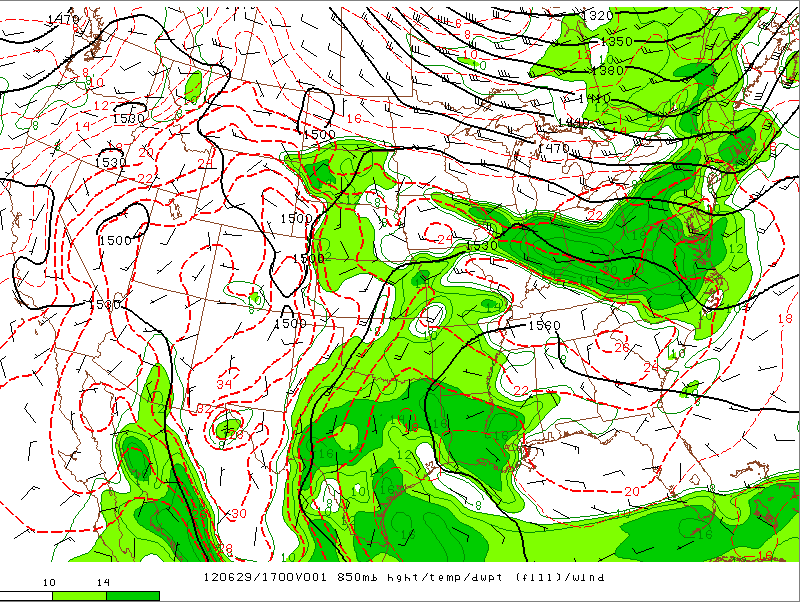
The 850 mb analysis at 17Z (1PM EDT) seen in Figure 2 shows the extreme heat beneath the core of the mid/upper ridge characterized by 850 mb temperatures of 24-26 C over a broad area from the heart of the Midwest through southern Ohio, the Tennessee Valley, and Deep South. The stationary front can also be seen in this analysis because 850 mb temperatures decrease north of the boundary into the 22-24 C range from northern Illinois through northern Ohio. An even more distinct way to locate the frontal boundary is by the broad swath of 850 mb dew point pooling from eastern Iowa through southern Ohio and into the Mid-Atlantic. This 850 mb temperature and moisture gradient marking the location of the east-west stationary front was right on the periphery of the EML, so explosive instability capped below the EML could undergo enhanced lifting along the front, and this enhanced lifting could continue downstream, essentially following the front and associated temperature and moisture gradient from northern Indiana through northwest and north central Ohio all the way into the Mid-Atlantic.
Another way to visualize the path of the derecho along the frontal boundary was through the deep layer moisture flux convergence seen in Figure 3. At 17Z (1 PM EDT), the moisture contours were tightly packed from northern Indiana through central and southern Ohio to the Mid-Atlantic, which nicely represented the track of the derecho through the southern portion of the WFO Cleveland county warning area from Findlay through Marion and Mount Vernon, then ESE across the Appalachians and into the Mid-Atlantic.
 |
 |
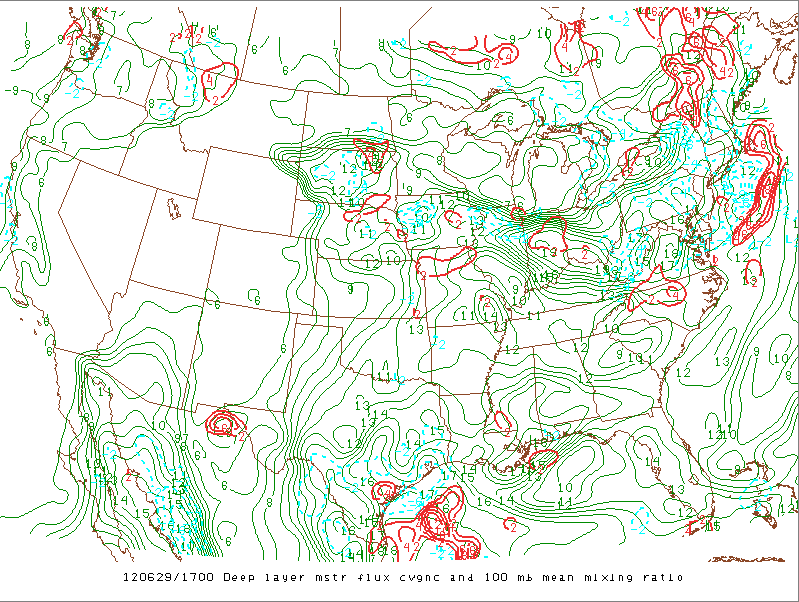 |
| Figure 1: 500 mb height/temp/wind | Figure 2: 850 mb height/temp/dew point | Figure 3: Deep layer moisture flux convergence and 100 mb mean mixing ratio |
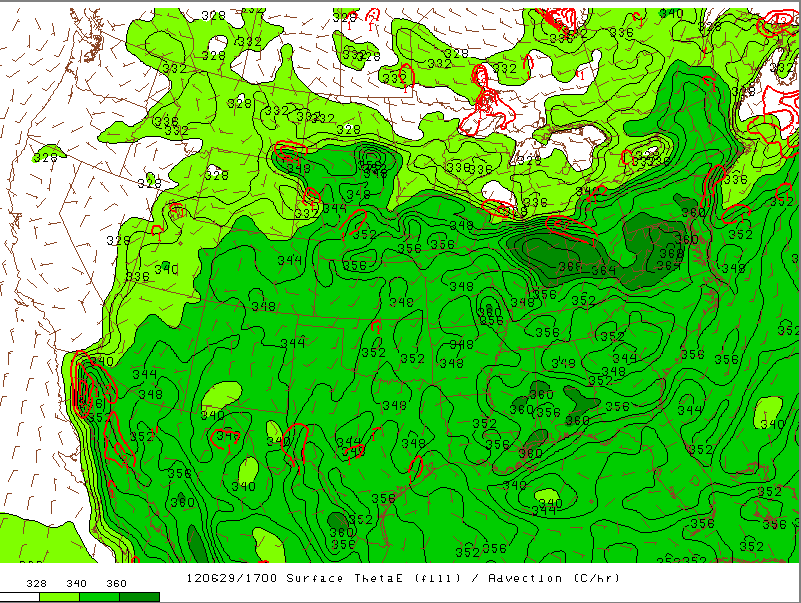
Derechos like to track along a sharp gradient of equivalent potential temperature (Theta E). The Theta E gradient usually overlays the lower level temperature and moisture gradient on the periphery of the EML, and as we can see on the 17Z surface Theta E advection plot in Figure 4, this gradient is in roughly the same orientation and location as the temperature and moisture gradient/EML periphery from eastern Iowa through central and southern Ohio and into the Mid-Atlantic, so one can visualize the derecho following this path.
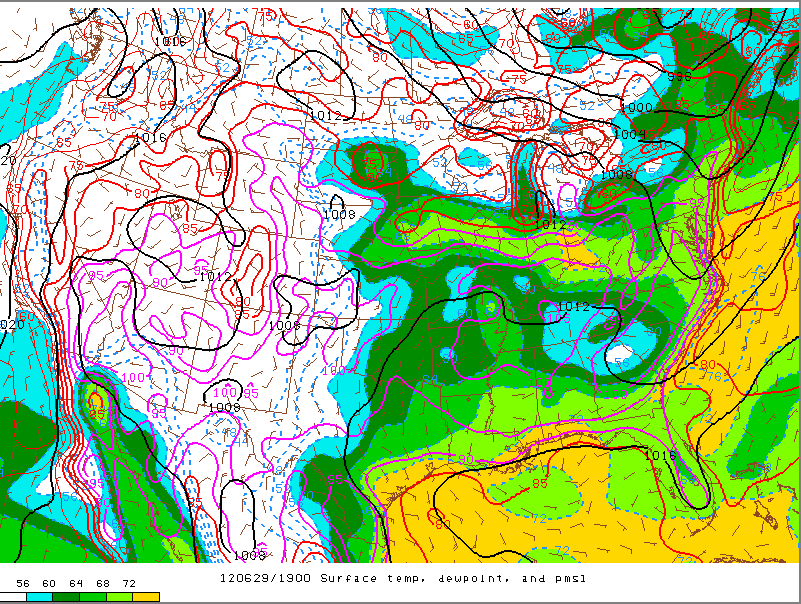
Massive amounts of heat and moisture were in place ahead of the derecho. Figure 5 shows that at 19Z (3PM EDT), surface temperatures were in the mid 90s F north of the front across northern Ohio and in the 95 to 105 F range south of the front from central and southern Ohio through the Tennessee Valley, Appalachians, and Mid-Atlantic as seen in the pink contours. Surface dew points were significantly pooling along the frontal boundary with low to mid 70s F dew points from eastern Iowa through central and southern Ohio and into the Mid-Atlantic, while dew points north of the front were in the mid 60s F from northern Illinois into northern Ohio as seen in the shaded areas. This is another reason why the derecho only affected the far southern portion of the WFO Cleveland county warning area from Findlay to Marion and Mount Vernon.
 |
 |
|
| Figure 4: Surface theta e advection | Figure 5: Surface temp/dew point/pmsl |
Mesoscale Analysis
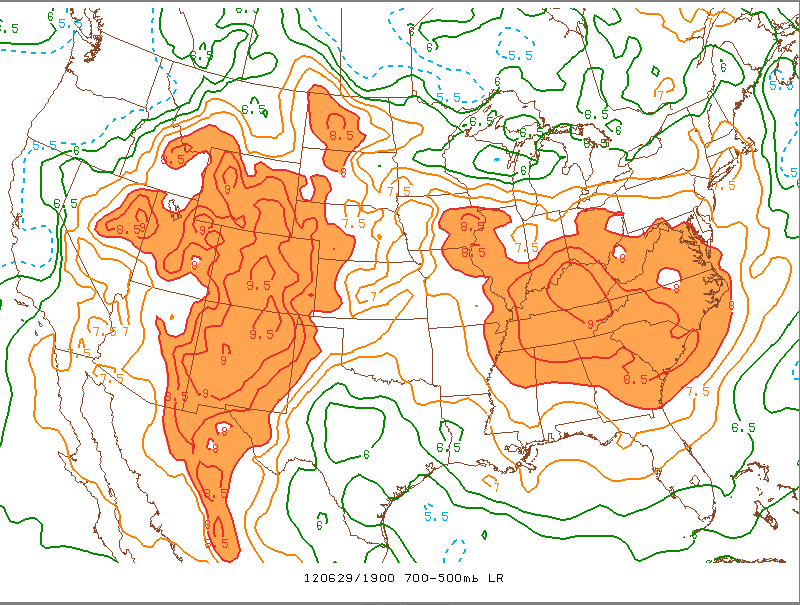
The presence of the EML which originated over the arid terrain of the desert SW, carried east by the broad mid/upper westerly flow north of the 500 mb high, is evident by analyzing the mid-level lapse rates at 19Z on June 29, 2012 seen in Figure 6. A huge area from the Midwest through Ohio and into the Mid Atlantic has very steep mid-level lapse rates of 7.5 to 8 C/Km with even pockets of 8 to 9 C/Km. This is more common over the Great Plains and supports unusually intense updrafts within convection.
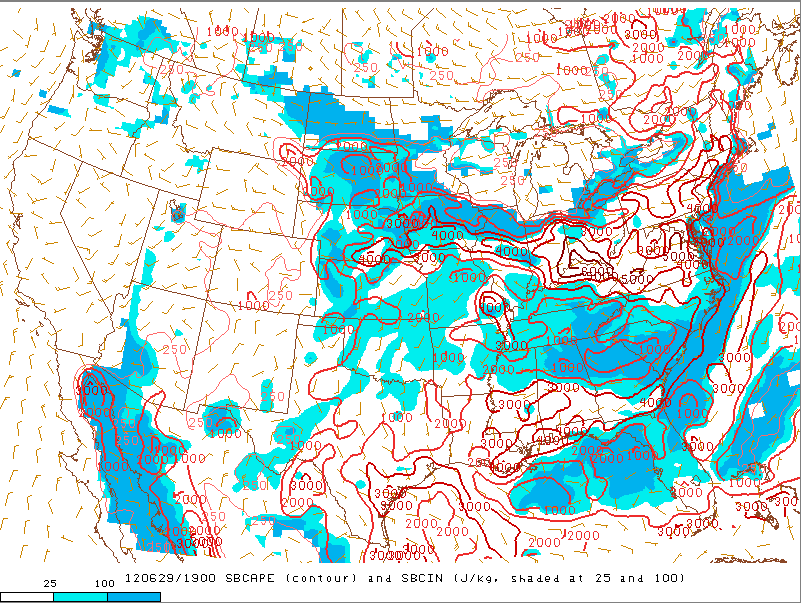
The intense heat and high dew points beneath these very steep mid-level lapse rates led to tremendous instability. Surface based CAPE values at 19Z seen in Figure 7 were 4000 to 6000 J/Kg along the temperature and moisture gradient from Iowa through central and southern Ohio into the Mid-Atlantic, with even 3000-4000 J/Kg north of the stationary front in northern Ohio.
Mixed layer CAPE values at 19Z seen in Figure 8 were equally as impressive with values of 4000-6000 J/Kg over a long corridor from Iowa through central and southern Ohio into the Mid-Atlantic, with values even exceeding 4000 J/Kg in northern Ohio. This supported intense updrafts along the path of the derecho right through southern portions of the WFO Cleveland county warning area all the way to the Mid-Atlantic coast.
 |
 |
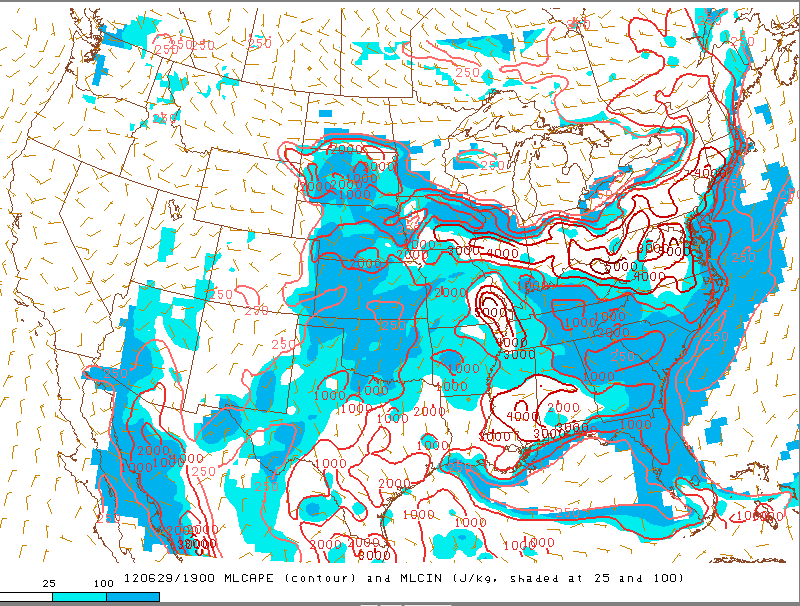 |
| Figure 6: 700-500 mb lapse rate | Figure 7: Surface based CAPE and CIN | Figure 8: Mixed layer CAPE and CIN |
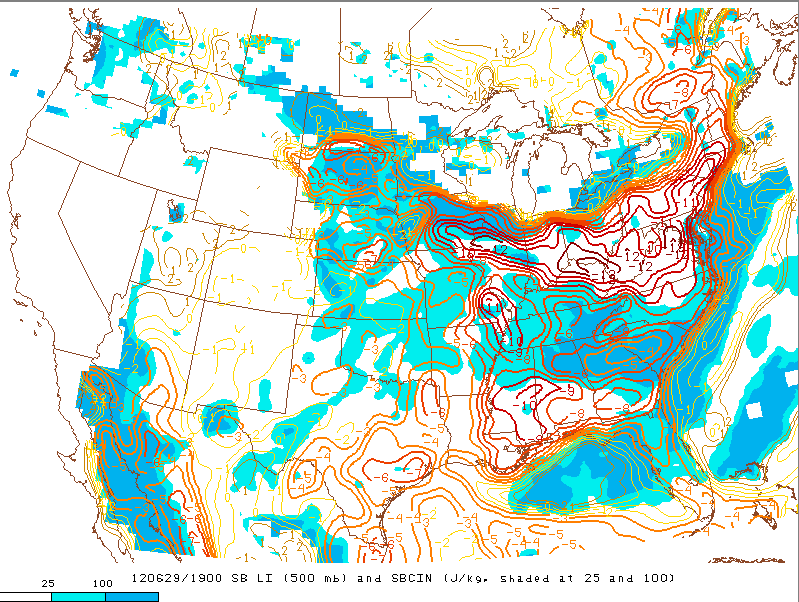
Lift along the temperature/moisture/instability gradient was extremely high with surface based lifted indices of -12 to -15 from Iowa through central and southern Ohio and into the Mid-Atlantic at 19Z as seen in Figure 9 which indicates how extreme and volatile the thermodynamic air mass was along the path of the derecho.
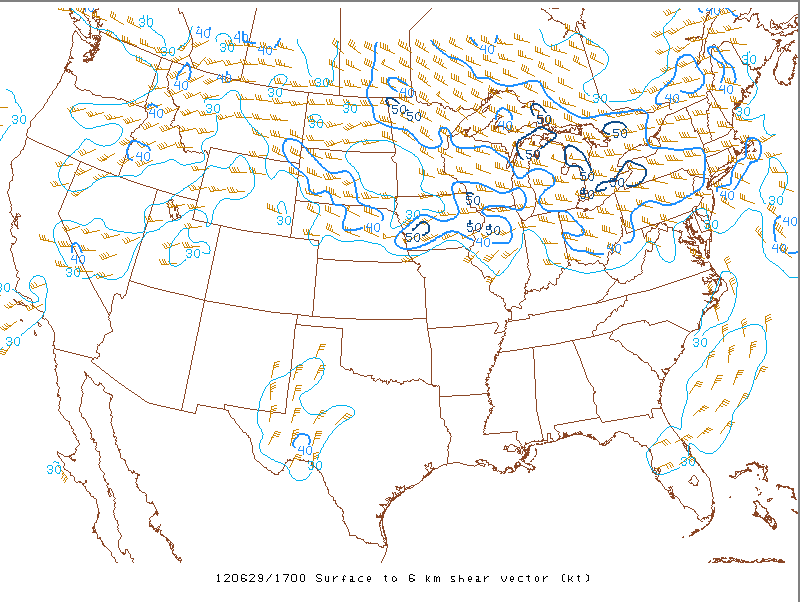
To go along with the extreme instability, deep layer shear at 17Z was moderately strong as seen in Figure 10 with 0-6 Km shear of 40-50 knots from northern Illinois through much of Ohio and 30-40 knots over the Mid-Atlantic. These shear values and the WNW to ESE orientation of the shear vectors supported a long-lived MCS and possible derecho propagating from the Chicago area to Washington D.C. This track is right through southern parts of the WFO Cleveland county warning area. Besides the long-lived forward propagation, deep layer shear of this magnitude support widespread damaging wind potential.
Effective shear at 17Z was equally as impressive as seen in Figure 11 with values of 40-50 knots oriented WNW to ESE over the same long corridor from Iowa through northern Ohio into the Mid-Atlantic, supporting a long-lived MCS with widespread damaging winds, especially considering how this shear magnitude and orientation interacts with the extreme instability.
 |
 |
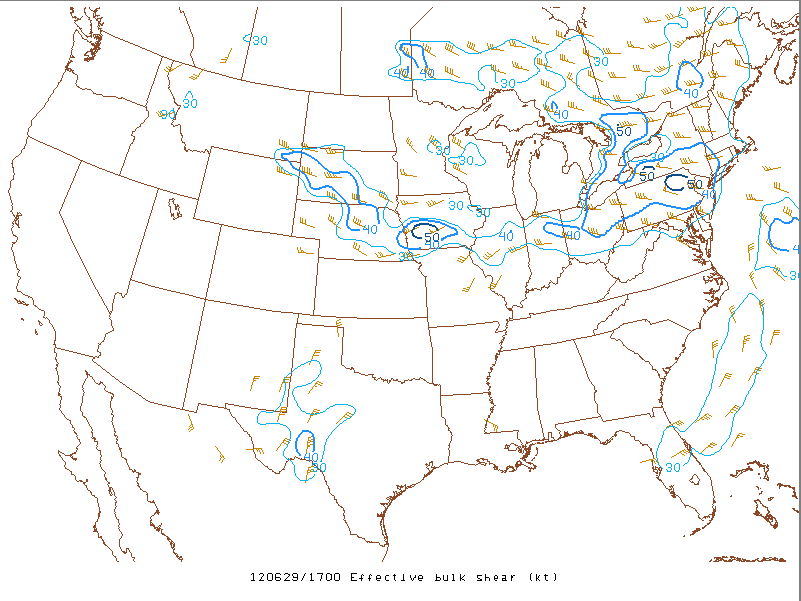 |
| Figure 9: Surface based lifted index and CIN | Figure 10: 0-6 Km shear | Figure 11: Effective Shear |
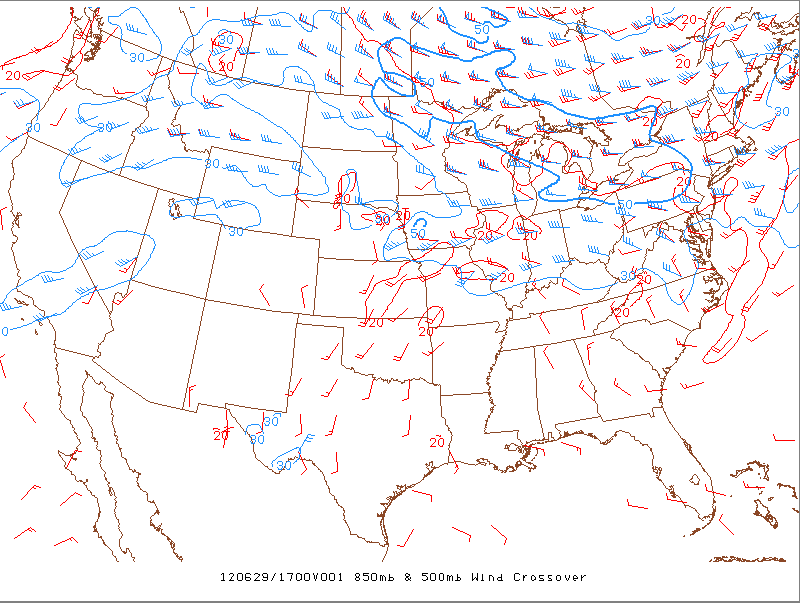
The shear vectors were also unidirectional, meaning that they exhibited very little turning with height and were oriented from a uniform direction through the atmosphere. This can be seen by looking at the 850 and 500 mb Wind Crossover at 17Z in Figure 12 which shows uniform WNW to ESE oriented flow through the column from the Midwest through the Ohio Valley and Mid-Atlantic. This is also parallel to the orientation of the stationary front. Many derecho events occur in these unidirectional shear, northwesterly flow patterns where the shear parallels a quasi-stationary frontal boundary, so this June 29, 2012 event was textbook.
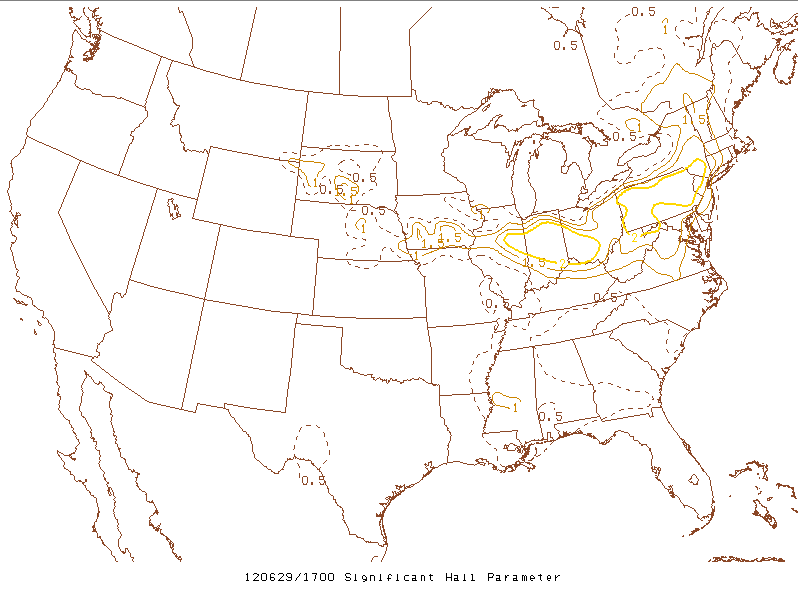
Besides the widespread damaging winds, the very steep mid-level lapse rates were also favorable for pockets of large hail. There were reports of golf ball sized hail in Marion, Ohio, and this is not surprising since the significant hail parameter at 17Z had values of 2.5 or greater nosing into north central Ohio as seen in Figure 13. Any values greater than 1 can support decent hail production. This hail core pulled down even stronger winds leading to winds over 80 mph in Marion, so wind driven hail added to the destruction.
The combination of extreme instability and moderate to strong wind shear over such a long corridor led to high probabilities of MCS maintenance. The MCS Maintenance Parameter at 18Z seen in Figure 14 had values of 90% or higher from Indiana through all of Ohio through the Mid-Atlantic, which is the highest probability that can ever be seen.
 |
 |
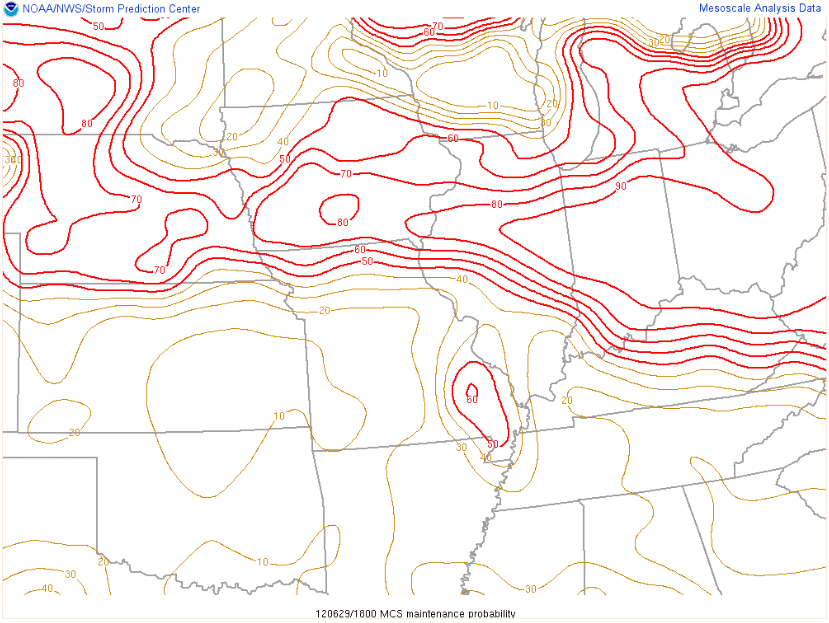 |
| Figure 12: 850 and 500 mb Wind Crossover | Figure 13: Significant Hail Parameter | Figure 14: MCS Maintenance Probability |
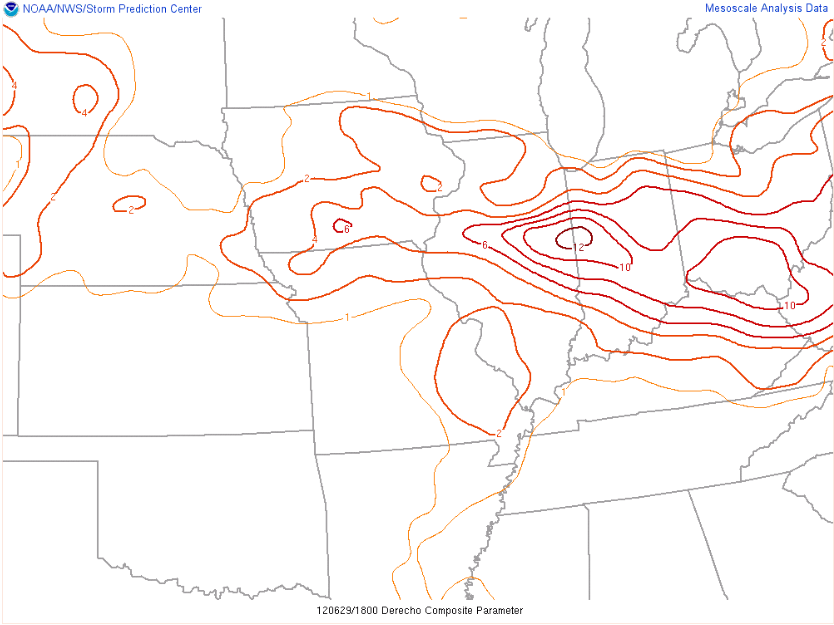
Not surprisingly, the Derecho Composite Parameter at 18Z was also extreme, showing values of 10-12 that afternoon from Indiana through central and southern Ohio as seen in Figure 15. Values greater than 4 usually signal a derecho, so these extreme values gave confidence on the development, track, and longevity of the event.
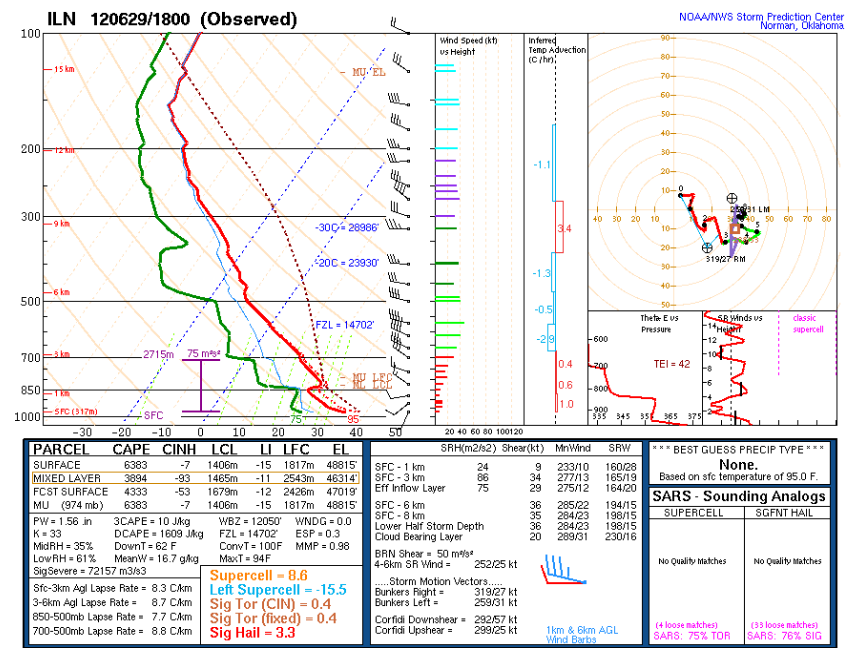
WFO Wilmington, Ohio launched a special sounding at 18Z (2PM EDT) ahead of the developing derecho as seen in Figure 16. The atmosphere was truly explosive with surface based CAPE values over 6300 J/Kg, surface based lifted indices of -15, mid-level lapse rates nearing 9 C/Km, and modest deep layer shear of 36 knots (which increased to over 40 knots farther north). The mid-level cap associated with the EML was almost gone as seen by the CIN values only around -7 J/Kg. This makes sense since the convective temperature analyzed on the sounding was 100 F, and surface temperatures were in the upper 90s F at the time of the sounding. Significant amounts of dry air can be seen in the mid-levels, with mid-level RH values around 35%. This combined with the favorably strong wind shear enhanced downdraft potential which further increased the potential for destructive winds at the surface. In fact, the DCAPE values were as high as 1609 J/Kg in this sounding.
 |
 |
|
| Figure 15: Derecho Composite Parameter | Figure 16: ILN 18Z Observed Sounding |
 |
Media use of NWS Web News Stories is encouraged! Please acknowledge the NWS as the source of any news information accessed from this site. |
|

