It's time to take a look back at the top weather, water, and climate stories across the Northland from 2021, as decided on by the meteorologists at NWS Duluth.
Widespread heavy snow impacted the Northland with Blizzard conditions along the North Shore with strong winds and enhanced snowfall rates off of Lake Superior. Check out the snowfall reports.
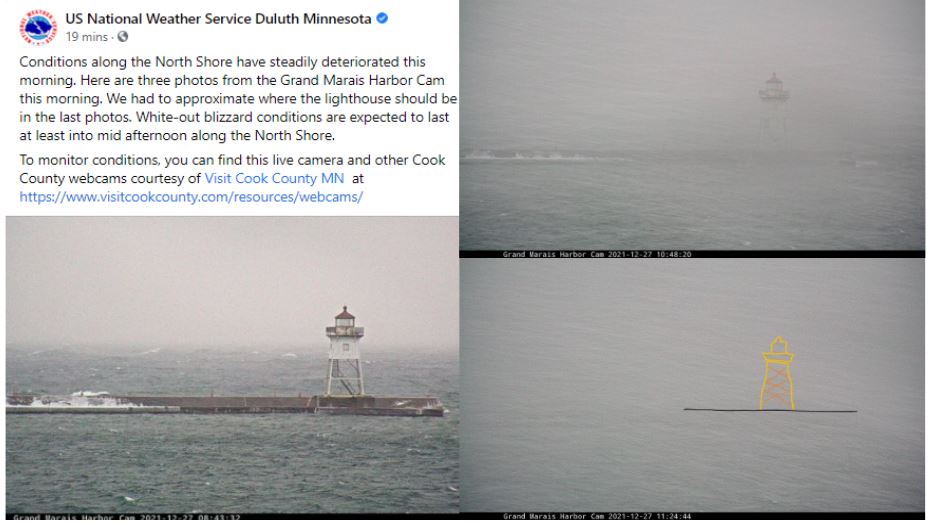
— NWS Duluth (@NWSduluth) December 28, 2021
A November storm brought heavy rain, large waves, and minor flooding to parts of the Northland, and record rainfall at International Falls. Check out some of the notable rain, wind, and snowfall reports.
The first widespread winter storm of the season of the 2021-2022 winter occurred in early December and resulted in over a foot of snowfall for much of the north shore of Lake Superior. Check out a list of the snowfall reports.
Here's a map and list of some of our highest snowfall reports from the past two days. Highest report 20.1 inches 5 NNW of Grand Marais! #mnwx #wiwx pic.twitter.com/ziNFr3QdUe
— NWS Duluth (@NWSduluth) December 6, 2021
Any tornado in the Boundary Waters Canoe Area Wilderness is a pretty rare occurrence, but this tornado occurred unusually late in the season. Initial reports were received from social media nearly a week after the storm occurred, with a combination of satellite imagery and aerial photos from the US Forest Service helping to confirm the tornado damage. NWS Duluth meteorologists had issued a Tornado Warning for this storm and provided an estimated 34 minutes of lead time before the tornado began! Read the tornado summary statement here.
On October 10, our office issued a tornado warning for a storm over Cook County, MN. We have since then collected and analyzed satellite imagery, areal footage from the Superior National Forest, radar imagery, photos and video shared with us from Cook County residents. pic.twitter.com/E85K5BfdLk
— NWS Duluth (@NWSduluth) October 29, 2021
Thunder in Duluth during the month of December is rare, and when it happens its usually during heavy snowfall, not rain. This unusual storm was more like something we typically experience in October or early November and brought record warmth, heavy rainfall (as much as two inches to parts of the Iron Range), and high winds that was followed by a “flash freeze” and some light snow that caused roads to very quickly become dangerously icy.
List of High Wind Reports - Peak gust 55 mph at DULM5, 53 mph at DLH, 51 knots at Devils Island (from continuous wind data file)
List of rainfall reports - Check our a map of the estimated precipitation here: Rainfall Map
List of snowfall reports - Not much snow, but the rapid fall in temperatures caused a flash freeze on area roads, and strong winds caused a period of near-blizzard conditions in north-central Minnesota.
A snow plow camera just south of Walker shows rapidly deteriorating conditions. If you have to travel early this morning use extreme caution! Find weather updates for other portions of the state from @NWSTwinCities @NWSGrandForks @NWSLaCrosse and @NWSSiouxFalls pic.twitter.com/kXAJZoX5tV
— NWS Duluth (@NWSduluth) December 16, 2021
On the busiest severe weather of the 2021 season, NWS Duluth was without our primary radar due to an equipment issue! While our technicians keep our radar in tip-top shape, sometimes equipment unexpectedly malfunctions at the worst time! Not a big deal for our team of trained meteorologists, though, as our team was still able to deliver high quality severe weather warnings for the Northland, issuing 22 warnings across the Northland as a series of thunderstorms produced large hail and damaging winds. Check out a map of the severe weather reports and warnings.
652 pm CDT Radar Update: Severe storms capable of very large hail and damaging winds in excess of 60 mph will continue to move southeast. Additional storm development is expected tonight. We need your reports!!! #mnwx #wiwx pic.twitter.com/wUvJN8x0hv
— NWS Duluth (@NWSduluth) July 26, 2021
In February 2021, a period of cold weather caused a number of records to be broken as well as an extended continuous period with dangerously cold wind chill values. The cold snap also caused a rapid rise in ice cover on Lake Superior in winter that otherwise had very little ice development on the big lake.
With our deep freeze behind us, just how long did it last? We issued our first Wind Chill Advisory at 3am, February 5th, and the last Advisory expired at 9am on February 17th. We had some kind of a wind chill headline in effect for 294 consecutive hours! #mnwx #wiwx pic.twitter.com/Lt98AsQEpd
— NWS Duluth (@NWSduluth) February 18, 2021
Earlier today, we posted a graphic showing the recent loss of ice on #LakeSuperior as temps warmed up and winds helped to break up the ice. To follow up, here is the latest ice coverage percentage, as well as today's MODIS imagery of western Lake Superior. #mnwx #wiwx pic.twitter.com/8spzOFpzPL
— NWS Duluth (@NWSduluth) February 25, 2021
Rounding out the story of the dry conditions, record warmth, and wildfires was the smoke from fires in both the US and Canada. Check out this excellent Story Map from the Minnesota Pollution Control Agency to learn more about how the smoke caused some of the worst air quality ever recorded in parts of northern Minnesota.
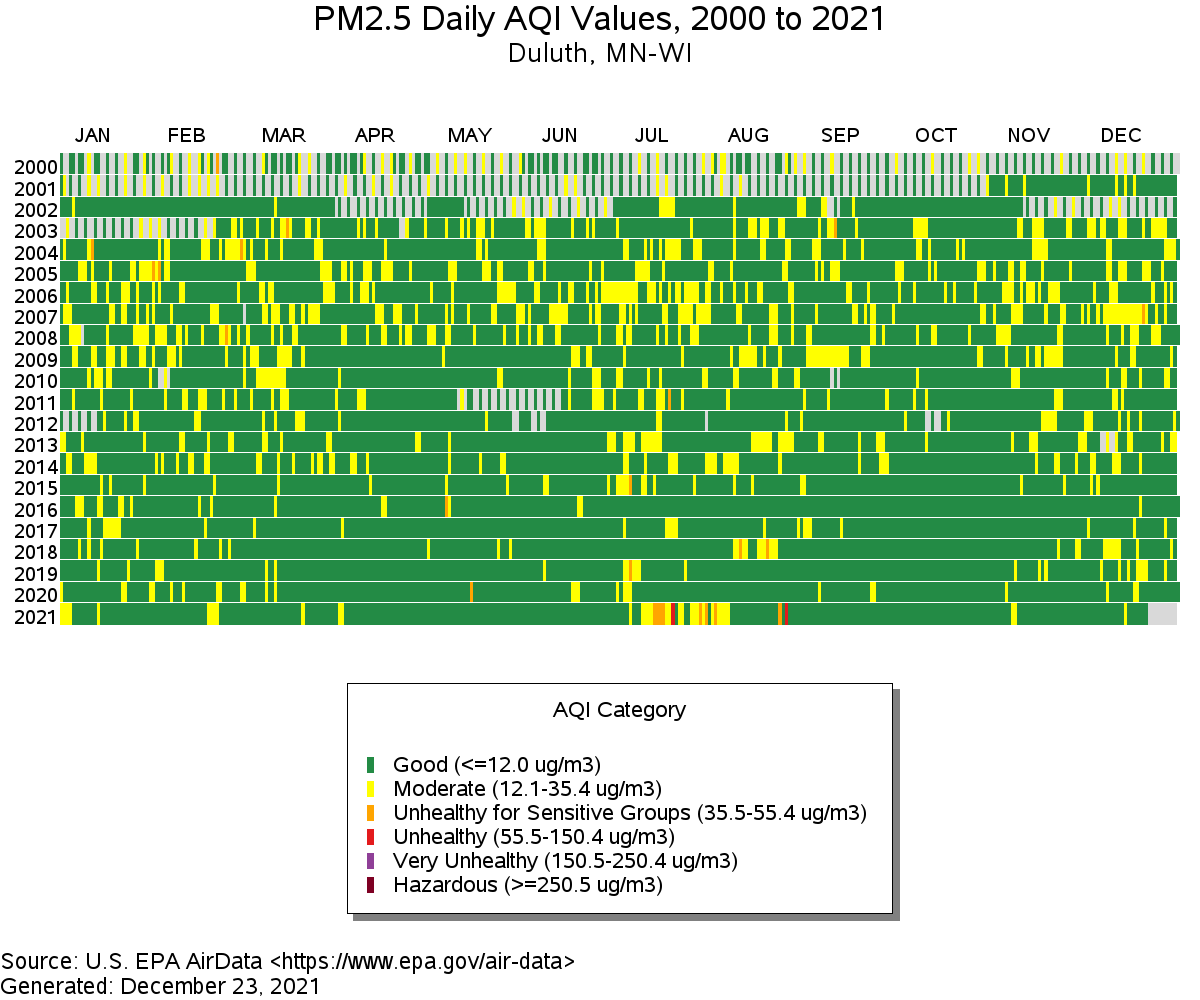
Image Above: A timeline of air quality readings in the greater Twin Ports region over the past 21 years, showing how rare poor air quality days are in this region. (Image Credit: EPA)
The dry conditions also led to a record warm summer across the Northland, with high temperatures reaching into the mid to upper 90s at some locations in the early summer days. There are few ways to measure the warmth of the summer:
Average Temperature
The mean average temperature for the summer was record-breaking at Duluth and Brainerd. (This is calculated by taking the mean of the high and low temperature each day (high temp + low temp divided by 2), and then calculating the average of all days in the summer season - June, July, and August.)
Number of 80+ Degree Days
How many days did the temperature reach 80F or warmer?
Daily Records Broken
Here’s a look at some of the daily records broken this past summer. (Note that each station has a different length of history, and in some cases stations have moved over time slightly.)
Summer 2021 will go on record as the hottest on record at both Duluth and Brainerd, and likely tie as the hottest at International Falls based on average temperature. Values may change ever so slightly once the August 31 data is included. #mnwx #wiwx pic.twitter.com/oslsZpT8uE
— NWS Duluth (@NWSduluth) September 1, 2021
With the drought came an exceptionally busy fire season for our land management partners. While the dry conditions weren’t all bad news - the dry conditions did allow partners like the US Forest Service and MN DNR to conduct many preventive prescribed burns - the dry vegetation led to a busy year for Minnesota’s Interagency Fire Center (MIFC). By far the most notable fire was the ~26,797 acre Greenwood Fire in Lake County which was initially detected on August 15, 2021 and grew rapidly on that hot and windy day, with particularly explosive growth on August 23, 2021 that led to the growth of a Pyrocumulus cloud, indicative of very intense fire activity. The National Weather Service provided an on-site incident meteorologist for the Greenwood Fire as over 450 firefighting personnel from across the country worked together to contain the fire in late August as well as providing weather support for dozens of other fires across the Northland. NWS Duluth provided a record number of site-specific SPOT forecasts with over 600 individual forecasts delivered to our land management partners over the course of 2021 - 354 for prescribed (planned) burns and 254 for wildfires. This was the most our office has provided in recent memory, and NWS Duluth was the 12th-busiest office nationwide with regards to providing these site-specific forecasts in 2021, and by far the busiest office in the Midwest.
Some incredible pictures and video have come out of the #greenwoodfire, showing #pyrocumulus clouds forming from this intense fire. You can see in the image the billowing pyrocumulus above the main smoke cloud, looking very similar to a fair weather cumulus cloud. #mnwx pic.twitter.com/eCwtyelyrX
— NWS Duluth (@NWSduluth) August 24, 2021
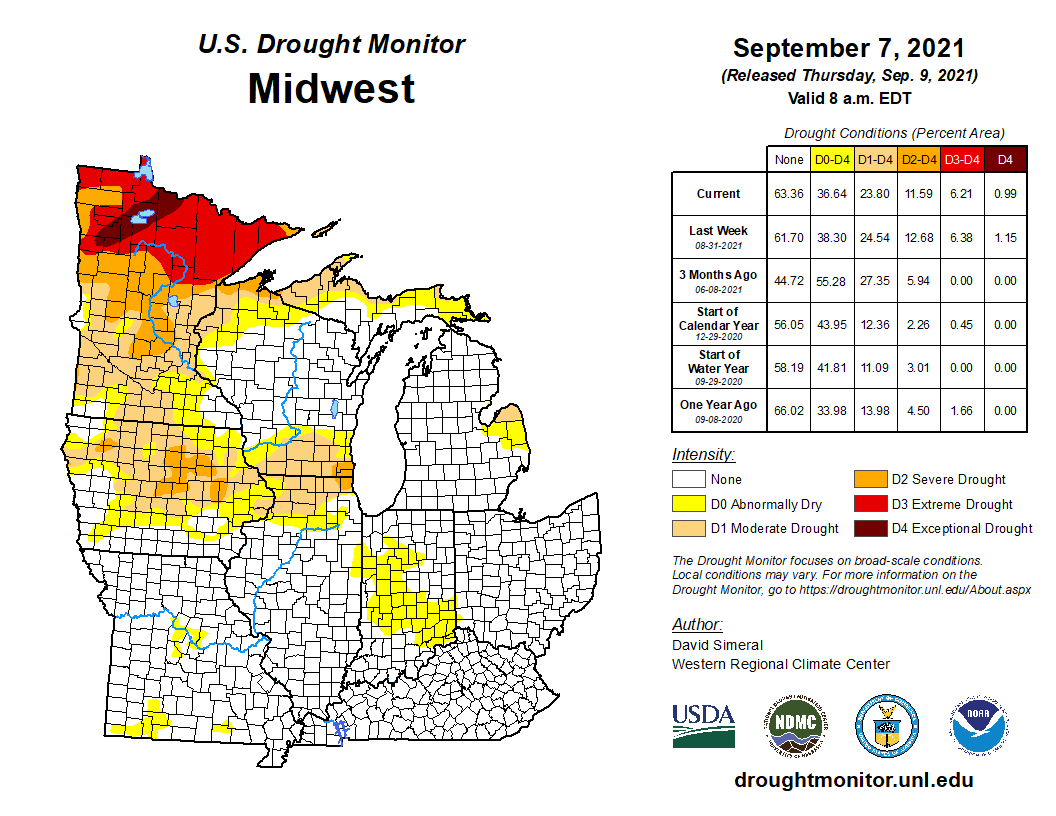
It will come as no surprise that our team of meteorologists consider the drought our top weather story of the year. For the first time since the inception of the modern Drought Monitor (2000), parts of northern Minnesota were given the D4/Exceptional category designation - the worst drought category possible. The drought was comparable to past droughts in 1988 and 1977, with some rainfall deficits rivaling each the 1930s Dust Bowl-era records. (Wonder how the Drought Monitor categories are decided upon? It’s a team effort between NOAA, USDA, the National Drought Mitigation Center at the University of Nebraska-Lincoln, and hundreds of observers like state climatologists, NWS meteorologists, Extension agents, and many others who provide input. Learn more about the US Drought Monitor.)
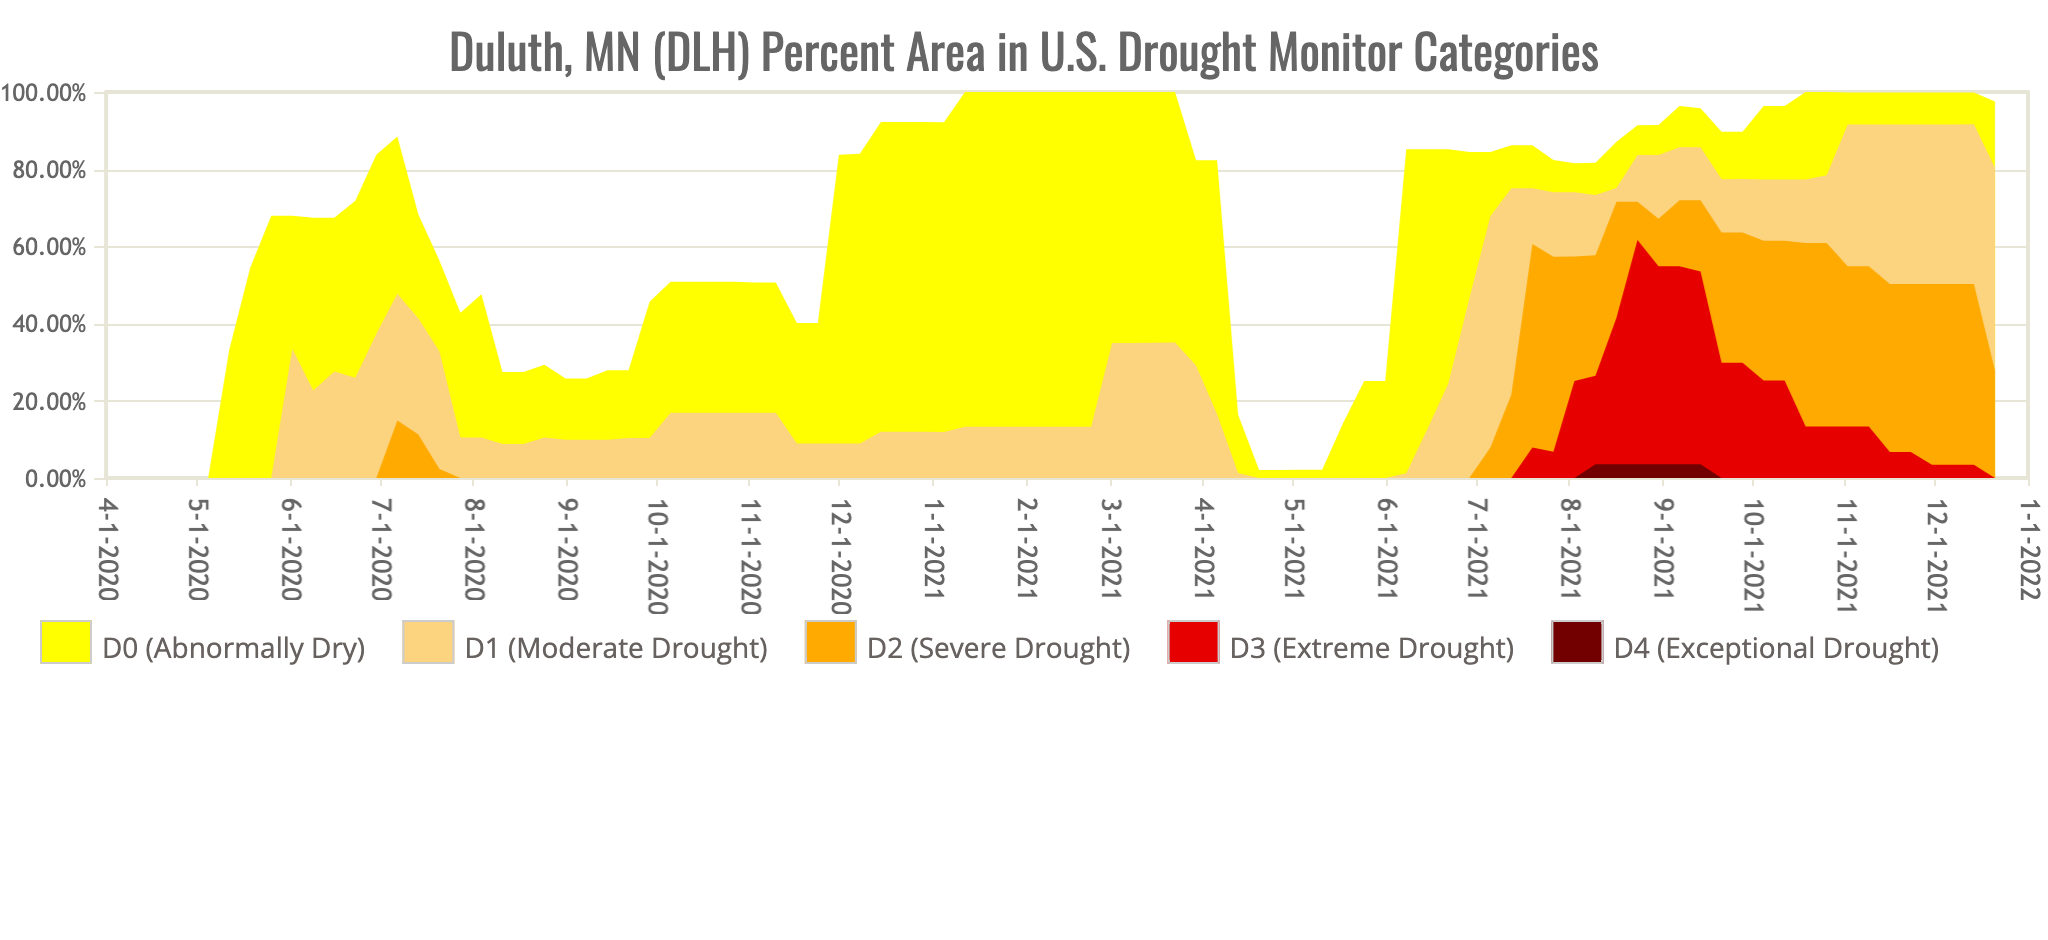
Image Above: A timeline on the coverage of drought categories across northeast Minnesota and northwest Wisconsin. (Credit: US Drought Monitor)
Image Below: The worst of the drought occurred in late August and early September. This is a snapshot of the weekly US Drought Monitor on September 7, 2021. (Credit: US Drought Monitor)