September 2019 Climate Summary
and October Climate Outlook
 |
|
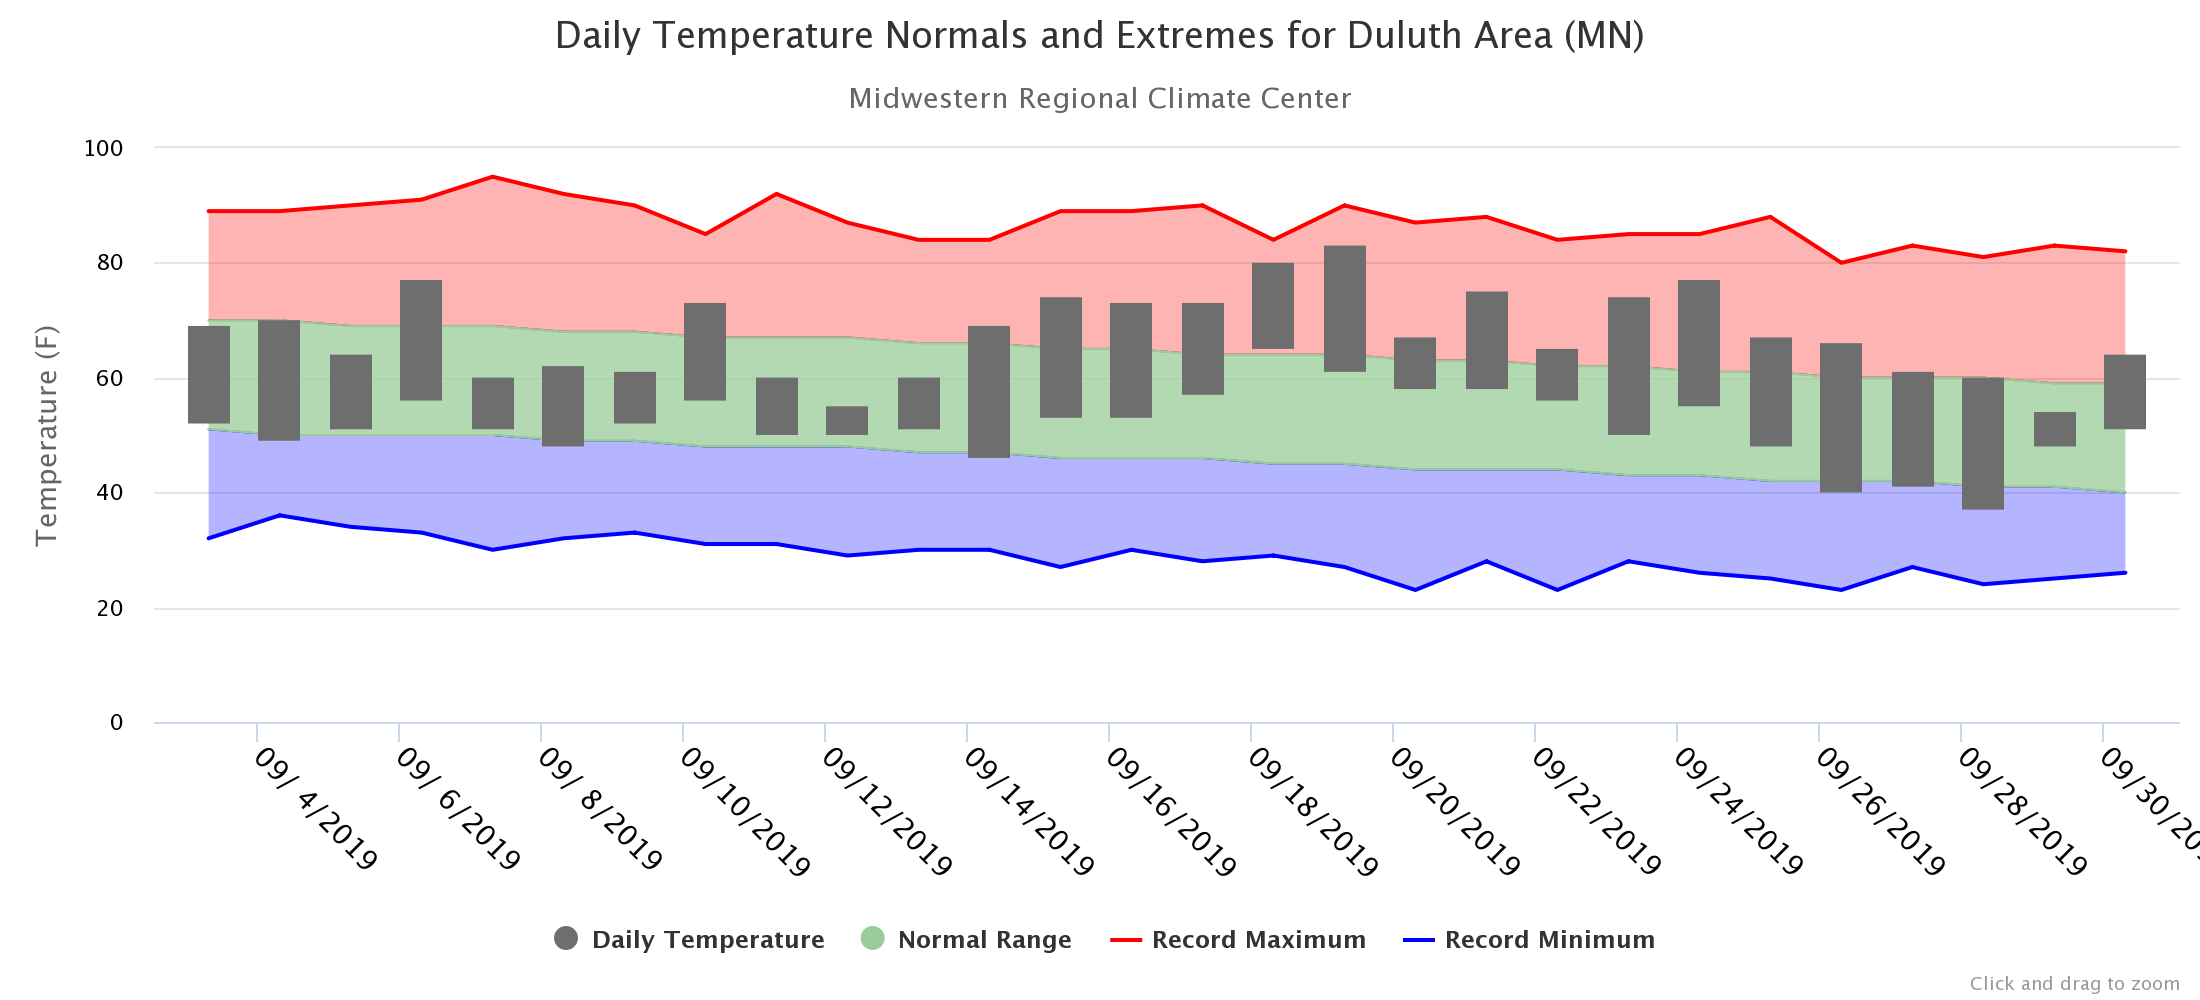
For the full details check out: Click Here For a larger view of the Duluth, Minnesota temperature graph provided by the Midwestern Regional Climate Center: Click Here |
 |
|
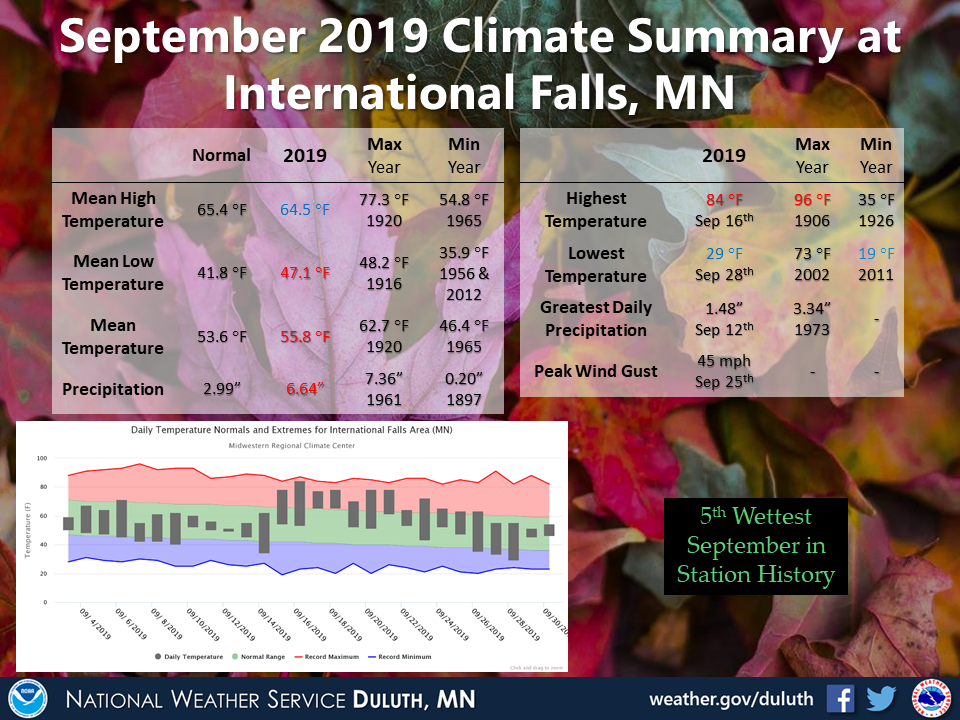
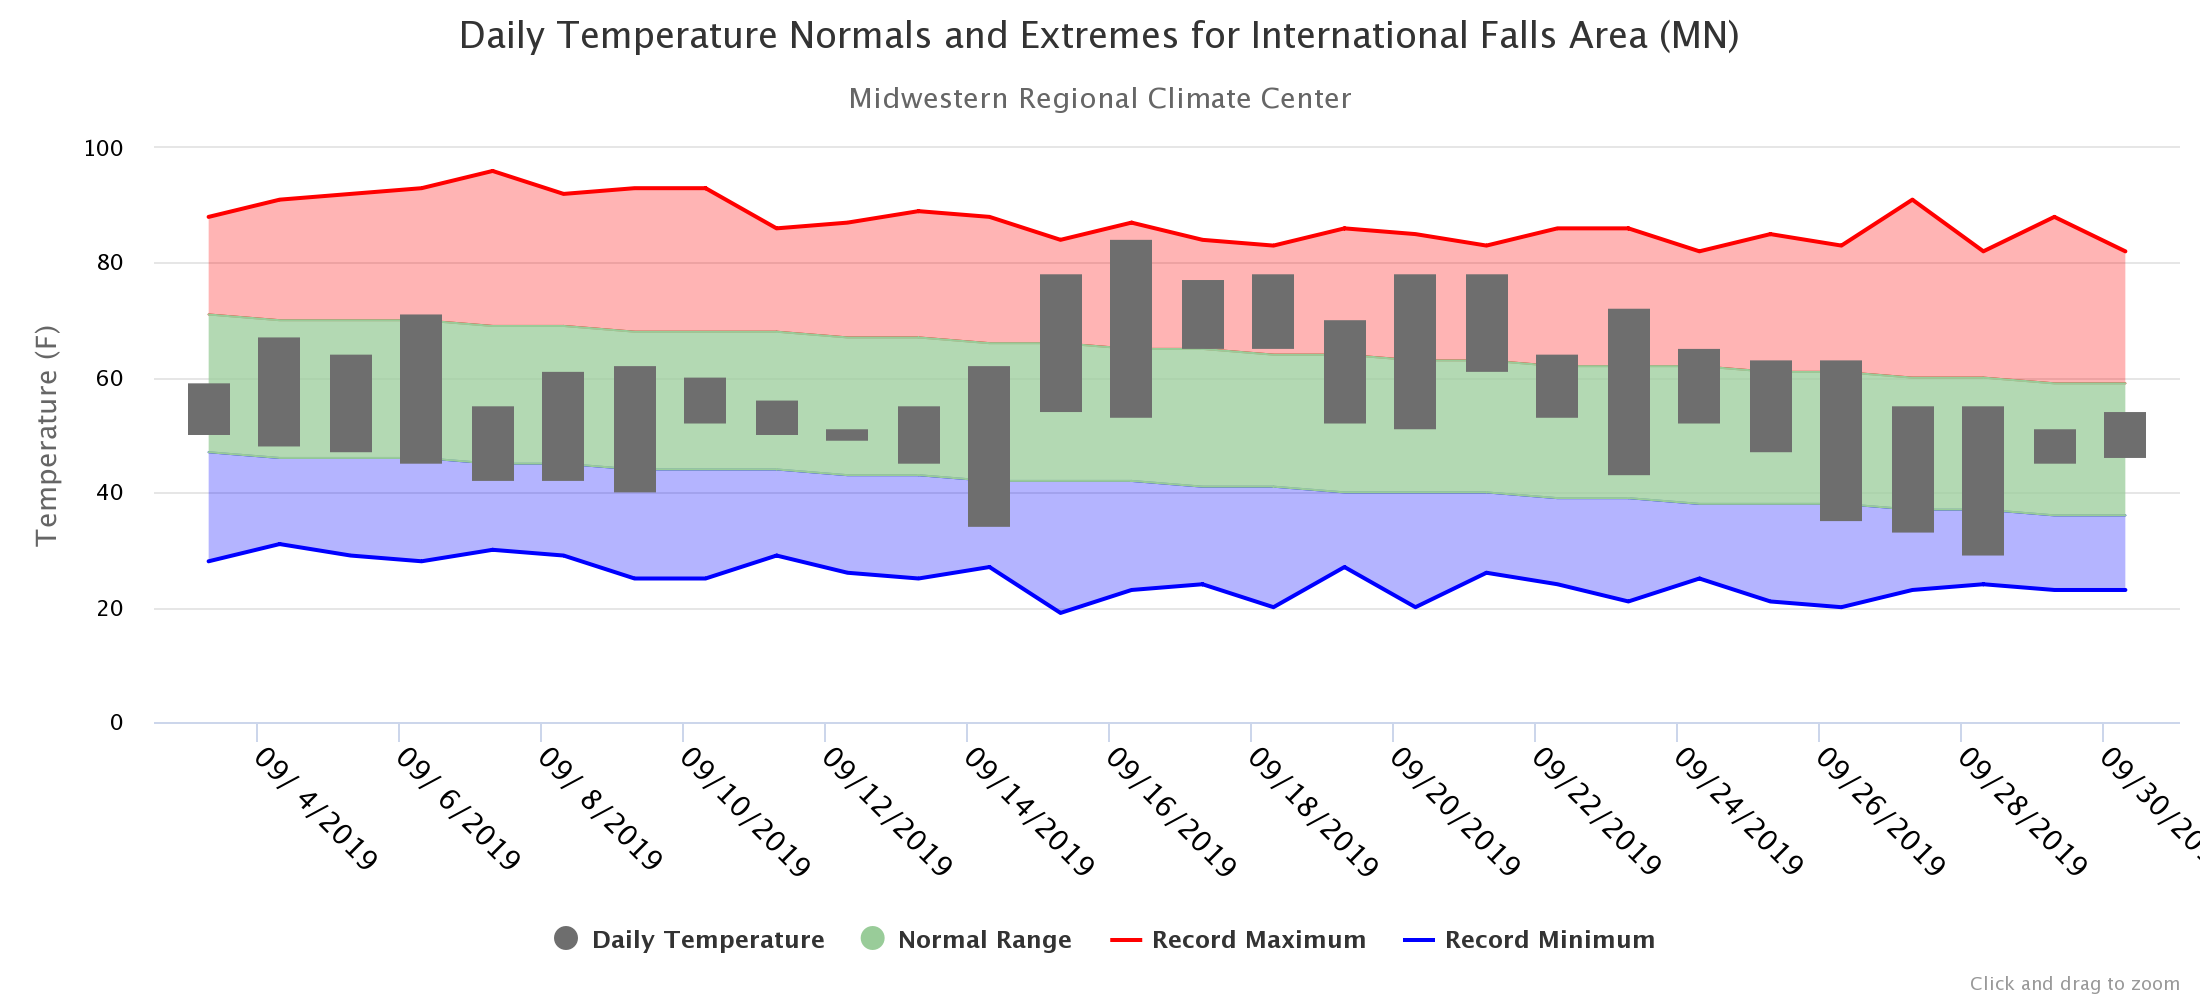
For the full details check out: Click Here For a larger view of the International Falls, Minnesota temperature graph provided by the Midwestern Regional Climate Center: Click Here |
 |
|
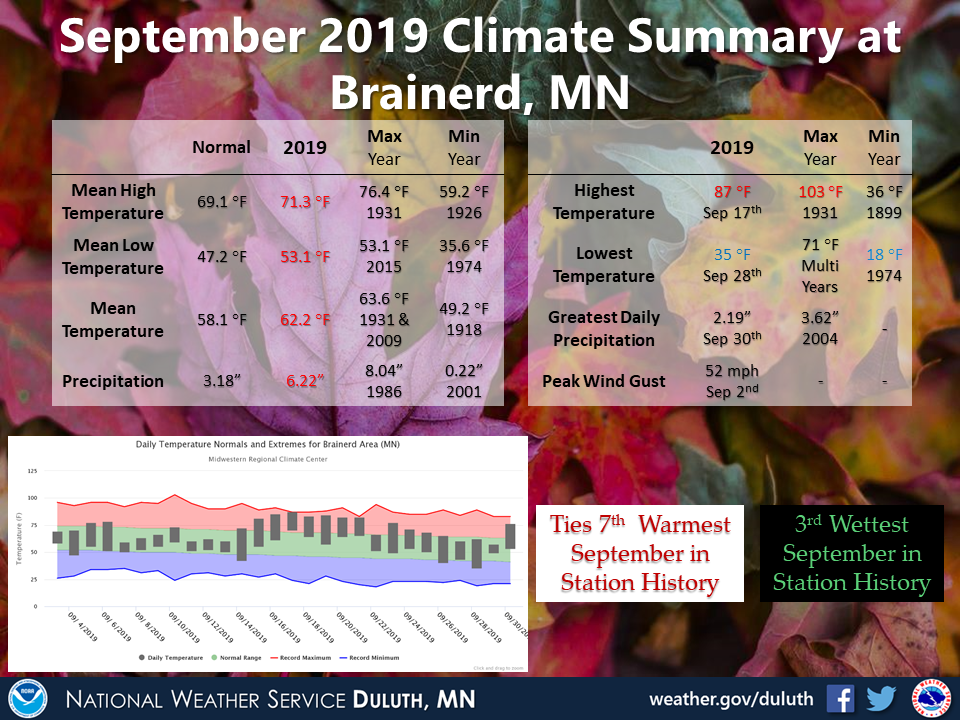
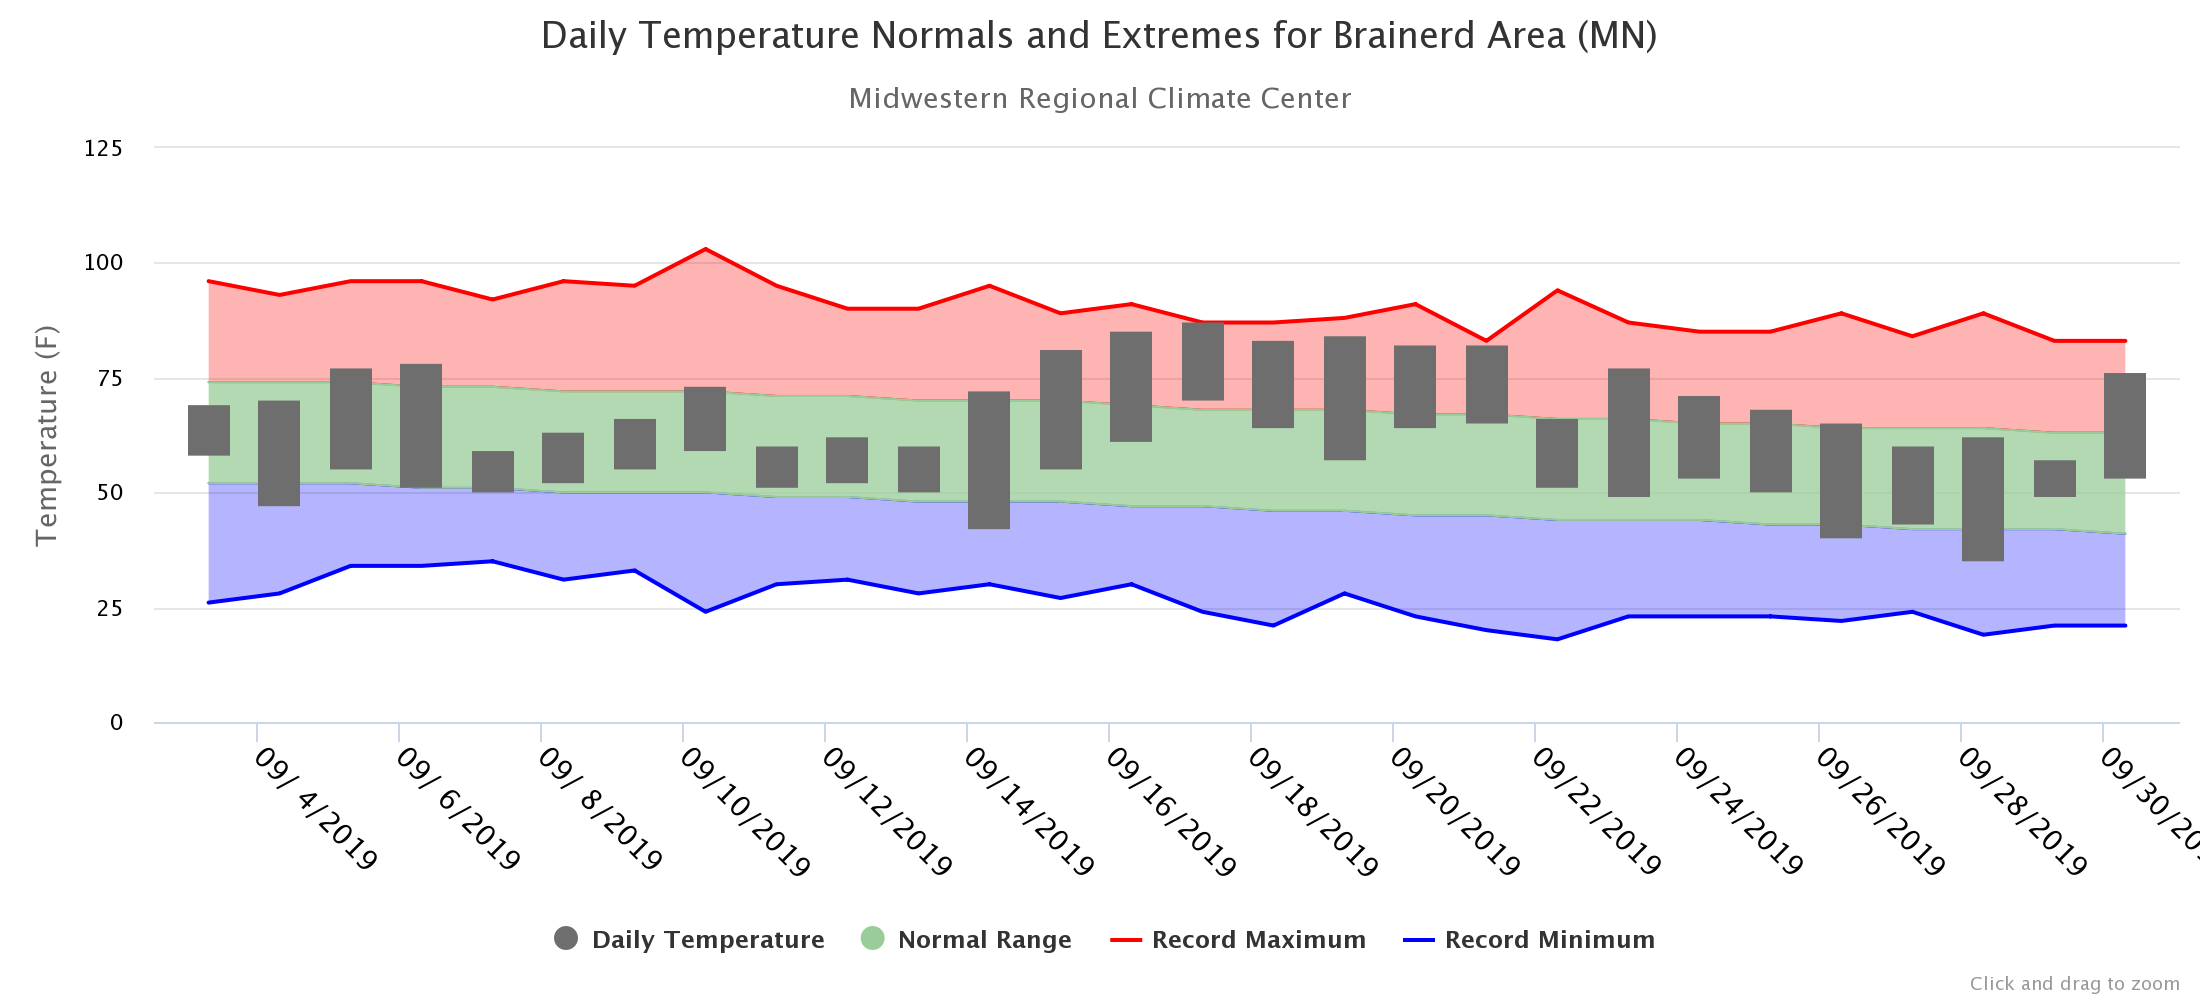
For the full details check out: Click Here For a larger view of the Brainerd, Minnesota temperature graph provided by the Midwestern Regional Climate Center: Click Here |
 |
|
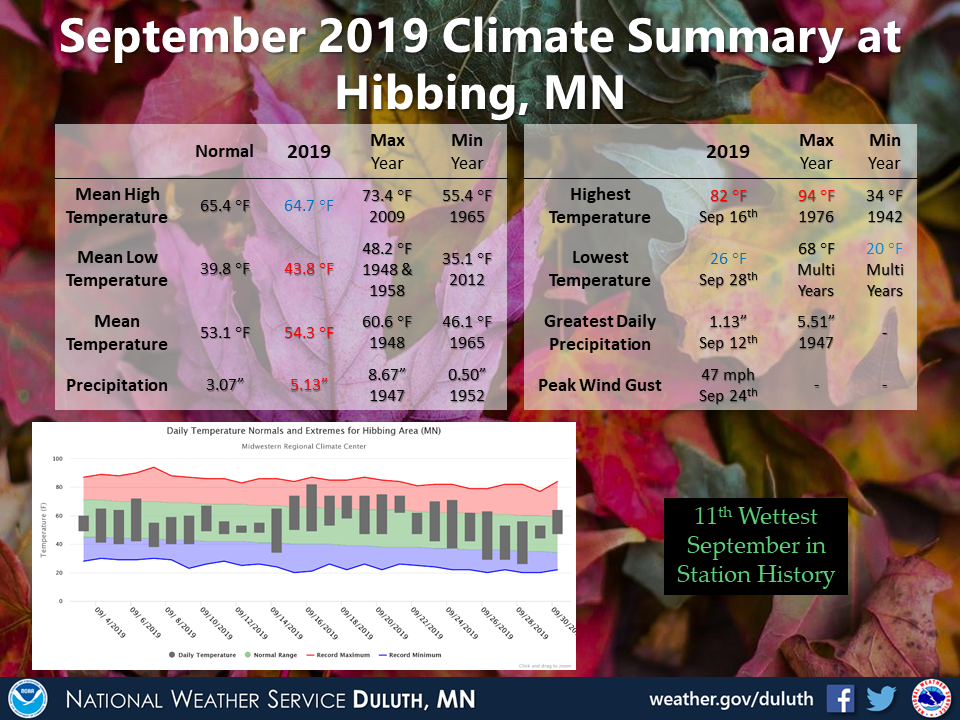
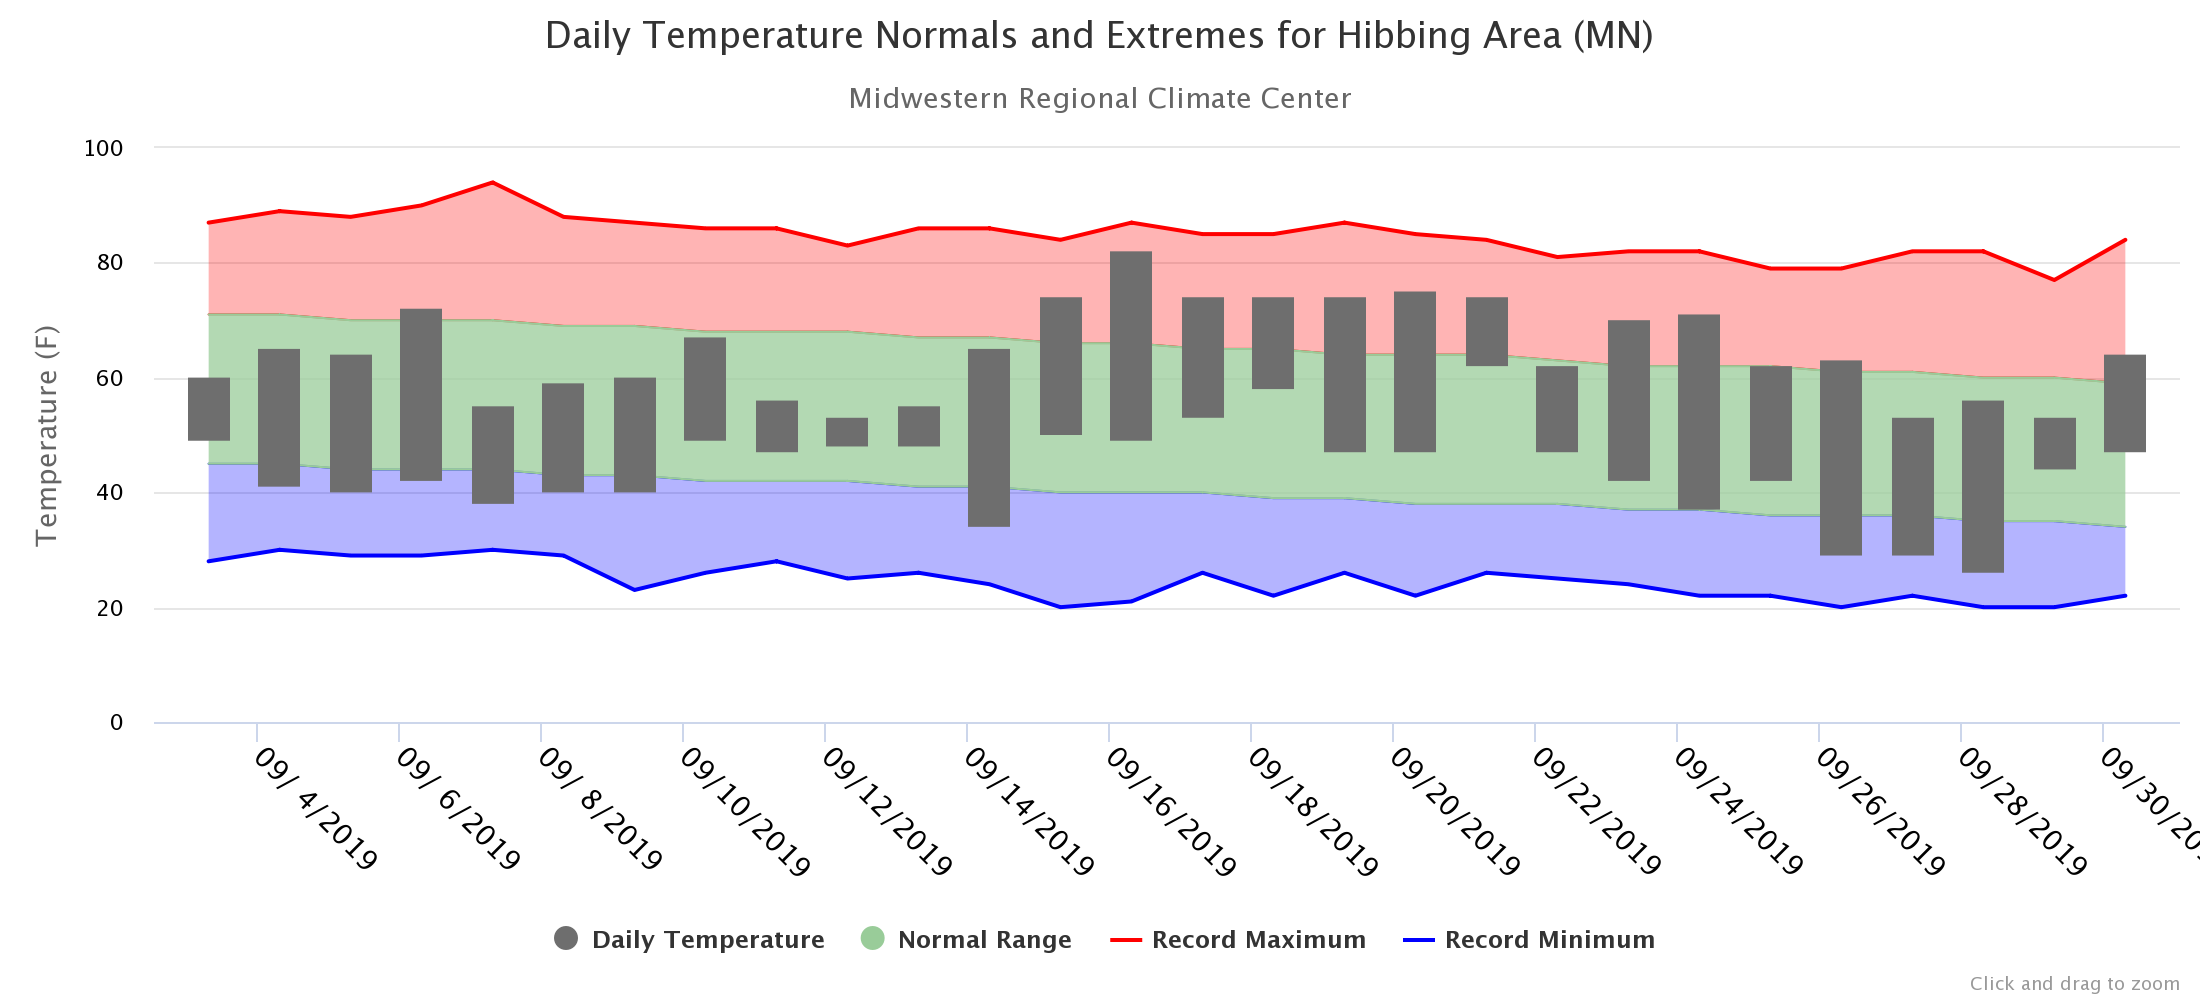
For the full details check out: Click Here For a larger view of the Hibbing, Minnesota temperature graph provided by the Midwestern Regional Climate Center: Click Here |
 |
|
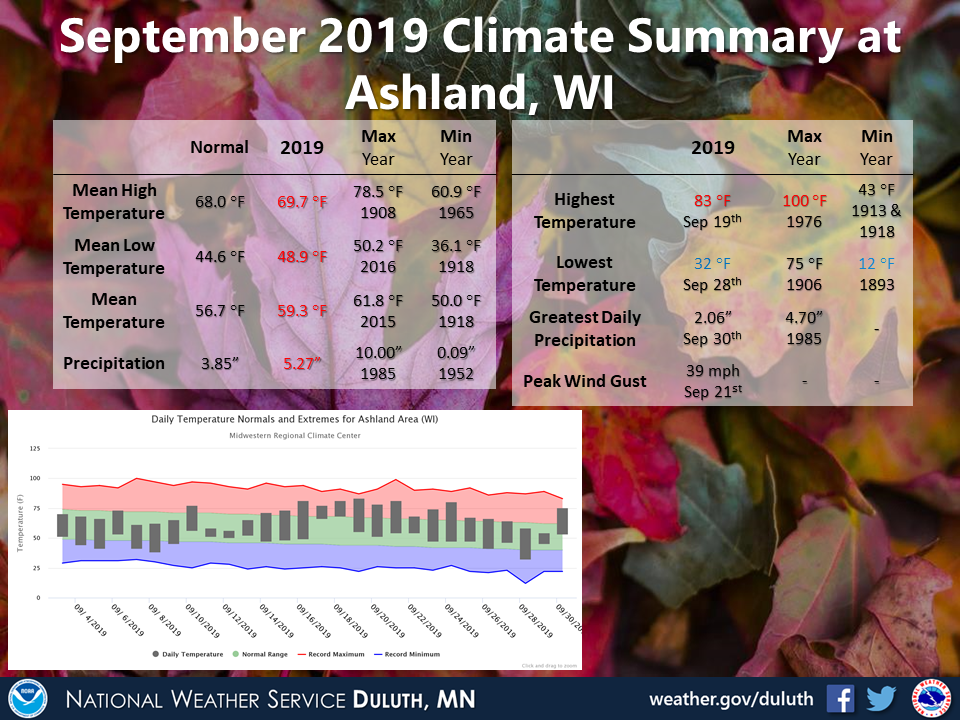
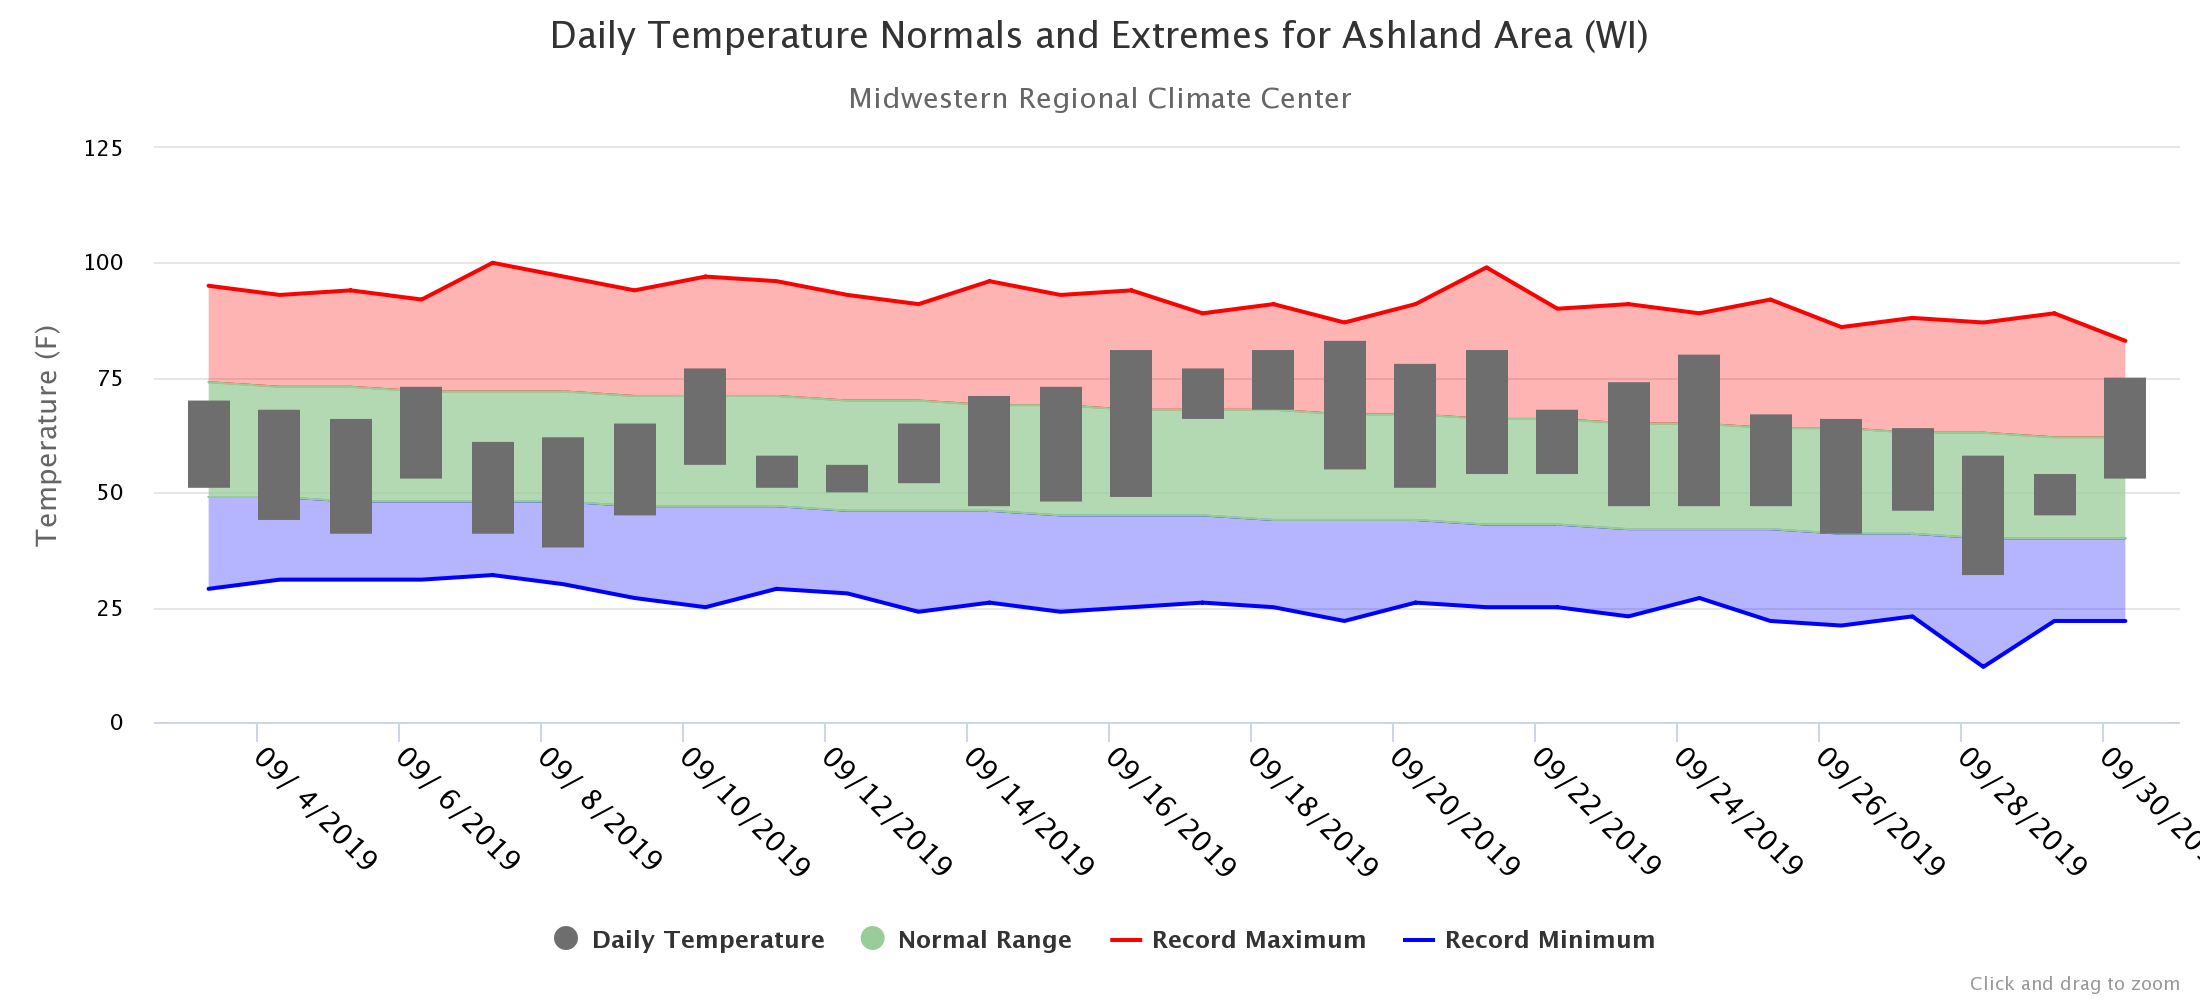
For the full details check out: Click Here For a larger view of the Ashland, Wisconsin temperature graph provided by the Midwestern Regional Climate Center: Click Here |
October Climate Outlook
| Temperature Outlook | Precipitation Outlook |
 |
 |
|
For Duluth, normal highs begin in the upper 50s and cool to the mid 40s by the end of the month. Normal lows begin in the low 40s and cool to the low 30s by the end of the month. Normal precipitation for October is 2.85 inches. Normal snowfall for October is 2.3 inches. For International Falls, normal highs begin in the upper 50s and cool to the low 40s by the end of the month. Normal lows begin in the mid 30s and cool to the mid 20s by the end of the month. Normal precipitation for October is 2.08 inches. Normal snowfall for October is 2.2 inches. For Brainerd, normal highs begin in the low 60s and cool to the upper 40s by the end of the month. Normal lows begin in the lower 40s and cool to the lower 30s by the end of the month. Normal precipitation for October is 2.18 inches. Normal snowfall for October is 0.4 inches. For Hibbing, normal highs begin in the upper 50s and cool to the mid 40s by the end of the month. Normal lows begin in the mid 30s and cool to the mid 20s by the end of the month. For Ashland, normal highs begin in the low 60s and cool to the upper 40s by the end of the month. Normal lows begin in the upper 30s and cool to the lower 30s by the end of the month. The latest Climate Prediction Center (CPC) outlook for October indicates that there is no clear signal for above or below normal temperatures and odds are tilted toward above normal precipitation. |
|
Duluth, MN
|
Normals for the Month of October |
|
|
The Normal, Monthly Average Temperature (degrees F) |
43.2 |
|
The Normal, Monthly High Temperature (degrees F) |
51.5 |
|
The Normal, Monthly Low Temperature (degrees F) |
34.8 |
|
|
|
|
Normal Monthly Precipitation (inches) |
2.85 |
|
Normal Monthly Snowfall (inches) |
2.3 |
|
|
|
|
Normal number of days with Measurable Precipitation |
11.3 |
|
Normal number of days with snow depth of 1 inch or greater |
0.8 |
|
|
|
|
Normal Heating Degree Days |
678 |
|
Normal Cooling Degree Days |
0 |
|
|
|
|
Records for the Month of October |
|
|
Warmest Month (Monthly Average Temperature) |
55.9 in 1963 |
|
Coldest Month (Monthly Average Temperature) |
33.5 in 1917 |
|
Highest Observed Temperature (degrees F) |
86 on the 2nd in 1953 |
|
Lowest Observed High Temperature (degrees F) |
21 on the 28th in 1925 |
|
Lowest Observed Temperature (degrees F) |
6 on the 27th in 1917 |
|
Highest Observed Low Temperature (degrees F) |
62 on the 14th in 1968 & on the 8th in 2011 |
|
|
|
|
Greatest Monthly Precipitation (inches) |
7.53 in 1949 |
|
Least Monthly Precipitation (inches) |
0.09 in 1895 |
|
Greatest Daily Precipitation (inches) |
2.94 on the 26th in 2010 |
|
|
|
|
Greatest Monthly Snowfall (inches) |
14.0 in 1933 |
|
Least Monthly Snowfall (inches) |
0.0 in Multiple Years |
|
Greatest Daily Snowfall (inches) |
10.0 on the 23rd in 1933 |
|
Greatest Measured Snow Depth (inches) |
6 on the 16th to 17th in 1966 & on the 27th in 2010 |
International Falls, MN
|
Normals for the Month of October |
|
|
The Normal, Monthly Average Temperature (degrees F) |
41.1 |
|
The Normal, Monthly High Temperature (degrees F) |
51.1 |
|
The Normal, Monthly Low Temperature (degrees F) |
31.0 |
|
|
|
|
Normal Monthly Precipitation (inches) |
2.08 |
|
Normal Monthly Snowfall (inches) |
2.2 |
|
|
|
|
Normal number of days with Measurable Precipitation |
11.7 |
|
Normal number of days with snow depth of 1 inch or greater |
0.8 |
|
|
|
|
Normal Heating Degree Days |
743 |
|
Normal Cooling Degree Days |
0 |
|
|
|
|
Records for the Month October |
|
|
Warmest Month (Monthly Average Temperature) |
53.6 in 1963 |
|
Coldest Month (Monthly Average Temperature) |
32.7 in 1917 |
|
Highest Observed Temperature (degrees F) |
88 on the 5th in 1963 & on the 11th in 2015 |
|
Lowest Observed High Temperature (degrees F) |
20 on the 27th in 1919 |
|
Lowest Observed Temperature (degrees F) |
2 on the 30th in 1988 |
|
Highest Observed Low Temperature (degrees F) |
64 on the 7th in 2011 |
|
|
|
|
Greatest Monthly Precipitation (inches) |
5.45 in 1909 |
|
Least Monthly Precipitation (inches) |
0.14 in 1992 |
|
Greatest Daily Precipitation (inches) |
2.33 on the 31st in 1979 |
|
|
|
|
Greatest Monthly Snowfall (inches) |
10.5 in 1917 |
|
Least Monthly Snowfall (inches) |
0.0 in Multiple Years |
|
Greatest Daily Snowfall (inches) |
6.0 on the 18th in 1917 |
|
Greatest Measured Snow Depth (inches) |
8 on the 22nd in 1917 |
Brainerd, MN
|
Normals for the Month of October |
|
|
The Normal, Monthly Average Temperature (degrees F) |
45.5 |
|
The Normal, Monthly High Temperature (degrees F) |
55.3 |
|
The Normal, Monthly Low Temperature (degrees F) |
35.7 |
|
|
|
|
Normal Monthly Precipitation (inches) |
2.93 |
|
Normal Monthly Snowfall (inches) |
0.4 |
|
|
|
|
Normal Heating Degree Days |
606 |
|
Normal Cooling Degree Days |
1 |
|
|
|
|
Records for the Month of October |
|
|
Warmest Month (Monthly Average Temperature) |
56.3 in 1963 |
|
Coldest Month (Monthly Average Temperature) |
32.6 in 1925 |
|
Highest Observed Temperature (degrees F) |
88 on the 2nd in 1992 |
|
Lowest Observed High Temperature (degrees F) |
20 on the 27th and the 28th in 1925 |
|
Lowest Observed Temperature (degrees F) |
4 on the 27th in 1976 |
|
Highest Observed Low Temperature (degrees F) |
66 on the 15th in 1962 and on the 7th in 2011 |
|
|
|
|
Greatest Monthly Precipitation (inches) |
7.06 in 1984 |
|
Least Monthly Precipitation (inches) |
0.18 in 1964 |
|
Greatest Daily Precipitation (inches) |
3.11 on the 26th in 2010 |
|
|
|
|
Greatest Monthly Snowfall (inches) |
3.5 in 1992 |
|
Least Monthly Snowfall (inches) |
0.0 in Multiple Years |
|
Greatest Daily Snowfall (inches) |
3.0 on the 22nd in 1987 and on the 31st in 1972 |
|
Greatest Measured Snow Depth (inches) |
3 on the 26th in 1959 |
Hibbing, MN
|
Normals for the Month of October |
|
|
The Normal, Monthly Average Temperature (degrees F) |
40.7 |
|
The Normal, Monthly High Temperature (degrees F) |
52.0 |
|
The Normal, Monthly Low Temperature (degrees F) |
29.5 |
|
|
|
|
Normal Heating Degree Days |
752 |
|
Normal Cooling Degree Days |
0 |
|
|
|
|
Records for the Month of October |
|
|
Warmest Month (Monthly Average Temperature) |
52.7 in 1947 |
|
Coldest Month (Monthly Average Temperature) |
33.6 in 2002 |
|
Highest Observed Temperature (degrees F) |
87 on the 5th in 1963 and on the 11th in 2015 |
|
Lowest Observed High Temperature (degrees F) |
25 in multiple years |
|
Lowest Observed Temperature (degrees F) |
0 on the 27th in 1976 |
|
Highest Observed Low Temperature (degrees F) |
61 on the 8th and the 12th in 1997 |
Ashland, WI
|
Normals for the Month of October |
|
|
The Normal, Monthly Average Temperature (degrees F) |
44.5 |
|
The Normal, Monthly High Temperature (degrees F) |
54.6 |
|
The Normal, Monthly Low Temperature (degrees F) |
34.4 |
|
|
|
|
Normal Heating Degree Days |
637 |
|
Normal Cooling Degree Days |
2 |
|
|
|
|
Records for the Month of October |
|
|
Warmest Month (Monthly Average Temperature) |
55.3 in 1963 |
|
Coldest Month (Monthly Average Temperature) |
36.4 in 1925 |
|
Highest Observed Temperature (degrees F) |
94 on the 14th in 1908 |
|
Lowest Observed High Temperature (degrees F) |
26 on the 28th in 1925 |
|
Lowest Observed Temperature (degrees F) |
0 on the 18th in 1893 |
|
Highest Observed Low Temperature (degrees F) |
67 on the 3rd in 2005 |

