Winter 2018-2019 Outlook for the Northland
(meteorological winter defined as December, January, and February)
 |
|
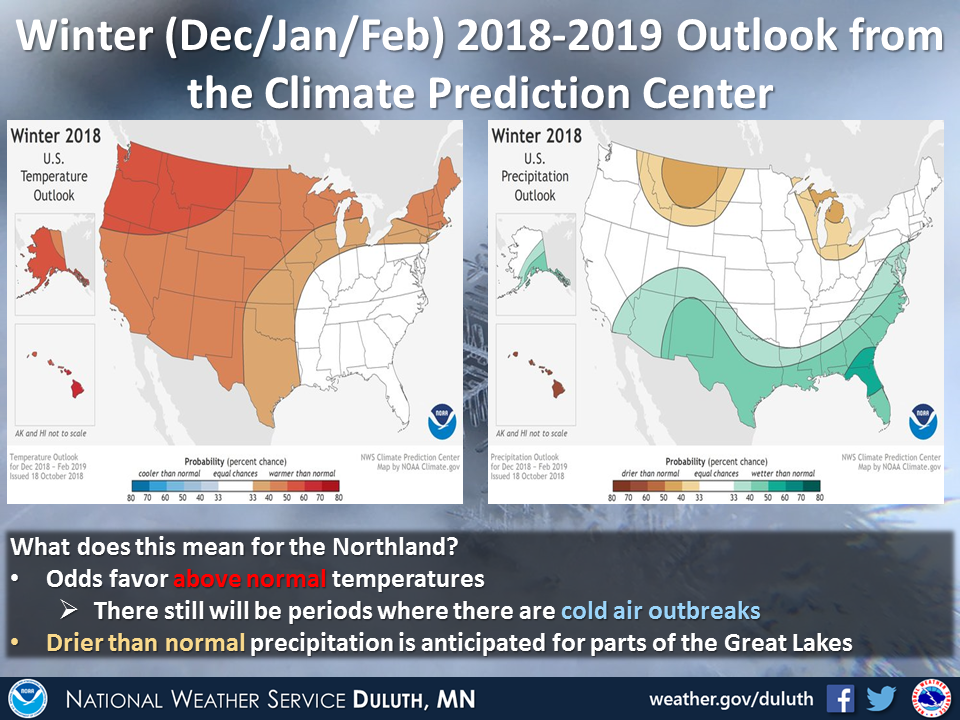
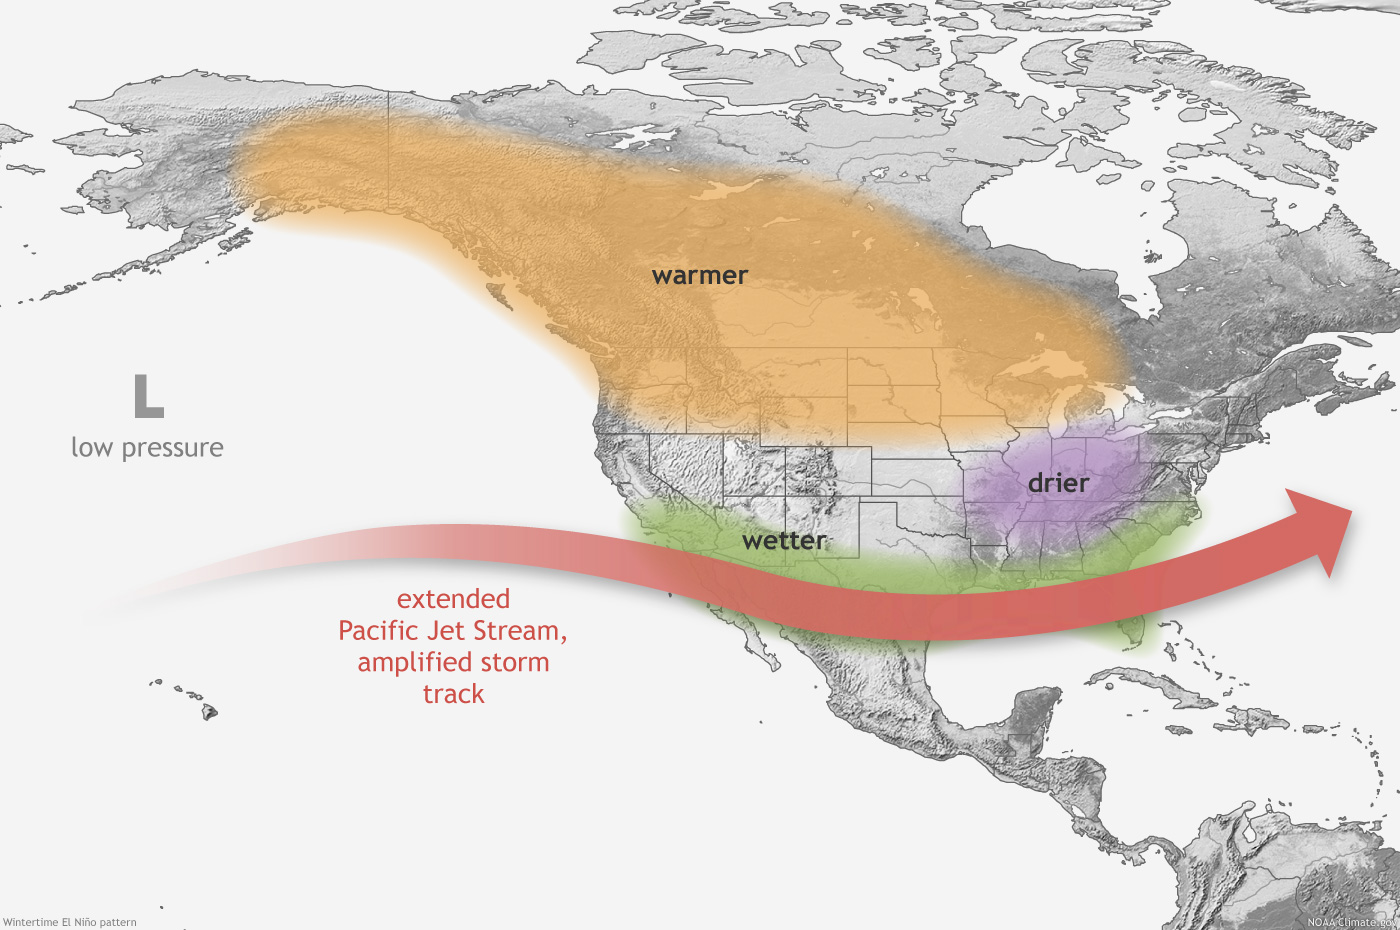
For this upcoming winter the Climate Prediction Center (CPC) temperature and precipitation forecast generally reflects a typical El Niño pattern:
- Wetter than normal conditions across the southern United States, with above normal temperatures across the Central and Western Great Lakes extending through the Northern Plains to the Pacific Northwest.
- Drier than normal precipitation is shifted a bit further north from the typical Ohio River Valley to the Central and Western Great Lakes (click link to see a typical El Niño pattern impacts).
- The majority of the rest of the United States is anticipated to see above normal temperatures with the exception of the Southeast US and Mid Atlantic where there is no clear signal for above or below normal temperature.
- Remember it is an outlook over an entire season, so it may be hard to notice differences on a day to day basis.
- Drier than normal precipitation does not necessarily mean that there will be lower than normal snowfall.
|
| Looking back at the 2017-2018 winter |
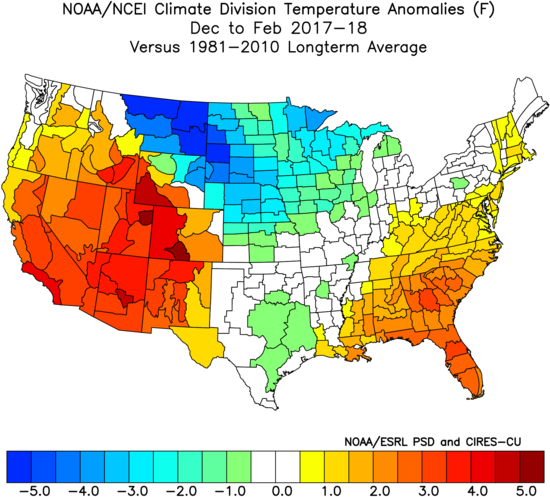
| Departure from Normal Temperatures (Temperature Anomalies) |
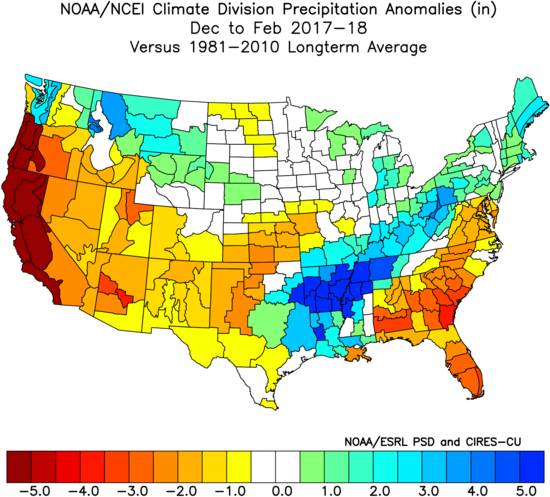
Departure from Normal Precipitation (Precipitation Anomalies) |
 |
 |
| Note that cooler (warmer) colors indicate cooler (warmer) than normal temperatures |
Note that cooler (warmer) colors indicate above (below) normal precipitation |
|
Last winter we had a weak La Niña. This brought the Northland cooler than normal temperatures and generally near to above normal precipitation. Below are tables of the observed values for the winter of 2017-2018.
| Observed values for the winter of 2017-2018 |
| Location |
Average Temperature (°F) |
Precipitation (in) |
Snowfall (in) |
| Duluth, MN |
10.6 |
3.19 |
46.7 |
| International Falls, MN |
4.9 |
2.85 |
40.6 |
| Brainerd, MN |
10.6 |
2.36 |
35.8 |
| Hibbing, MN |
6.0 |
- |
- |
| Ashland, WI |
13.4 |
- |
- |
|
Normal values for the winter
(Seasonal climate normals are from a 30 year period defined by the Climate Prediction Center as 1981-2010)
|
| Location |
Average Temperature (°F) |
Precipitation (in) |
Snowfall (in) |
| Duluth, MN |
13.3 |
2.98 |
49.5 |
| International Falls, MN |
8.1 |
2.00 |
40.8 |
| Brainerd, MN |
14.3 |
2.25 |
26.2 |
| Hibbing, MN |
9.9 |
- |
- |
| Ashland, WI |
16.4 |
- |
- |
Interesting notes on the 2017-2018 winter:
- Brainerd, MN saw its 13th snowiest winter on record.
- Hibbing, MN saw its 10th coldest winter on record.
|
| Past weak El Niño winters |
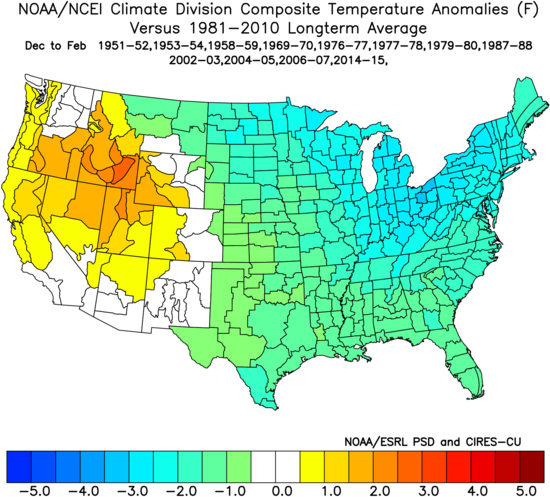
| Composite Departure from Normal Temperatures (Temperature Anomalies) |
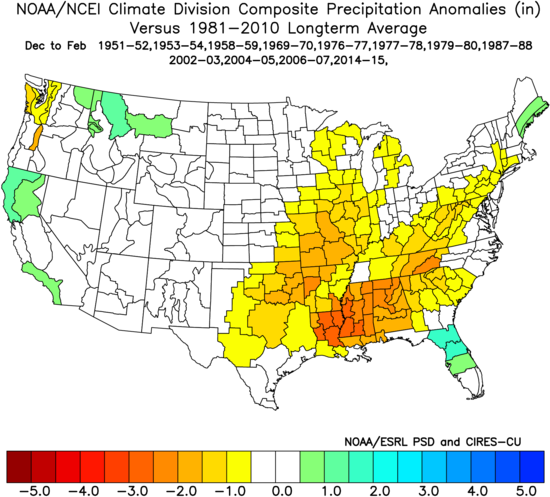
Composite Departure from Normal Precipitation (Precipitation Anomalies) |
 |
 |
| Note that cooler (warmer) colors indicate cooler (warmer) than normal temperatures |
Note that cooler (warmer) colors indicate above (below) normal precipitation |
|
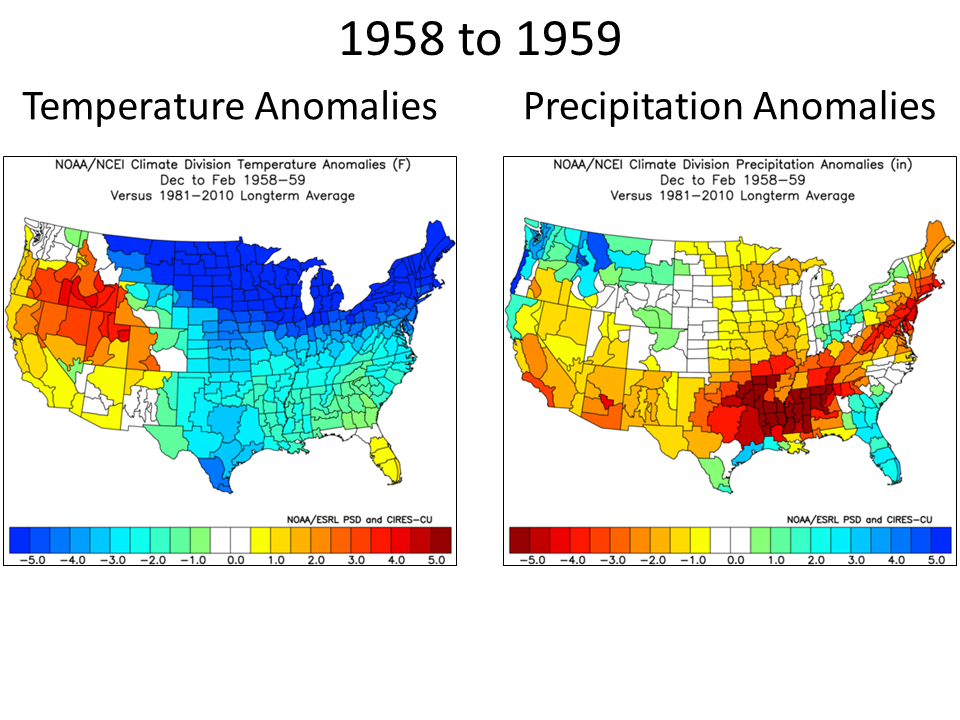
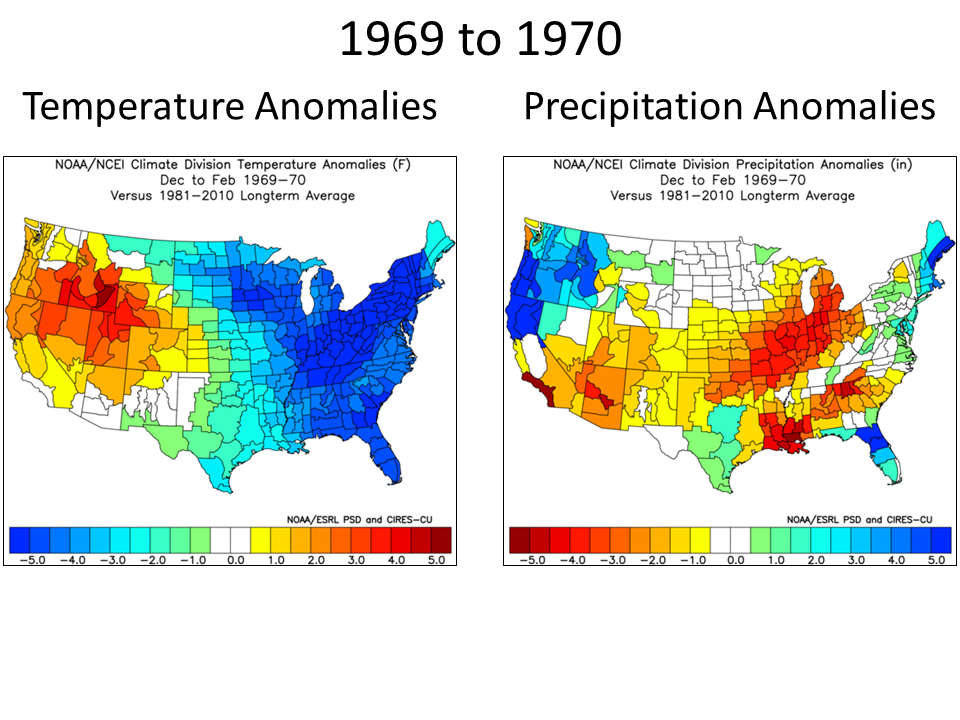
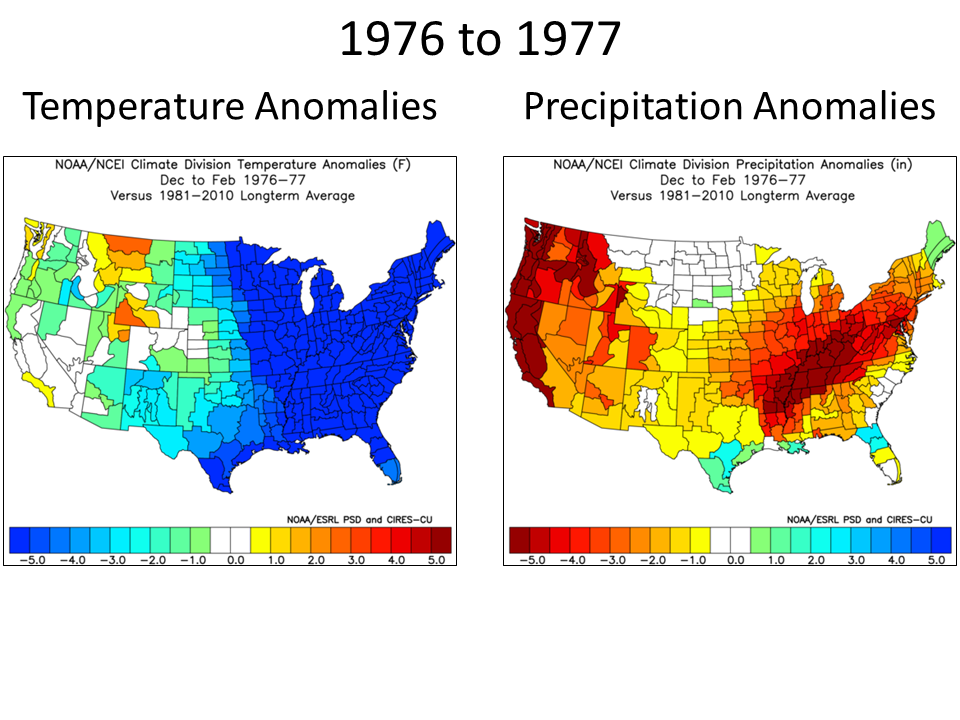
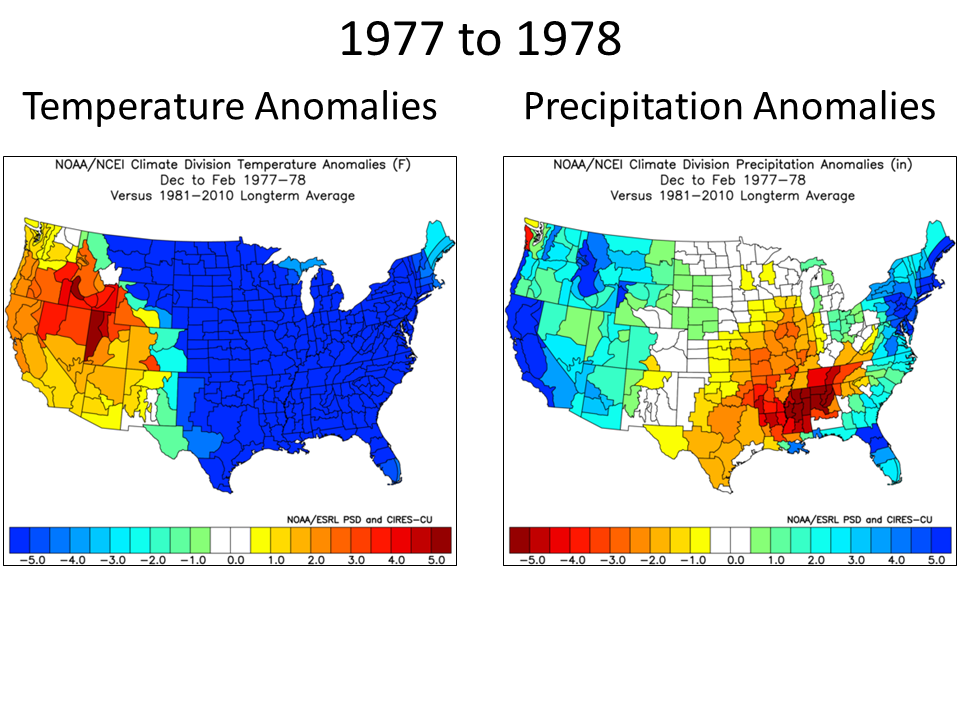
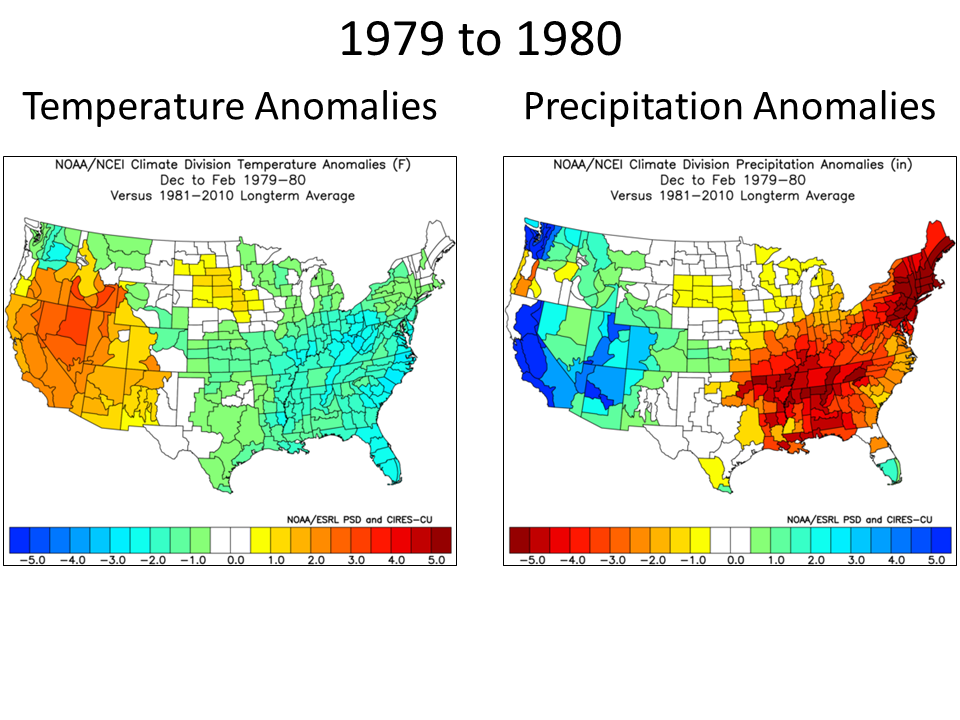
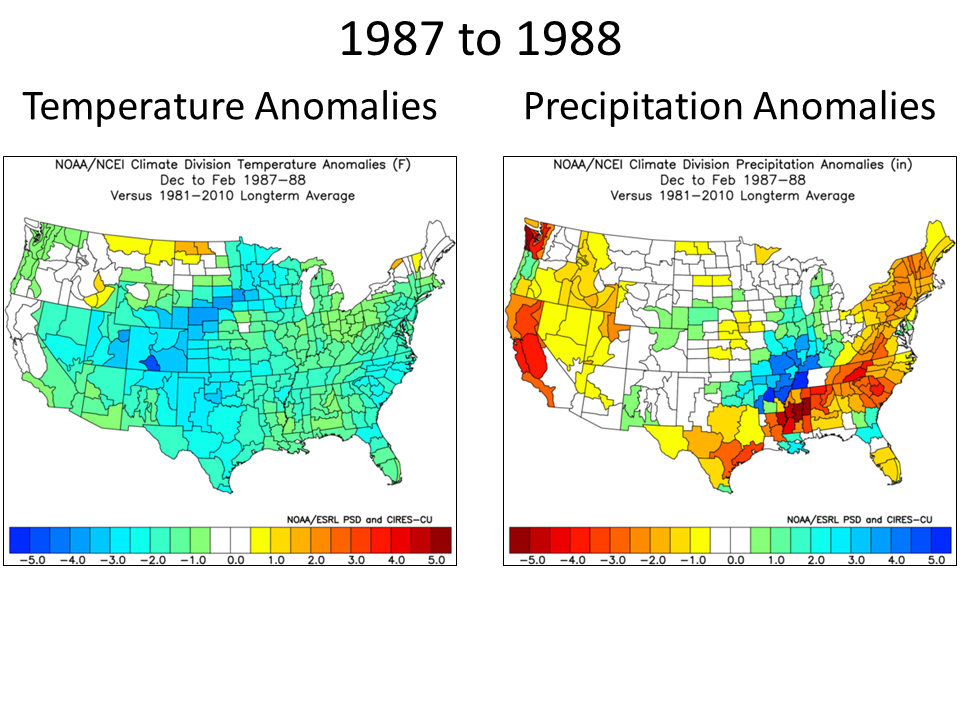
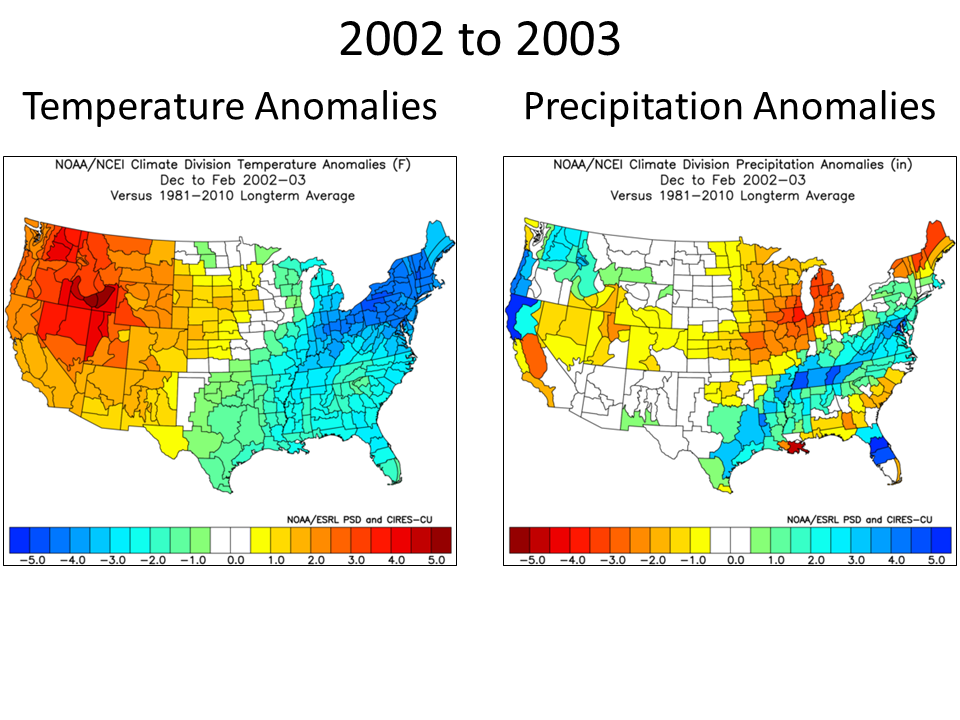
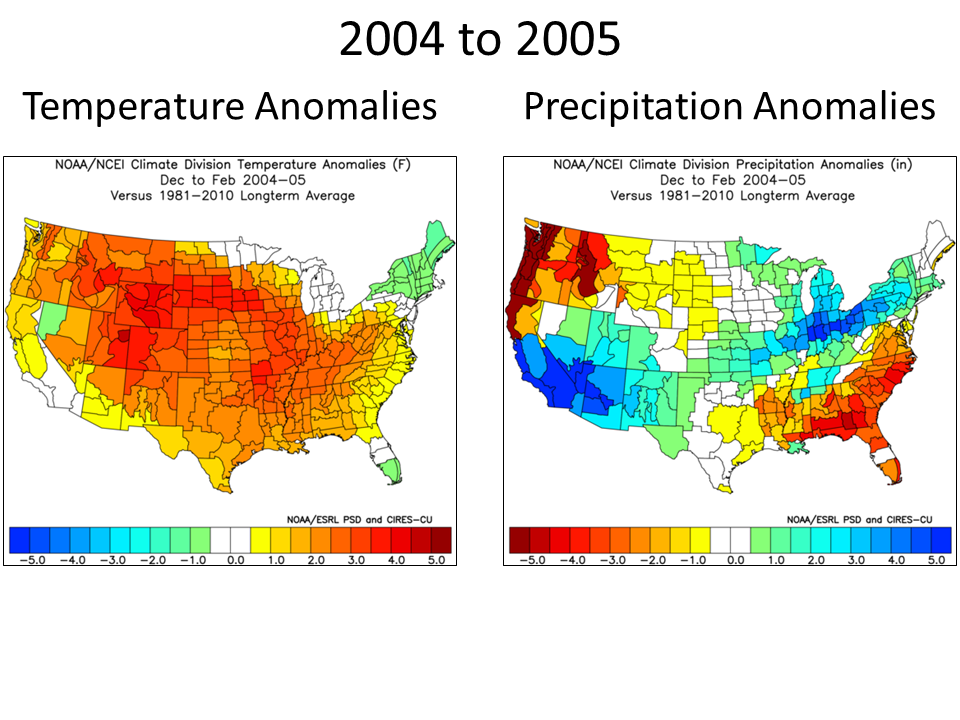
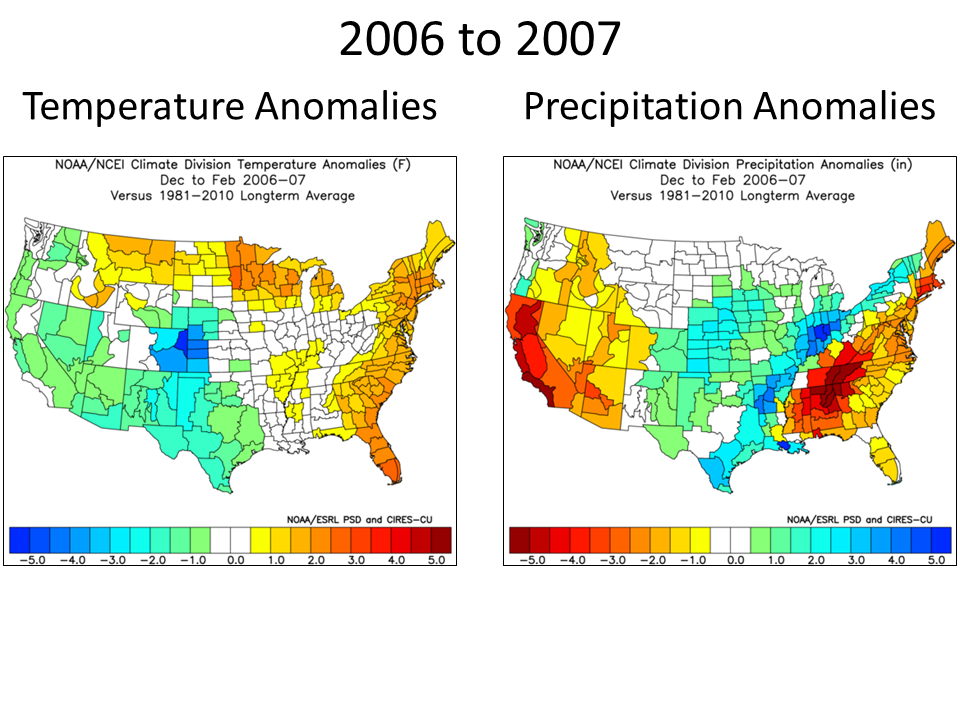
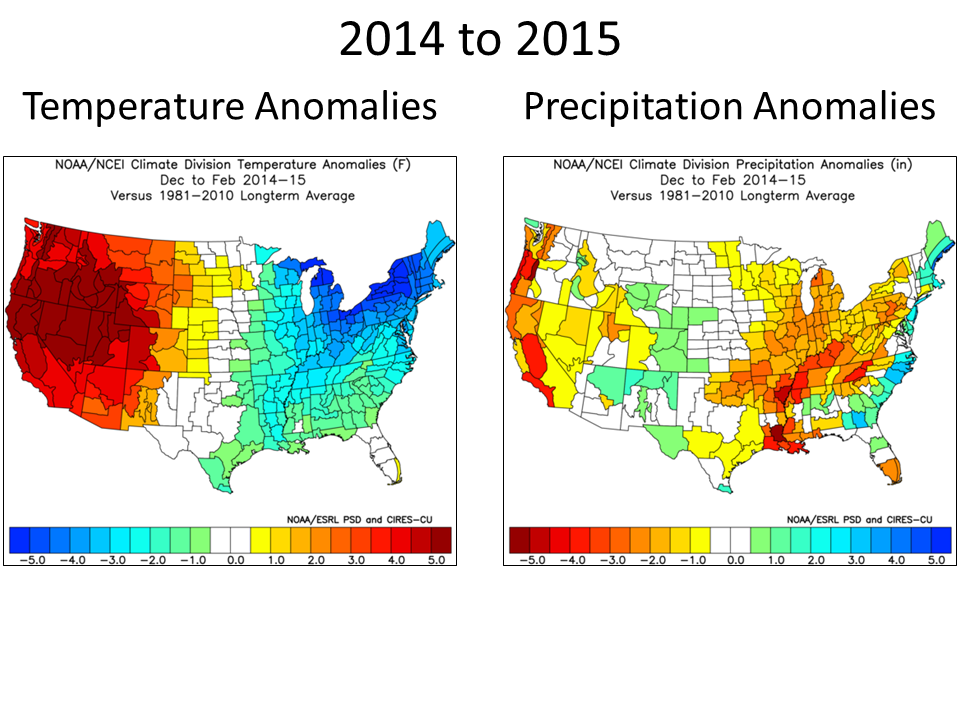
There have been 12 winters since 1950 where weak El Niño conditions have been observed. The images above are a composite of all the weak El Niño winter seasons. In total there have been 22 winters since 1950 El Niño conditions have been observed.
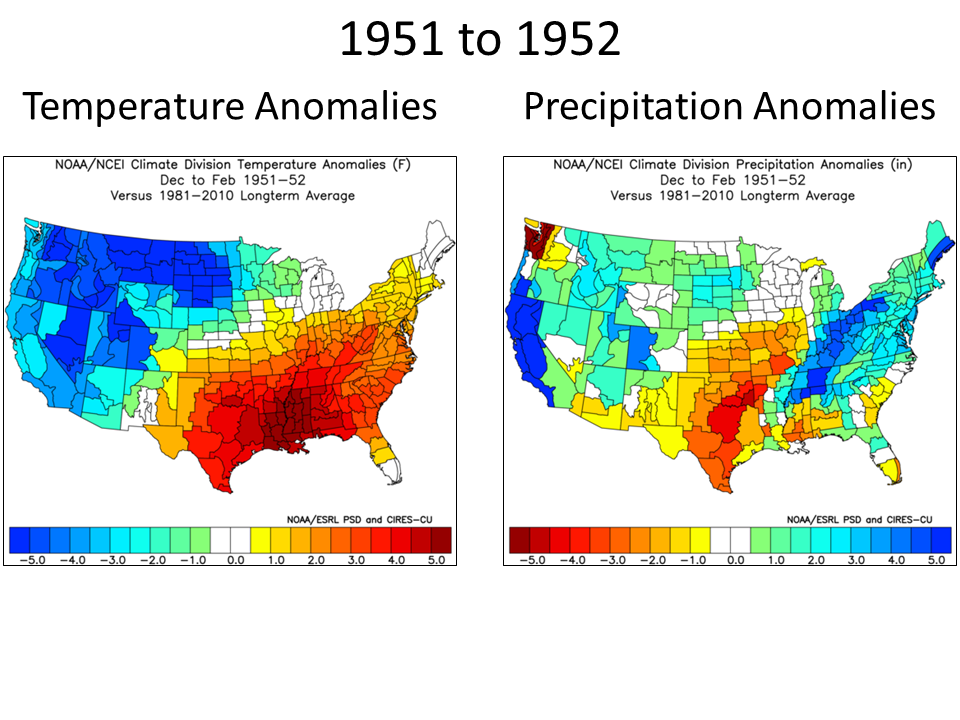
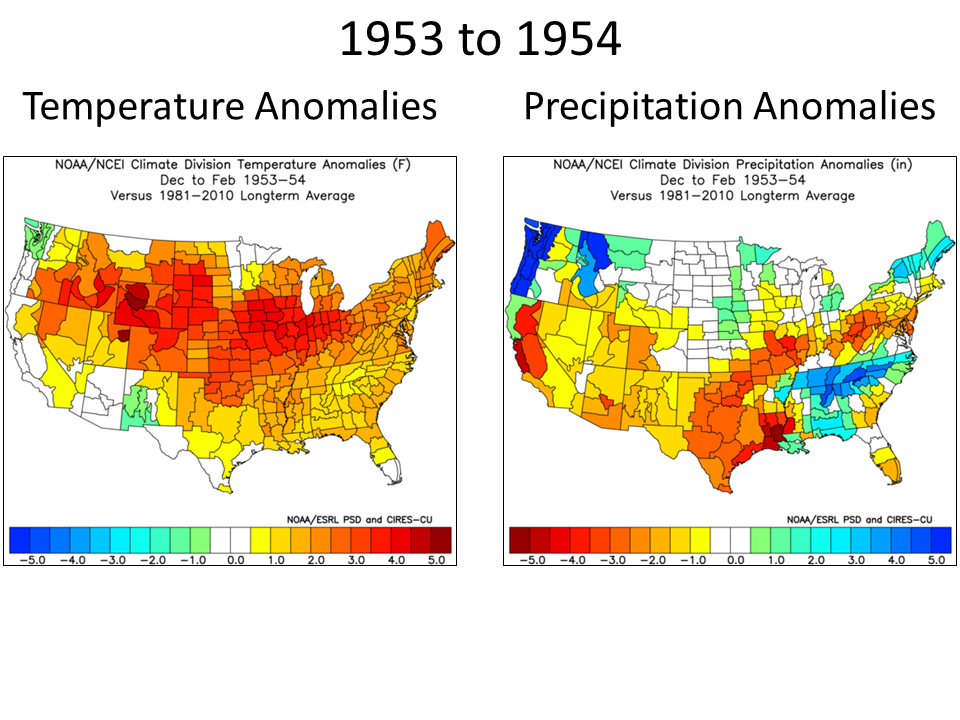
- The last 12 weak El Niño winters are; 1951-1952, 1953-1954, 1958-1959, 1969-1970, 1976-1977, 1977-1978, 1979-1980, 1987-1988, 2002-2003, 2004-2005, 2006-2007 and most recently 2014-2015.
- In general temperature have been colder than normal across the eastern half of the United States while the Intermountain West and West Coast have generally seen above normal temperatures.
- Precipitation has been near to below normal for the Northland. Elsewhere areas have seen near normal precipitation except for the southeast United States, Mid Atlantic, Southern Plains, Middle and Lower Mississippi River Valleys where generally precipitation has been below normal.
- Below are tables of the observed values for all Northland climate sites for all weak El Niño winters:
| Observed Average Winter Temperature (°F) |
| Location |
Year |
Normal (1981-2010) |
| 1951-1952 |
1952-1953 |
1958-1959 |
1969-1970 |
1976-1977 |
1977-1978 |
1979-1980 |
1987-1988 |
2002-2003 |
2004-2005 |
2006-2007 |
2014-2015 |
| Duluth, MN |
12.6 |
14.4 |
5.9 |
9.4 |
7.2 |
9.0 |
13.8 |
10.5 |
12.7 |
13.7 |
15.1 |
13.1 |
13.3 |
| International Falls, MN |
7.5 |
8.7 |
-0.8 |
5.3 |
1.3 |
0.9 |
8.4 |
6.9 |
8.8 |
7.9 |
10.1 |
7.3 |
8.1 |
| Brainerd, MN |
M |
M |
5.8 |
8.9 |
4.5 |
3.3 |
12.3 |
10.3 |
13.9 |
17.0 |
16.8 |
13.6 |
14.3 |
| Hibbing, MN |
12.6 |
13.9 |
6.1 |
8.2 |
4.6 |
6.3 |
11.4 |
8.9 |
10.0 |
10.0 |
12.1 |
11.2 |
9.9 |
| Ashland, WI |
15.9 |
19.4 |
9.1 |
13.2 |
9.9 |
12.1 |
17.4 |
15.2 |
16.0 |
16.7 |
18.4 |
14.8 |
16.4 |
| Note that cooler (warmer) colors indicate cooler (warmer) than normal temperatures |
| Observed Winter Precipitation (in) |
| Location |
Year |
Normal (1981-2010) |
| 1951-1952 |
1952-1953 |
1958-1959 |
1969-1970 |
1976-1977 |
1977-1978 |
1979-1980 |
1987-1988 |
2002-2003 |
2004-2005 |
2006-2007 |
2014-2015 |
| Duluth, MN |
2.84 |
4.38 |
1.60 |
3.61 |
1.22 |
2.18 |
2.27 |
1.58 |
1.27 |
5.70 |
2.91 |
2.10 |
2.98 |
| International Falls, MN |
2.00 |
3.74 |
1.87 |
2.44 |
2.27 |
1.99 |
1.88 |
0.78 |
0.75 |
3.20 |
1.84 |
2.87 |
2.00 |
| Brainerd, MN |
3.19 |
2.38 |
0.81 |
2.24 |
2.18 |
0.99 |
2.42 |
2.82 |
0.70 |
3.86 |
2.67 |
1.07 |
2.25 |
| Note that cooler (warmer) colors indicate above (below) normal precipitation |
| Observed Winter Snowfall (in) |
| Location |
Year |
Normal (1981-2010) |
| 1951-1952 |
1952-1953 |
1958-1959 |
1969-1970 |
1976-1977 |
1977-1978 |
1979-1980 |
1987-1988 |
2002-2003 |
2004-2005 |
2006-2007 |
2014-2015 |
| Duluth, MN |
38.7 |
57.8 |
31.5 |
55.2 |
21.7 |
36.9 |
34.2 |
30.3 |
15.7 |
83.2 |
34.3 |
23.4 |
49.5 |
| International Falls, MN |
23.8 |
52.1 |
23.9 |
31.2 |
37.8 |
27.7 |
33.5 |
27.7 |
16.4 |
53.8 |
22.8 |
47.4 |
40.8 |
| Brainerd, MN |
39.4 |
28.4 |
16.5 |
31.0 |
25.0 |
9.5 |
29.6 |
29.2 |
7.4 |
30.3 |
18.4 |
6.0 |
26.2 |
| Note that cooler (warmer) colors indicate above (below) normal snowfall |
Highlights:
- Duluth, International Falls, Brainerd and Ashland have generally seen cooler than normal temperatures.
- Duluth has generally seen below normal precipitation.
- International Falls and Brainerd have seen 6 winters where precipitation was drier than normal. Brainerd has seen 6 winters where precipitation was above normal. International Falls has seen one winter where precipitation was normal and 5 winters where precipitation was above normal.
- Duluth and International Falls have generally seen below normal snowfall.
- Brainerd has seen 6 winters where snowfall was above normal and 6 winters where snowfall was below normal.
|

