|
|
WFO DLH SA Display-Drought
|
This page contains maps and links to resources to monitor the drought.
For more information or media inquiries, please contact our office (email nws.duluth@noaa.gov, call 218-729-6697, or visit us on social media).
|
Drought Monitor and Outlooks
The Drought Monitor is released weekly on Thursday (using data as of the previous Tuesday) by the National Drought Mitigation Center at the University of Nebraska-Lincoln, NOAA, and USDA. For more information, including a discussion of the drought and additional maps, please visit https://droughtmonitor.unl.edu/
|
|
|
|
|
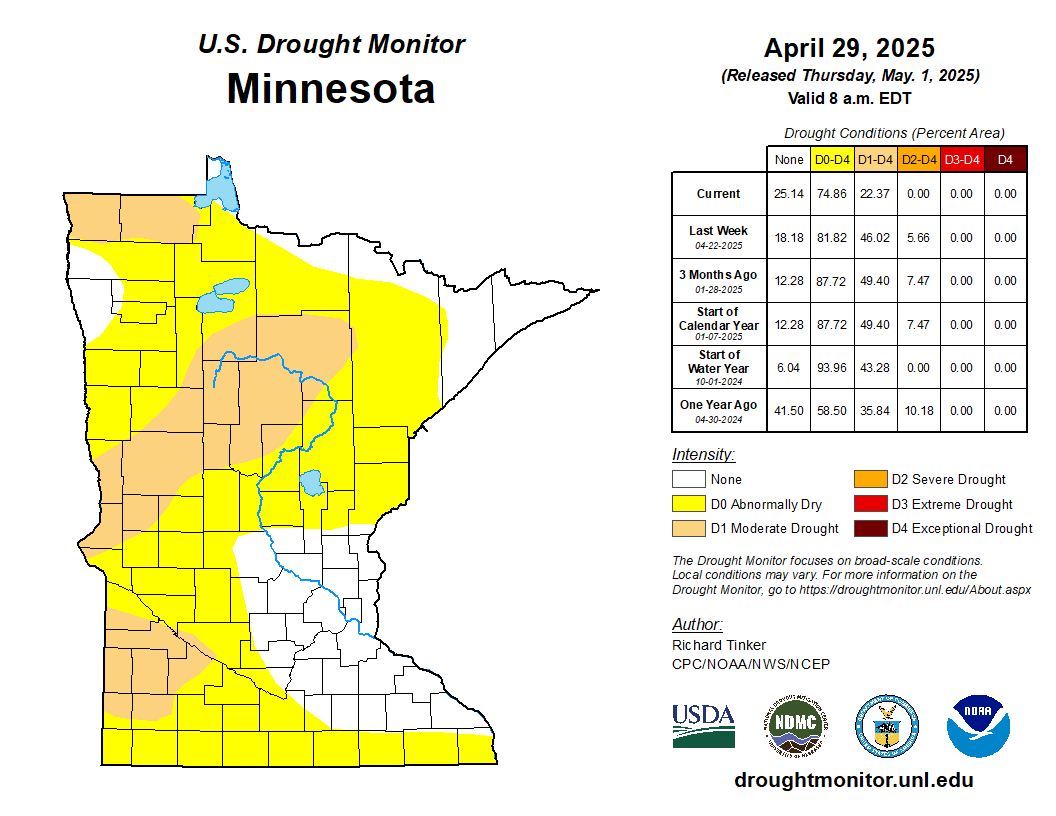
MN Drought Monitor
|
WI Drought Monitor
|
|

|
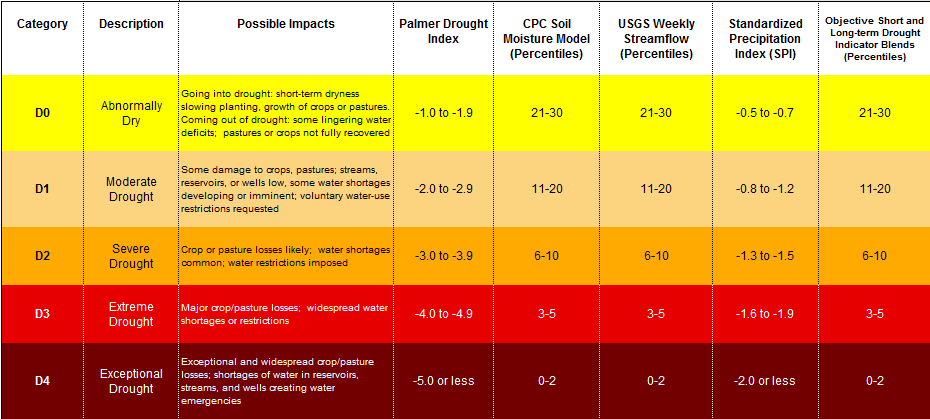
Drought Monitor Categories
|
|
7 Day % Normal
|
14 Day % Normal
|
30 Day % Normal
|
90 Day % Normal
|
Year To Date % Normal
|

|

|

|

|

|
|
7 Depart. Normal
|
14 Depart. Normal
|
30 Depart. Normal
|
90 Depart. Normal
|
YTD Depart. Normal
|

|

|

|
< 
|

|
|
Crop Moisture
|
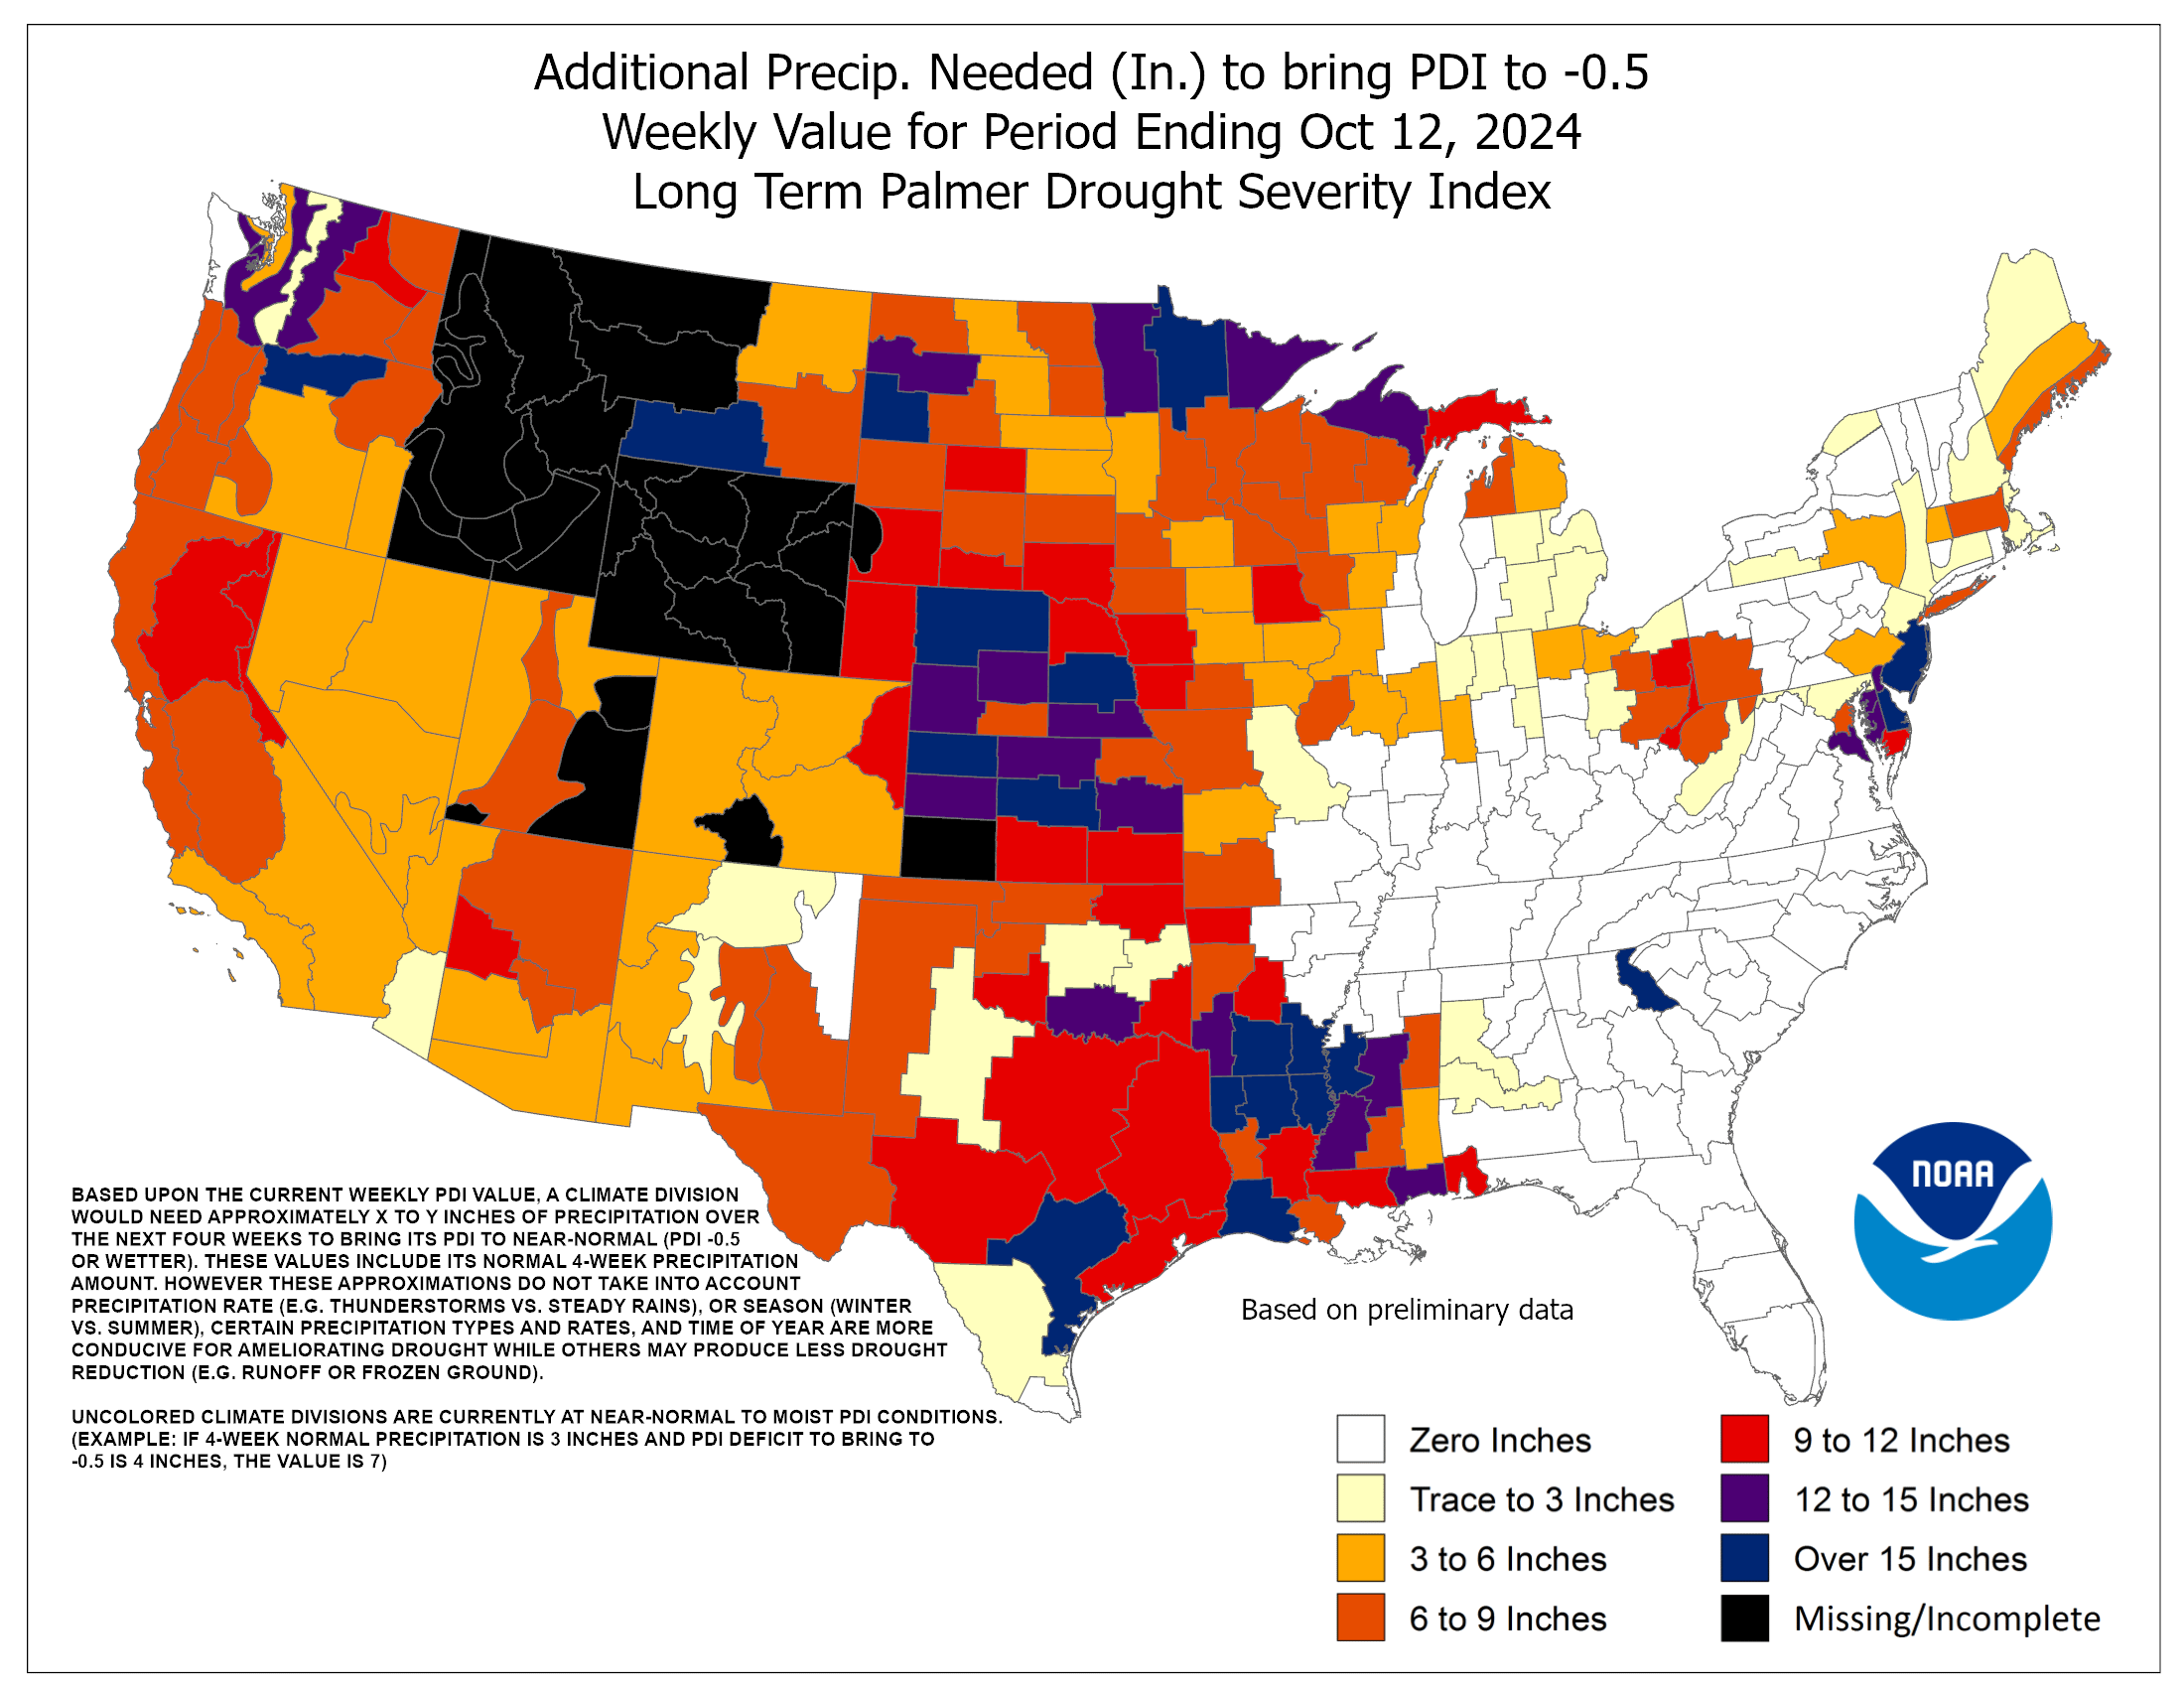
Palmer Index
|
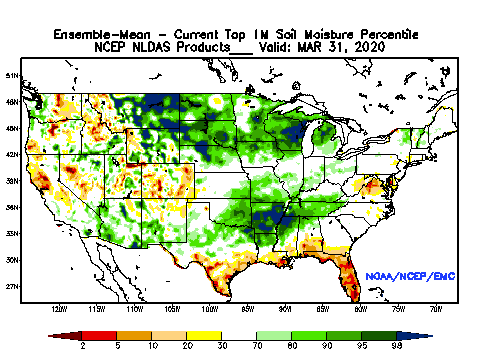
NLADS 1M Moisture Percentile
|
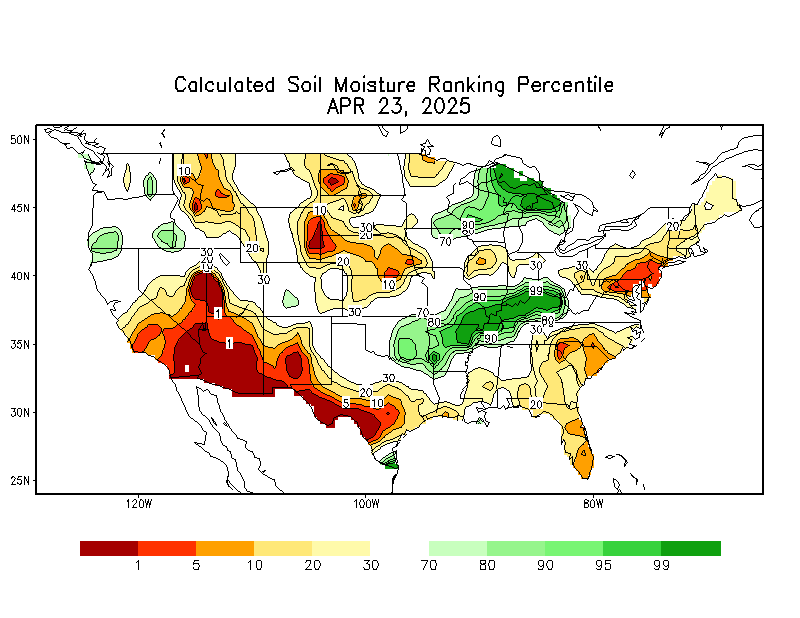
CPC Soil Moisture
|

|

|
|
|
|
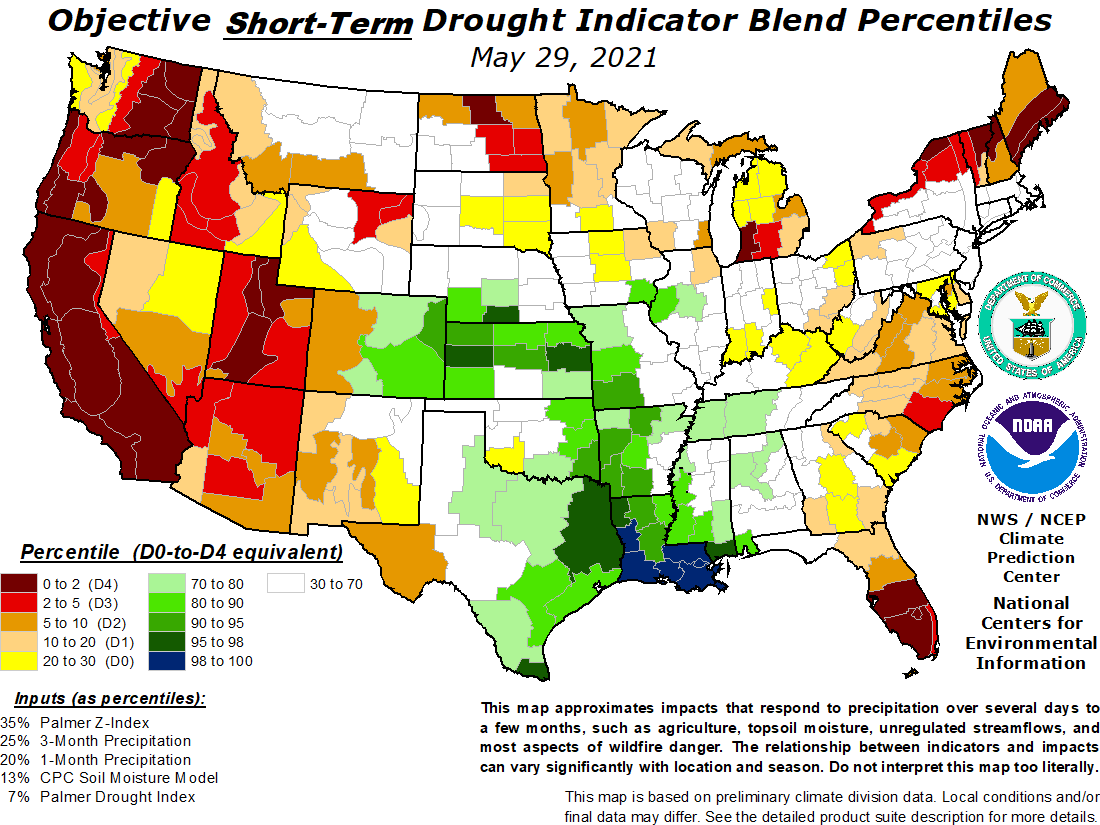
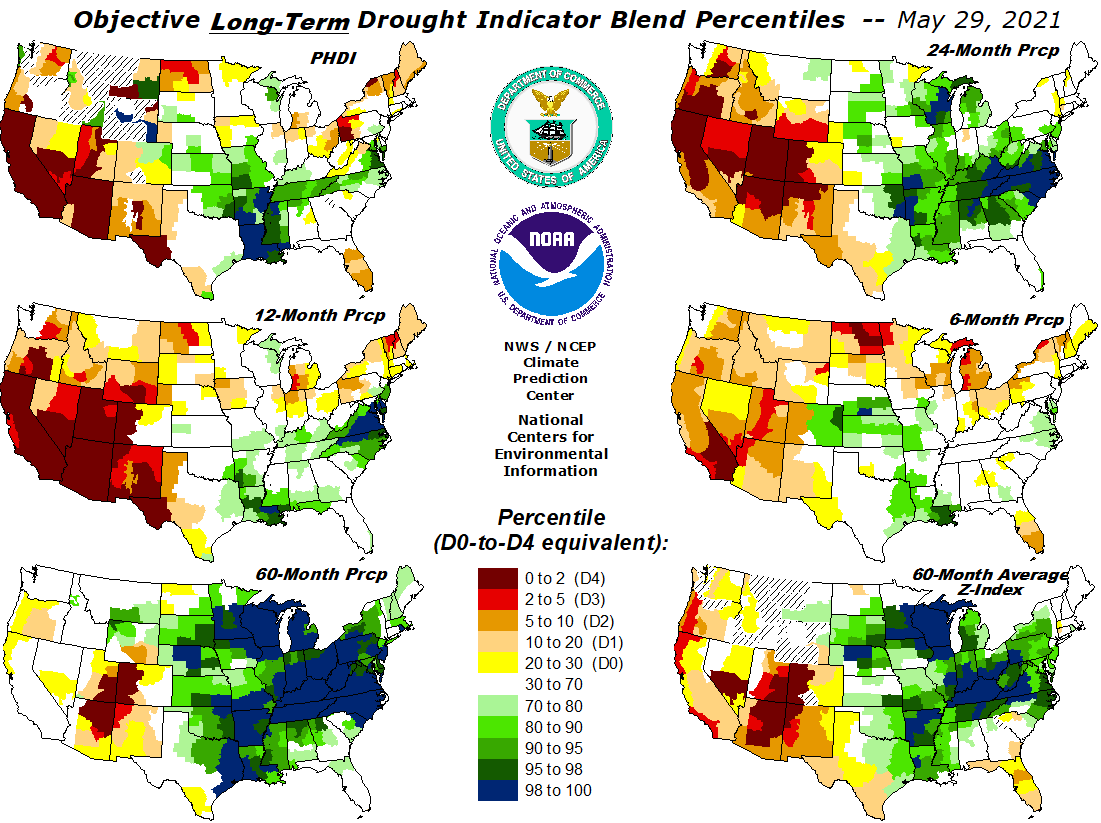
Short Term Drought Blend
|
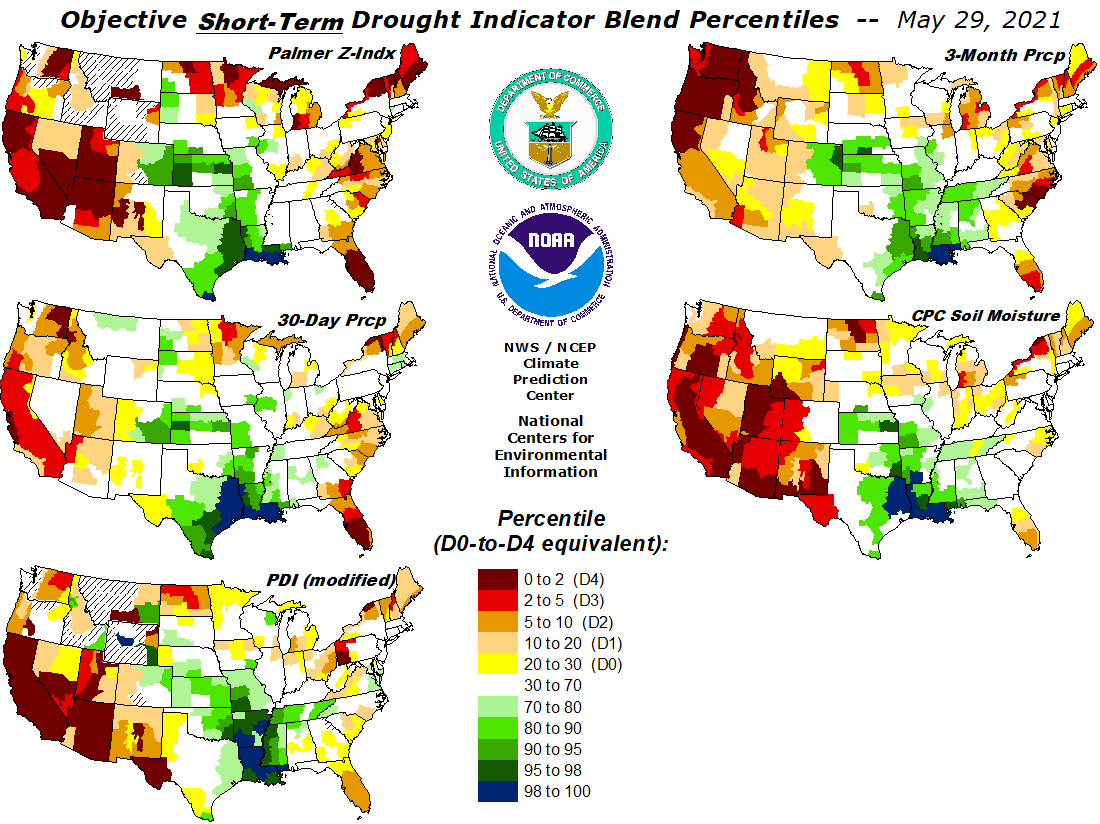
Short Term Components
|
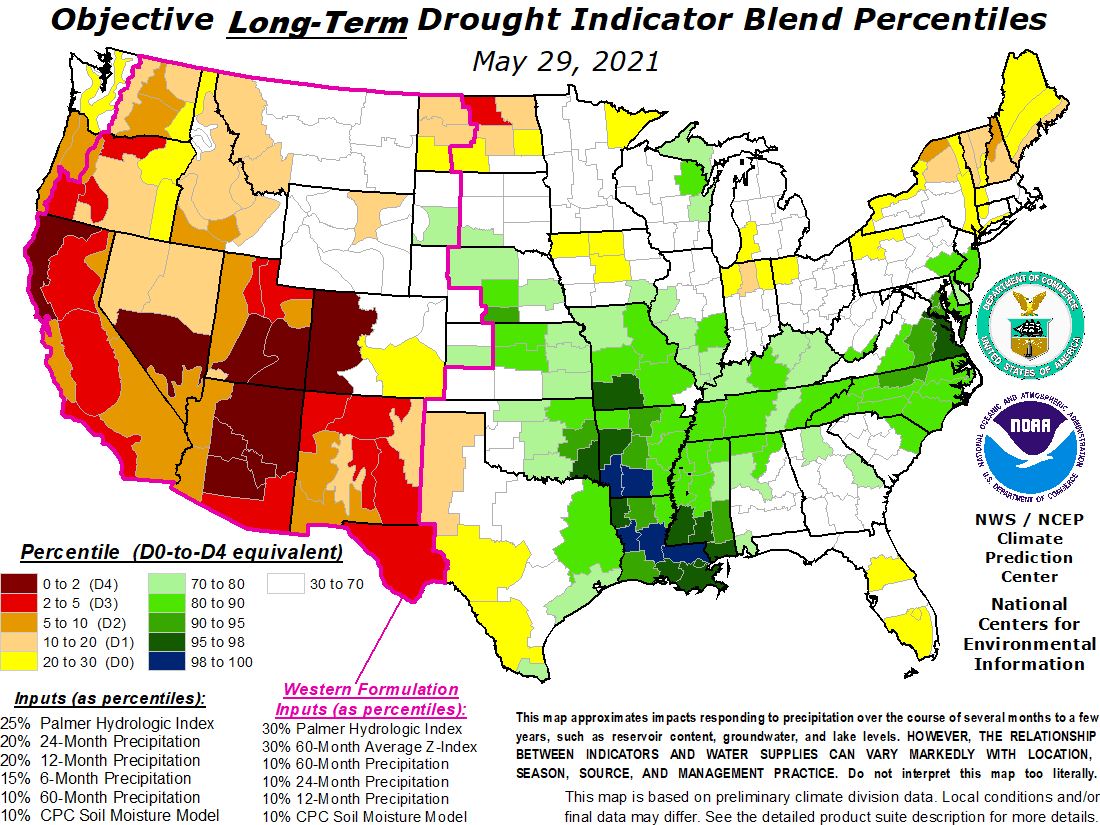
Long Term Drought Blend
|
Long Term Components
|
|
|
|
|
|
VegDri MN
|
VegDri WI
|

|

|
|
VegDri: Two variables related to general vegetation conditions – the Percent Average Seasonal Greenness (PASG) and Start of Season Anomaly (SOSA) – are calculated from satellite-based observations and incorporated into the VegDRI. Both variables are calculated from normalized difference vegetation index (NDVI) data acquired by NOAA’s Advanced Very High Resolution Radiometer (AVHRR). Climate-related variables incorporated into VegDRI include the Palmer Drought Severity Index (PDSI) and the Standardized Precipitation Index (SPI). Information about soils, land cover, land use, and the ecological setting are the types of biophysical data incorporated into VegDRI. This information is critical because the climate-vegetation response can vary depending on these different environmental characteristics. (More information and maps from the VegDri website.)
|
|
QuickDri MN
|
QuickDri WI
|

|

|
|
QuickDRI is a geospatial tool that characterizes the intensification of short-term drought condition patterns on a weekly basis across the continental United States (CONUS) at a 1-km gridded spatial resolution. The primary goal of QuickDRI is to serve as an "alarm" indicator of rapidly emerging events such as "flash drought" that manifest rapidly on the order of a few days to weeks, are often difficult to detect using traditional drought indicators, and can having devastating negative impacts on agriculture and natural resources.
|
|
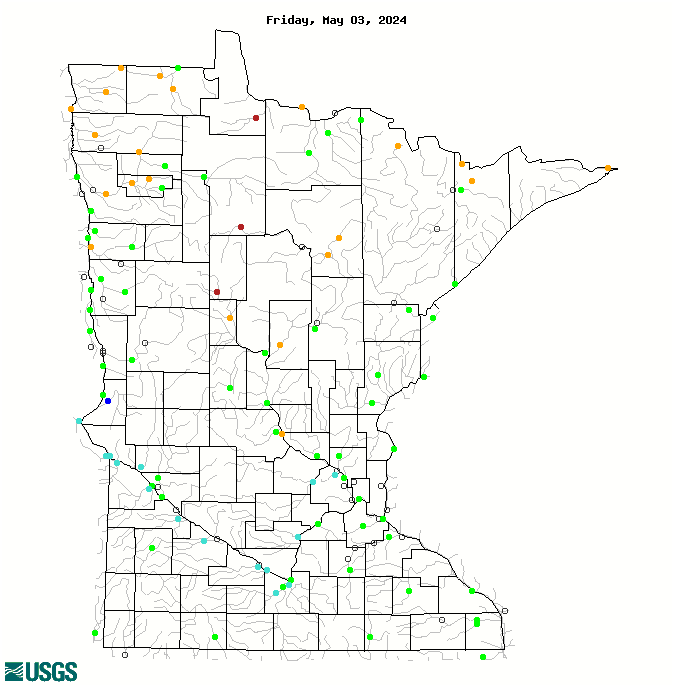
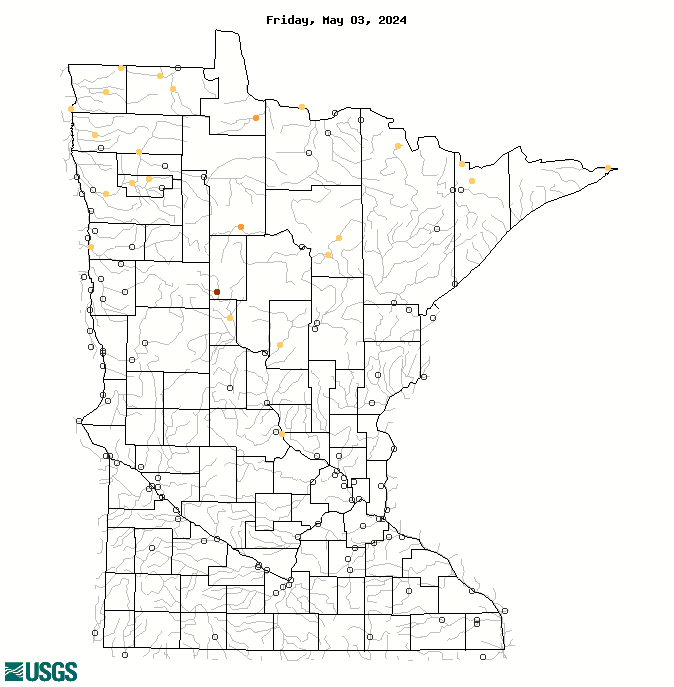
14 Day Streamflow Ranking
|
14 Day Streamflow to Drought Rating
|
|
|
.png)
|
.png)
|
|
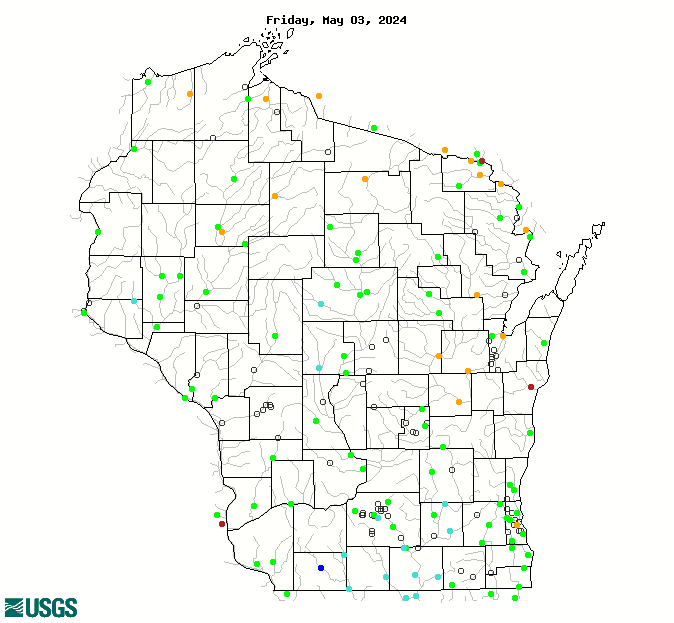
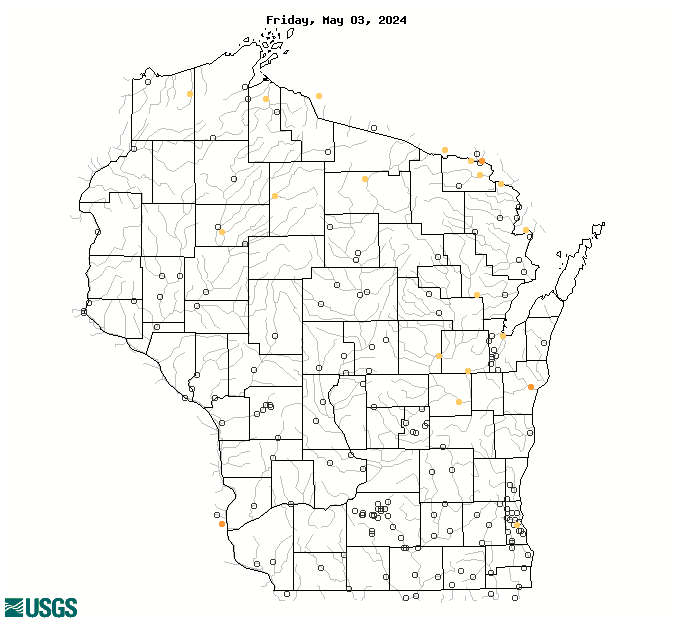
14 Day Streamflow Ranking
|
14 Day Streamflow to Drought Rating
|
|
|
|
|
|
|
Drought Information Statement
Drought Information Statements are issued when D2/Severe Drought or worse is present. (Check date on statement below.) For other drought statements from other offices, visit drought.gov.
|
|
|
|
|
112

AXUS73 KDLH 252304

DGTDLH

MNC001-017-021-031-035-061-071-075-115-137-WIC003-007-013-031-051-

099-113-129-022315-


Drought Information Statement

National Weather Service Duluth MN

604 PM CDT Thu Jun 25 2026


For the latest Drought Information Statement from the National

Weather Service in Duluth MN, see:

www.weather.gov/media/dlh/DGT/DGT_DLH_06252026.pdf


For the latest accessible, text-only Drought Information

Statement from the National Weather Service in Duluth MN, see:

www.weather.gov/media/dlh/DGT/DGT_DLH_06252026.txt


National Weather Service Duluth MN Drought Information Statement

web page: www.weather.gov/dlh/DroughtInformationStatement


$$
|