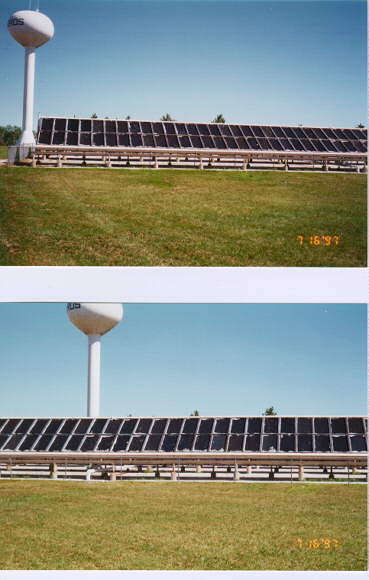
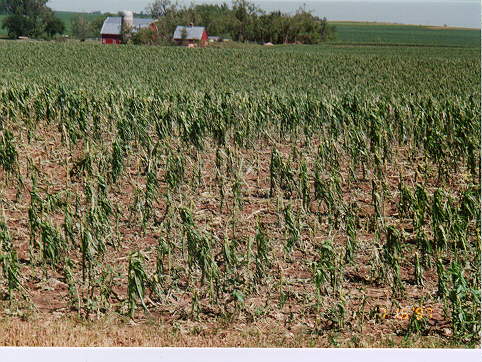
A devastating hail storm associated with a severe thunderstorm moved through Minnehaha county during the late afternoon hours on July 13, 1997 causing extensive damage to the EROS Data Center located near Baltic, SD. Baseball to softball size hail fell around 4:18 pm smashing numerous building windows and government vehicles. The hail also dented numerous satellite dishes and caused extensive roof damage including complete destruction of a 504 panel solar array. Officials at EROS estimated the cost of damage at 2.9 million dollars. Nearby fields were stripped of vegetation and farmers fields were cratered by the falling chunks of ice.
Check out the LANDSAT imagery of the damaged crop area caused by this storm!! This high resolution imagery was provided by the EROS Data Center.
This imagery was taken on July 16, 1997...3 days after the EROS hailstorm. The white streak running southwest to northeast is not hail. This imagery has been color enhanced such that dead vegetation with a low water content shows as white (highlighted by arrows). Surrounding live crops are red. Green areas are high reflectivity caused by buildings, streets, etc. and blue areas are water.
This storm had plenty of advanced warning. At 3:50 pm forecasters at the National Weather Service Office in Sioux Falls issued a severe thunderstorm warning for all of Minnehaha county (which included EROS) effective until 4:20 pm. This warning mentioned the storm would move through the towns of Crooks, Renner, and Lyons between 4:05 and 4:10 pm. At 4:05 pm a severe weather statement also mentioned the storm was near Crooks moving northeast at 30 mph which would put EROS directly in its path. At 4:21 pm the severe thunderstorm warning was extended until 4:50 pm for northeast Minnehaha county.
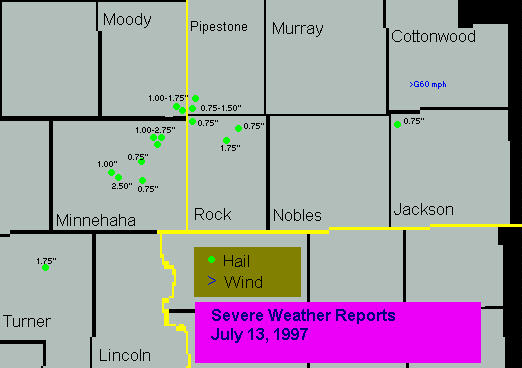
This was a significant event for the immediate area just north of Sioux Falls but most of the storm reports occurred with just one storm as it tracked northeast from near Hartford into Pipestone and Rock counties during a 2 hour period. The most intense part of the storm occurred as it moved over the EROS Data Center. During this time the storm collided with an outflow boundary from another, weaker storm that had moved north across southwest Minnesota.
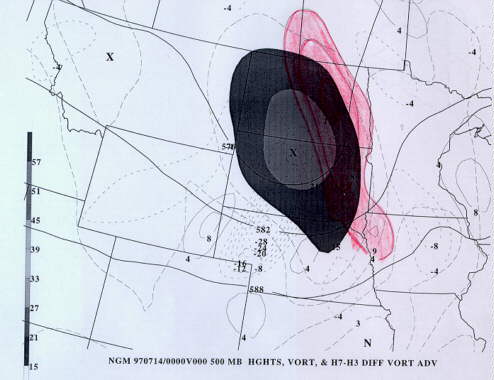
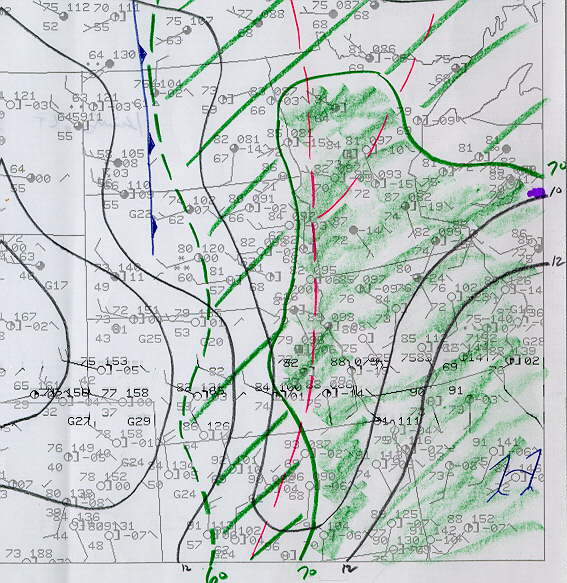
The overall synoptic pattern was comprised of a strong short wave trough aloft with positive differential vorticity advection (shaded red) moving through the state near the time of the storms. At the surface a trough was located over eastern South Dakota with very moist air preceding the trough (shaded green). Surface dewpoints were in the lower 70's with afternoon temperatures in the mid to upper 80s. The combination of moist unstable air at low levels and cold advection aloft made for unstable lapse rates over eastern South Dakota and southern Minnesota.
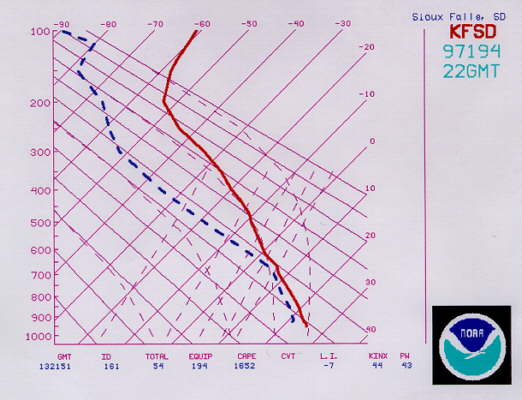
Recently satellite derived sounding data has been made available to field forecast offices. This data is extremely useful to forecasters because it provides them with frequent analyses and fills large gaps in the data network that conventional, balloon-launched soundings miss. This data can be very beneficial in monitoring the atmospheric stability and moisture profiles which can change quickly prior to a severe weather event because the soundings are derived every hour. One caveat to this data is that there must be a relatively cloud free area for the satellite sounder to sense the atmosphere. Thus this data will not be available in cloudy areas.
The derived sounding for Sioux Falls at 2200 UTC (5:00 pm) showed a deep layer of moisture in the low levels with much drier air in the mid and upper levels. Lapse rates were conditionally unstable in the low levels and the CAPE was 1652 J/kg with a lifted index of -7. A horizontal plot of derived CAPE surrounding the storm overlaid on the satellite picture at 2100 UTC (4:00 PM) showed high values (1300-1700 J/kg) in the environment near the storm, especially over southwest Minnesota. While these values are not especially strong compared with other severe weather events it does show the utility of sounding derived CAPE's due to the fine spatial (50 km) and temporal (every hour) resolution. The lifted index analysis also shows values of -7 to -9 over southeast South Dakota and -5 to -6 over southern Minnesota. Although both CAPE and lifted index values were much higher farther south over Nebraska there was too much of a cap (warm air) in the mid levels which prevented convection to form there.
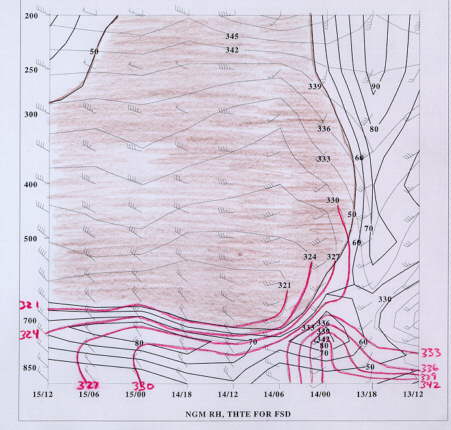
By late in the afternoon the upper trough had moved far enough east such that cold advection aloft was helping to destabilize the atmosphere. The satellite derived plot of 500 mb temperature showed that the storms formed along the gradient where temperatures were decreasing from southern Minnesota into central South Dakota. In addition the satellite derived wind field overlaid onto the water vapor imagery showed that drier air in the mid levels was moving in behind the trough and over the abundant low level moisture to provide convective instability. The time section for Sioux Falls from the 1200 UTC NGM did indicate theta-e decreasing with height (red lines) which indicated that conditions by 0000 UTC were forecast to become convectively unstable. This also is reflected in the relative humidity fields with RH<50% in the mid and upper levels (shaded brown) forecast to move over the abundant low level moisture that was in place.
The storm's close proximity to the Sioux Falls Doppler radar allowed forecasters to observe fine structure within the storm environment including outflow boundaries, strong low level divergence associated with the rain/hail shaft, a bounded weak echo region (BWER), and an outflow boundary which collided with the main storm just before it hit EROS.
MERGING OUTFLOW BOUNDARIES
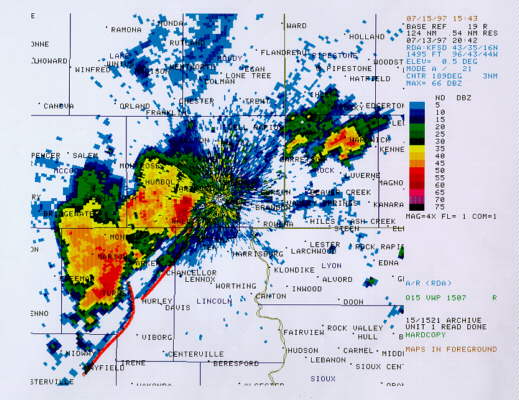
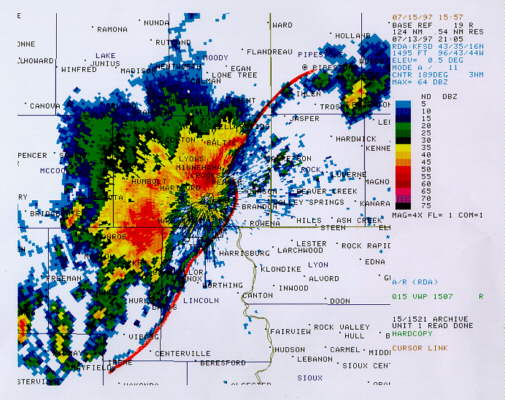
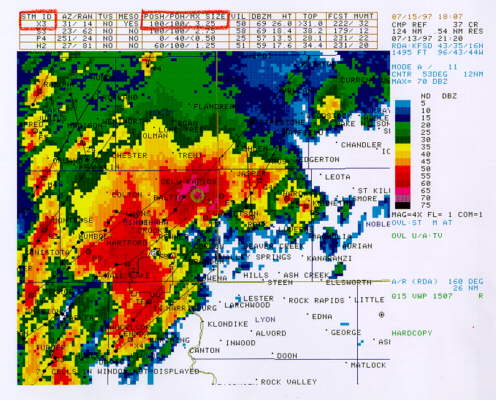
We begin this radar tour with a snapshot of 0.5 reflectivity at 20:42 UTC (3:42 pm) from the National Weather Service Doppler radar based at Joe Foss Field. Most of the severe weather occurred with the northern storm including the large hail at EROS. While there was only one report of large hail (1.75" diameter) with the southern storm as it moved over Parker in northern Turner county, at this time, this storm was much stronger than the northern storm.
One of the reasons why the southern storm did not produce large hail after the initial report may have been due to the fact that an outflow boundary from the northern storm overtook and outran the southern storm choking off its supply of moist, unstable air on which the southern storm was feeding. You can see this outflow boundary as a fine line of reflectivity extending southwest from the storm core towards the southern storm (marked by orange highlight). You can also see the outflow boundary associated with the southern storm which also outran this storm and merged with the boundary form the northern storm to produce very strong, non-severe winds (gusts <58 mph) across southern Minnehaha and northern Turner county.
Note also the weak thunderstorms over Rock county in southwest Minnesota. These storms played a significant role in strengthening the northern storm as it moved toward EROS.
COLLISION OF STORM WITH OUTFLOW BOUNDARY
Until the northern storm struck the EROS data center around 4:18 pm it was not producing much large hail. There was only one report of 2.50" diameter hail (tennis ball size) which fell 5 southeast of Hartford at 3:47 pm. Other reports of hail until this time were generally between 0.75" and 1.00". One explanation of why the storm suddenly increased in strength and formed a hook echo as it reached EROS was that the storm appeared to have collided with an outflow boundary, originating from weak convection over southwest Minnesota, that was moving west. Animation of 0.5 reflectivity clearly showed that this boundary emanated from a weak storm that was moving north from Rock into Pipestone counties. This boundary traveled west and collided with the strong thunderstorm that was moving northeast over central Minnehaha county. You can see the boundary (highlighted in orange) extending southwest from the weak thunderstorm into the core of the strong thunderstorm located just to the northeast of the Sioux Falls airport at 21:05 UTC (4:05 pm). You can also see the merged outflow boundaries from the two storms over southern Minnehaha county trailing southwest across western Lincoln county (also highlighted in orange).
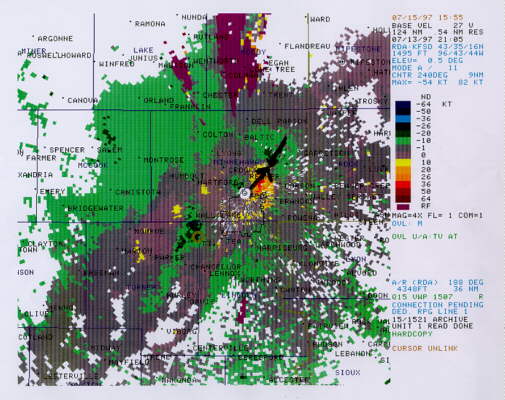
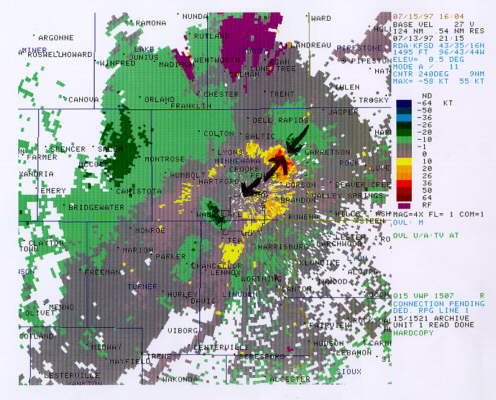
This collision caused a brief intensification of the storm and a rapid increase in surface convergence into the storm. It also increased cyclonic circulation in low levels of the storm. You can see the strong low level convergence in the 0.5 base velocity product at 21:05 UTC (4:05 pm). In this product green colors show air flow toward the radar and yellows and reds show air flow away from the radar. Just to the northeast of the radar there is a green and yellow couplet which signified strong convergence into the leading edge of the storm (direction shown by arrows). The green, inbound colors represent a rush of airflow coming towards the thunderstorm behind the westward moving outflow boundary. The yellow and red colors represent the downburst winds associated with the descending rain and large hail. As the two opposing flows met, strong low level convergence was created which helped to increase the strength of the updraft resulting in stronger reflectivity and larger hail.
INCREASE IN LOW LEVEL CIRCULATION AND GENERATION OF A BWER
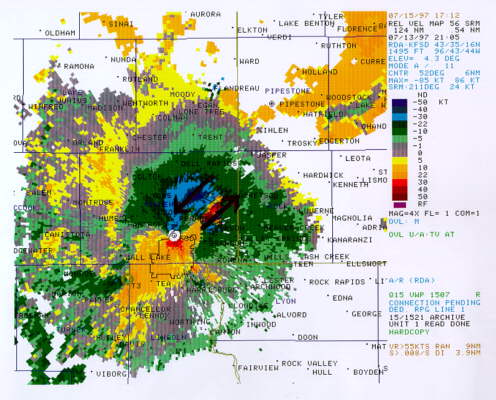
During this time and just above the surface the cyclonic circulation also increased rapidly. The SRM product at 4.3 elevation showed very strong inbound velocity adjacent to very strong outbound velocity at 21:05 UTC (4:05 PM). The dark blue colors indicated >50 knot winds toward the radar and the dark red colors show >50 knot winds away from the radar (arrows indicate direction of flow). The rotational shear between this couplet was >55 knots indicating a strong mesocyclone at 5,788 feet with a diameter of 3.9 miles. This circulation was centered over the low level convergent area and at the intersection of the outflow boundary with the storm core.
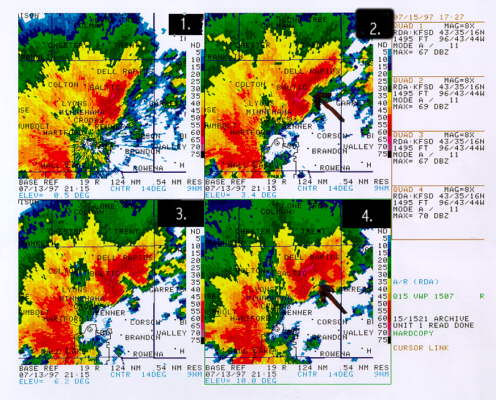
The strong rotation in the low and mid levels of the storm helped to form a Bounded Weak Echo Region (BWER). A BWER is a significant severe weather signature because it represents a very strong, rotating updraft which helps circulate the hailstones and allow them to grow. A 4-panel view of reflectivity showed the BWER nicely at 21:15 UTC (4:15 pm) just before the 2.75" hail fell at EROS. This view shows 4 slices of reflectivity through the storm with increasing elevation from panel 1 to panel 4. In panels 1 and 2 you can see a hook echo and inflow notch on the east side of he storm (arrow in panel 2). In panel 4 there is a hole of weak reflectivity (green) completely surrounded by higher reflectivity (yellow) located over the inflow notch at low levels signifying the BWER (arrow) at 13,748 feet. The composite reflectivity product indicated a 100% probability of severe hail (>0.75") with this storm (marked X3) and a maximum hail size of 3.25" diameter (highlighted in orange in the table at the top).
The base velocity product at 0.5 at this time also showed continued strong convergence (direction of arrows) within the inflow notch at the inflection point between the rear flank downdraft on the south side of the storm and the westward moving outflow boundary from weak storms to the east. To the southwest of this convergent area you can also see divergence at low levels located just to the northeast of the radar site with weak approaching velocities and strong receding velocity. This low level divergence was associated with the rain/hail shaft and rain-cooled air spreading out beneath the thunderstorm.
After the storm struck EROS it continued to move northeast into Pipestone, Moody, and Rock counties producing large hail. At 4:45 pm this storm dropped 1.50" to 1.75" diameter hail just west of Jasper, MN which lacerated cattle and turned the ground white. Only one other account of large hail (>1.50") occurred after 4:45 pm (1.75" in Hardwick, MN at 5:15 pm) with most remaining hail reports <1.00" diameter.
Originally posted and last updated 4-30-1998 by Ron Holmes(former Science and Operations Officer at NWS Sioux Falls)


 Weather Story
 Weather Map
 Local Radar
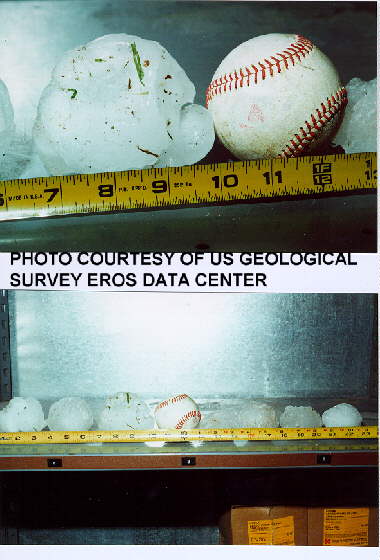