The meteorological autumn (September - November) of 2011 will end up being one of the driest on record for many locations across southeastern South Dakota, northeastern Nebraska, northwestern Iowa, and southwestern Minnesota. The table below shows the preliminary Sep-Nov 2011 precipitation totals for numerous locations that will end up ranking in the top 5 driest, as well as the current or previous record dry autumn, the normal autumn precipitation, and the 2011 percent of normal.
| Location | Sep-Nov 2011 Total | Rank | Record | Year | Normal | % of Normal |
| Arlington SD | 0.21 | 1st | 0.65 | 1974 | 5.20 | 4.0 |
| Primghar IA | 0.23 | 1st | 0.36 | 1945 | 6.09 | 3.8 |
| Colton SD | 0.23 | 1st | 0.63 | 2009 | 6.14 | 3.7 |
| Lake Wilson MN | 0.26 | 1st | 1.43 | 1980 | 6.44 | 4.0 |
| Tracy MN | 0.26 | 1st | 0.69 | 1967 | 5.96 | 4.4 |
| Peterson IA | 0.28 | 1st | 0.54 | 2000 | 6.39 | 4.4 |
| Alexandria SD | 0.28 | 1st | 0.52 | 1918 | 4.75 | 5.9 |
| Rock Rapids IA | 0.39 | 1st | 0.83 | 1952 | 5.88 | 6.6 |
| Storm Lake IA | 0.47 | 1st | 1.31 | 1906 | 6.54 | 7.2 |
| Emerson NE | 0.48 | 1st | 1.19 | 1999 | 6.28 | 7.6 |
| Minneota MN | 0.52 | 1st | 0.68 | 1980 | 5.71 | 9.1 |
| Lake Park IA | 0.53 | 1st | 0.54 | 1952 | 6.11 | 8.7 |
| Sioux City IA | 0.59 | 1st | 0.60 | 1939 | 5.70 | 10.4 |
| Milford IA | 0.59 | 1st | 0.96 | 1952 | 6.38 | 9.2 |
| Ocheyedan IA | 0.62 | 1st | 2.15 | 1999 | 6.44 | 9.6 |
| Flandreau SD | 0.78 | 1st | 0.83 | 1952 | 5.34 | 14.6 |
| Marshall MN | 0.79 | 1st | 0.99 | 1967 | 5.76 | 13.7 |
| Lakefield MN | 0.84 | 1st | 2.80 | 1948 | 6.12 | 13.7 |
| Sibley IA | 0.84 | 1st | 0.99 | 1952 | 6.16 | 13.6 |
| Sioux Falls SD | 0.87 | 1st | 1.02 | 1952 | 5.59 | 15.6 |
| Windom MN | 0.89 | 1st | 1.63 | 1952 | 6.38 | 13.9 |
| Worthington MN | 1.01 | 1st | 1.19 | 1999 | 6.34 | 15.9 |
| Sioux Center IA | 1.52 | 1st | 1.63 | 1999 | 6.34 | 24.0 |
| Iroquois SD | 0.22 | 2nd | 0.07 * | 1999 | 4.48 | 4.9 |
| Wessington SD | 0.55 | 2nd | 0.51 * | 1968 | 4.15 | 13.3 |
| Newcastle NE | 1.04 | 2nd | 0.65 | 1952 | 5.93 | 17.5 |
| Montrose SD | 1.07 | 2nd | 0.60 * | 2002 | 5.70 | 18.8 |
| Akron IA | 1.11 | 2nd | 1.04 | 1939 | 5.83 | 19.0 |
| Sheldon IA | 1.11 | 2nd | 0.91 | 1952 | 6.35 | 17.5 |
| Holstein IA | 1.15 | 2nd | 0.90 | 1958 | 6.52 | 17.6 |
| Rock Valley IA | 1.17 | 2nd | 0.94 | 1999 | 6.53 | 17.9 |
| Menno SD | 1.17 | 2nd | 1.06 | 1933 | 4.99 | 23.4 |
| Spencer IA | 1.18 | 2nd | 1.14 * | 1980 | 6.36 | 18.6 |
| Sioux Rapids IA | 1.37 | 2nd | 1.18 | 1952 | 6.48 | 21.1 |
| Howard SD | 0.23 | 3rd | 0.15 * | 1917 | 4.85 | 4.7 |
| Platte SD | 0.30 | 3rd | 0.00 * | 1952 | 4.77 | 6.3 |
| Brookings SD | 0.78 | 3rd | 0.65 | 1974 | 4.61 | 16.9 |
| Cherokee IA | 0.79 | 3rd | 0.08 * | 1966 | 6.48 | 12.2 |
| Pipestone MN | 1.29 | 3rd | 1.16 | 1952 | 5.84 | 22.1 |
| Pickstown SD | 1.34 | 3rd | 0.74 | 1974 | 4.79 | 28.0 |
| Marion SD | 1.43 | 3rd | 0.94 | 1952 | 5.58 | 25.6 |
| Hawarden IA | 1.34 | 4th | 1.09 | 1952 | 6.16 | 21.8 |
| Wakefield NE | 1.54 | 4th | 0.70 | 1939 | 5.92 | 26.0 |
| Sanborn IA | 1.95 | 5th | 0.80 | 1952 | 6.40 | 30.5 |
| * Missing Data for at least one month | ||||||
| 2011 is Preliminary Data - subject to review and updates | ||||||
One interesting bit of trivia that showed up when researching the records is that for many locations, one of the previous driest autumns was in 1952. This happened to occur following a very wet spring and summer in the Missouri River basin, and most river gauges on the Missouri had record flooding that year. That is similar to 2011, with major spring and summer flooding on the Missouri River, followed by an extremely dry autumn.


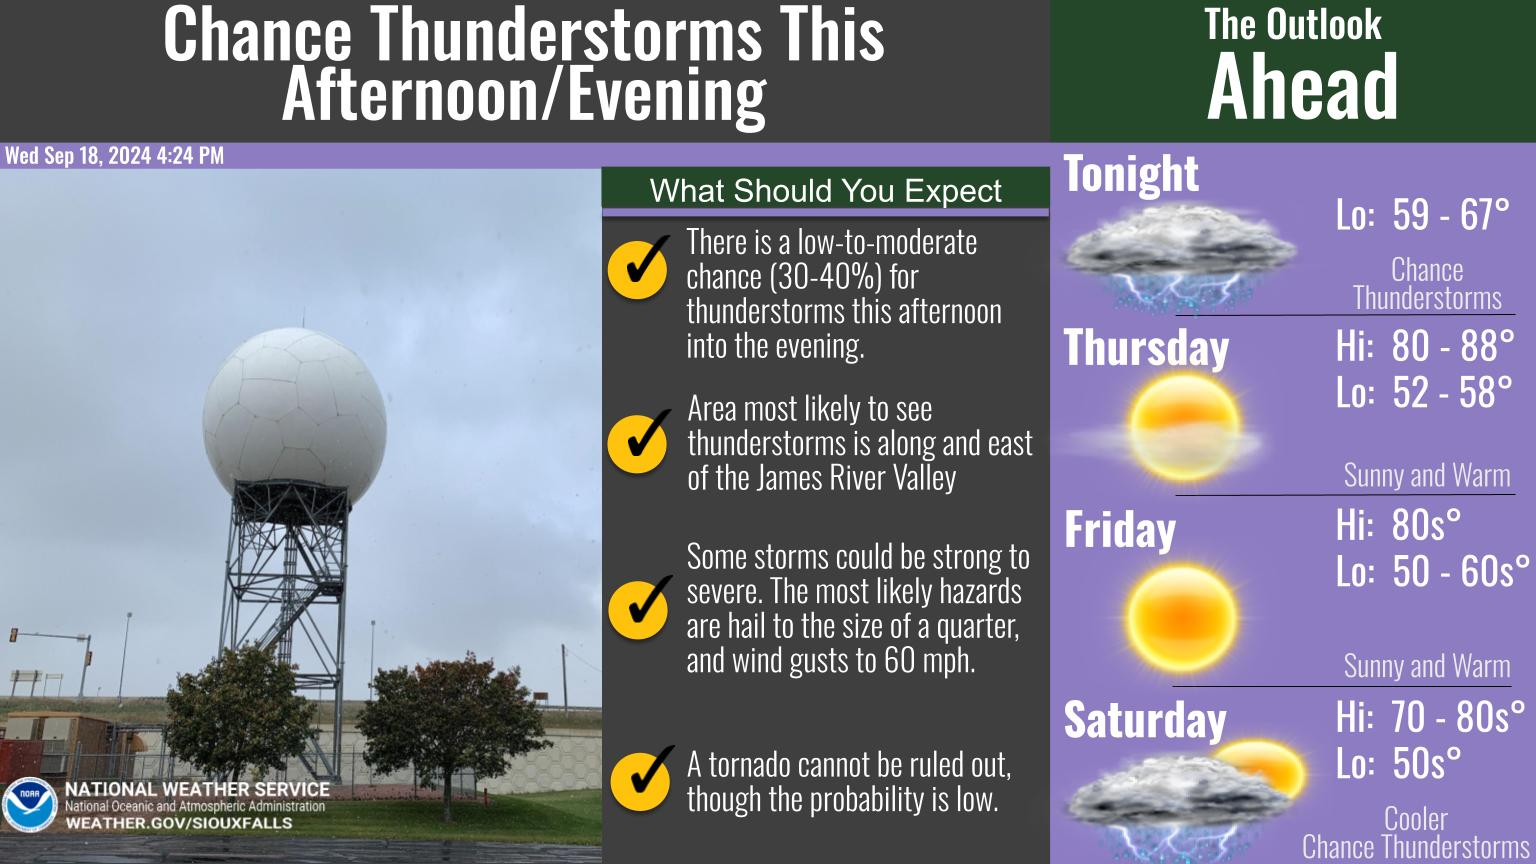 Weather Story
 Weather Map
 Local Radar