Rangeland Fire Danger and Red Flag Warnings - Rangeland Fire Danger ratings and Red Flag Warnings are issued for all counties in the Sioux Falls forecast area. A fire danger statement and map are issued daily from April 1st through October 31st...and as needed during the winter months. If the rangeland fire danger rating becomes very high or extreme, and/or red flag criteria are met, the fire danger statement will also explain the specific weather events which prompted the rating. A red flag warning will be issued only when the following conditions are both met consistently, but not necessarily continuously for 3 hours; a) sustained one-minute winds at 20 feet or frequent gusts at or above 25 mph; b) minimum relative humidity is at or less than 25 percent. In addition, the fuels must be dry enough to burn. A Fire Weather Watch can be issued before a Red Flag Warning, up to 72 hours in advance.
The inputs into the rangeland fire danger rating are the weekly percent green data from the EROS data center, afternoon forecast temperature, wind, humidity and cloud cover. The issuance of a very high or extreme rangeland fire danger statement occasionally occurs for the Sioux Falls forecast area during the spring and fall months. This is due to plentiful dead or dormant grasses, relatively dry humidity and many days where the wind is fairly strong. But from late May through early September, the issuance of a very high or extreme rating becomes rare. This is due to annual and perennial grasses "greening up", much higher humidity and generally decreased winds. Of course, a severe drought would make the summer issuance of a very high or extreme rating more common. The red flag warning/fire weather watch is a rare occurrence for the Sioux Falls forecast area. However if one is posted, then any fire has the potential to become quickly out of control and exhibit critical fire behavior. In addition, when the rangeland fire danger rating is very high or extreme, open burning should be postponed.
Haines Index - Haines Index combines the effects of instability and dry air to determine conditions in which an existing fire has the potential to spread rapidly. It should not be used to determine if a fire will start. Since wind is not a parameter of the Haines Index, it is best used for plume-dominated fires which can develop extreme surface winds through their own internal heat. The Haines Index is yet to be tested on wind-driven fires. For the Sioux Falls area, Haines Index takes into account the difference between the 850mb (5,000 ft) temperature and dew point temperature, thus calculating the amount of low level moisture in the atmosphere. It also looks at stability, by subtracting the temperatures from 850 to 700mb (10,000 ft) to calculate a lapse rate. The Haines Index values are as follows: 2 or 3 - very low; 4 - low; 5 - moderate; 6 - high. When the value is 5 or 6, the probability of extreme fire behavior, including torching, crowning and spotting is significantly increased. Critical fire behavior is usually low, with minimal fire spread when the values are 4 or less. Obviously with a dry and unstable low level atmosphere, Haines Index values will be increased.
NFDRS - The National Fire Danger Rating System was developed to give agencies advanced noticed of increased fire danger for planning and staffing purposes. It is a scientifically based system which is applicable anywhere in the country and is generated from 1 pm observations and forecasts nationwide. The NFDRS relates only to the potential of an initiating fire, one that spreads without crowning or spotting, through uniform fuels on a continuous slope. It measures fire only from a containment standpoint as opposed to full extinction. In addition, the NFDRS represents near worst-case conditions measured at exposed locations at or near the peak of the normal burning period. One important item to remember is that the NFDRS is a broad scale rating, approximately for 100,000 acres. The observed NFDRS is simply the rating calculated from the observed conditions at 1 pm (mentioned above) and the forecast NFDRS is the rating forecast for the next day. Besides the basic fire danger ratings of low, moderate, high, very high and extreme, the NFDRS calculates parameters to aid agencies in determining staffing levels, how hot a fire will burn and spread, ignition component and flame length. One possible outcome of a high fire danger is an agency may have to ban campfires or prescribed burning on federal lands.
Fuel Moisture - Simply stated, the fuel moisture content of a fuel is the amount of water in that fuel, expressed as a percent of the ovendry weight of that fuel. If the fuel were totally dry, then the fuel moisture content would be zero percent. That being said, when a fuel has less than 30 percent moisture content, it is basically a dead fuel and is treated as such. Live fuels will range from 30 percent moisture content, to around 300 percent, depending on the plant's stage of growth in a season. When the fuel moisture content is high, fires ignite poorly, or not at all, because heat energy has to be used to evaporate and drive water from the plant before it can burn. When the fuel moisture content is low, fires start easily and will spread rapidly. All of the heat energy goes directly into the burning flame itself. Dead fuels respond solely to current environmental conditions (weather) and are critical in determining fire potential. The size of the fuel relates how fast the fuel will react to gains or losses in moisture due to changes in its environment. Therefore dead fuel moisture is classified by timelag and is defined as the amount of time it takes a fuel to reach two-third's of its way to equilibrium with its environment. One-hour timelag fuels are fuels which are less than 1/4 inch in diameter and respond very quickly to changes in their environment. These fuels will only take about an hour to lose or gain two-thirds of their equilibrium moisture content of their environment. This size fuel, if dead, is referred to as "fine dead fuel moisture" and is the most critical size fuel in starting fires. Moving up in size, a fuel will lose or gain moisture less rapidly through time. Ten hour fuels range in diameter from 1/4 inch to 1 inch, 100 hour fuels from 1 inch to 3 inches, and 1,000 hour fuels from 3 inches to 8 inches in diameter. 10,000 hour fuels are greater than 8 inches in diameter. Obviously, the 1,000 and 10,000 hour fuels do not burn easily. However, if they do burn, these size fuels will generate extreme heat often causing extreme fire behavior conditions. Fire has been known to smolder underneath snow pack through an entire winter when 10,000 hour fuels were on fire the summer before.
Drought Monitor - The drought monitor map indicates drought by intensity, which ranges from D1 (least intense) to D4 (most intense). D0 areas are drought watch regions. The droughts are classified as to their primary physical effects where A is agricultural (both crops and livestock), W is water supplies and F is fire danger. The drought intensity categories are based on six key indicators and numerous supplementary indicators. The six are Palmer Drought Index, CPC Soil Moisture Model, Daily Streamflow, Percent of Normal Precipitation, USDA Topsoil Moisture and the Satellite Vegetation Health Index. The final drought category tends to be based on the majority of indicators.
Greeness Maps - Greeness products are derived weekly from the Normalized Difference Vegetative Index and are processed and provided by the EROS Data Center just outside Sioux Falls, SD. The final greeness products are in a 1km resolution and are useful in assessing changes due to seasonal curing and drought conditions. Visual Greeness portrays vegetative greeness compared to a very green reference, such as an alfalfa field. Therefore the resulting image is similar to what one would see from the air. Relative Greeness shows how green the vegetation is compared to how green it has been historically since 1989. Departure from Average Greeness shows how green each pixel is compared to its average greeness for the current week of the year.
Palmer Drought Index - The Palmer Drought Index (PDI) is a very slow responding index to changes in moisture and is best used to monitor water supplies (such as ground water) or sub-soil moisture which respond slowly to precipitation anomalies. Palmer attempts to answer the question "How much precipitation should have occurred during a given period to have kept the water resources of the area commensurate with their established use?" He compares the amount of precipitation that should have occurred, with the amount that actually did occur to measure the departure of the actual moisture supply from the "normal" supply. The PDI was developed using data from western Kansas and central Iowa for the late 1800s and the first half of the 1900s. It attempts to track the evapotranspiration and recharge of two soil layers - the upper soil layer (plow depth) and the lower soil layer (root zone depth). The final output of the PDI expresses departure from normal precipitation, where positive values indicate a surplus of moisture and negative values indicate less than normal moisture.
Keetch-Byram Drought Index - The Keetch-Byram Drought Index (KBDI) was designed specifically for fire potential assessment and is a number representing the net effect of evapotranspiration and precipitation in producing cumulative moisture deficiency in deep duff and upper soil layers. Since the KBDI was developed to represent fire developing problems, it responds on a reasonable time-scale. The KBDI assumes the soil has a field capacity of eight inches of water, therefore the index is on a scale ranging from 0 to 800. Zero is the point of no moisture deficiency and 800 is the maximum drought that is possible. The index number indicates the amount of net rainfall, in hundredths of an inch, that is required to reduce the index to zero (saturation). Limitations of the KBDI assume a full recharge of water during the winter. Also, cool temps and short summers in the northern climates may keep the KBDI low. Therefore, fire occurrence compared to KBDI often gives mixed reliability.
Crop Moisture Index - The Crop Moisture Index (CMI) is a derivative of the PDI and is designed to monitor short-term moisture conditions across major crop producing regions. The PDI measures long-term moisture conditions. The CMI is based on the average temperature and total precipitation for each week within a climate division, as well as the CMI value from the previous week. The CMI responds rapidly to changing conditions and is not a good long-term drought monitoring tool. A limitation of the CMI is that it begins and ends each growing season near zero, which prevents the CMI from being used to monitor moisture conditions outside the general growing season.


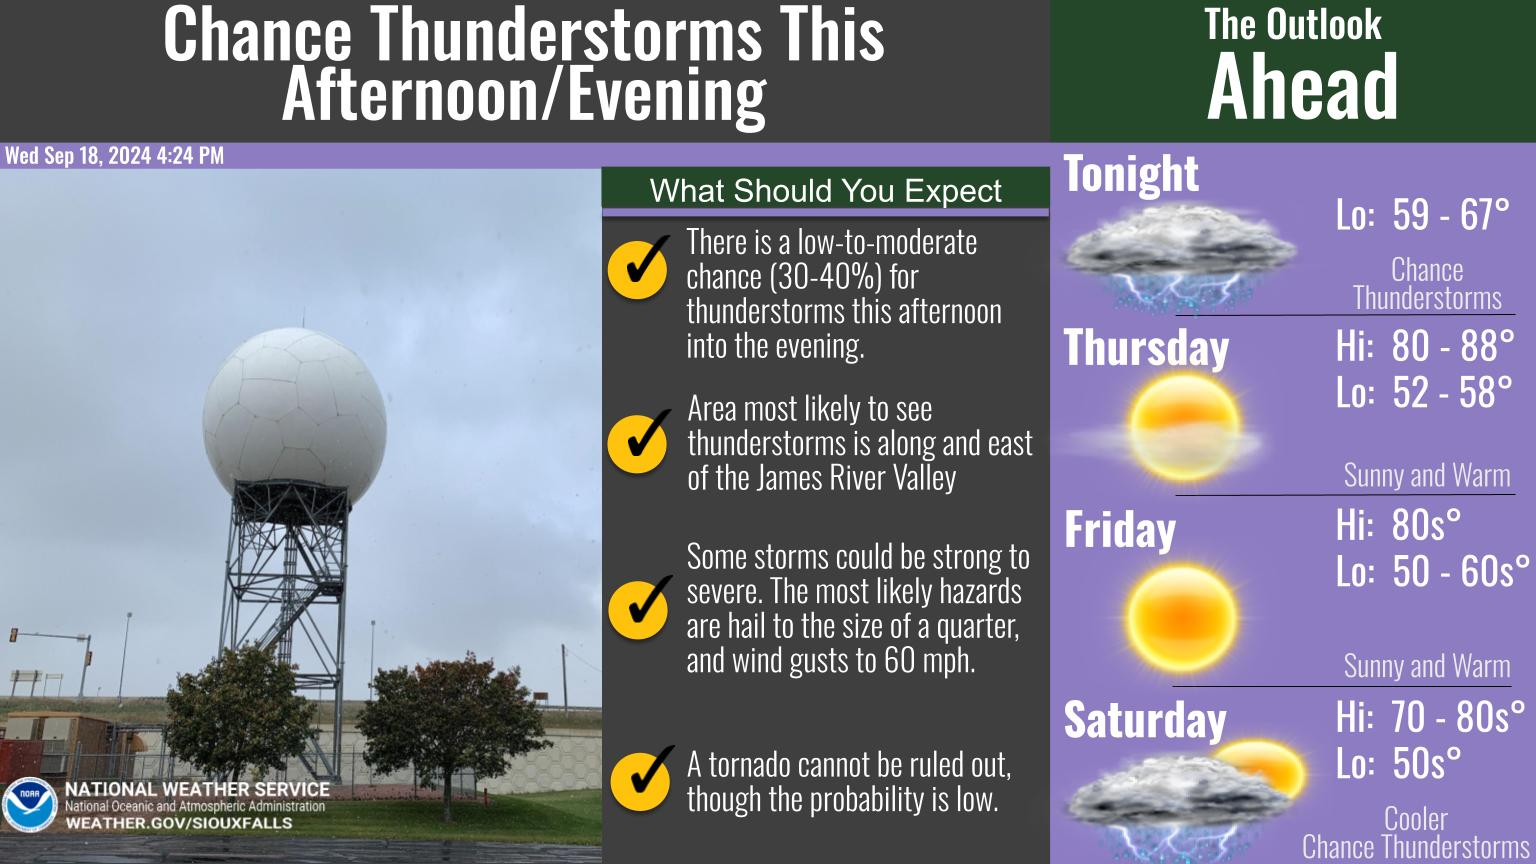 Weather Story
 Weather Map
 Local Radar