|
Goodland Halloween Climatology
Period of Record 105 Years: 1914-2023
Missing: 1909, 1913 and 1918
Temperature Information
| Record High |
87°F (1950) |
| Record Low |
12°F (1991) |
| Coldest High Temperature |
22°F (1991) |
| Warmest Low Temperature |
47°F (1990) |
Average High
(Period of Record) |
59.3°F |
Average Low
(Period of Record) |
30.7°F |
30 year Normal High
(1992-2023) |
60.8°F |
30 year Normal Low
(1992-2023) |
32.1°F |
|
.png)
(Click image for a larger version)
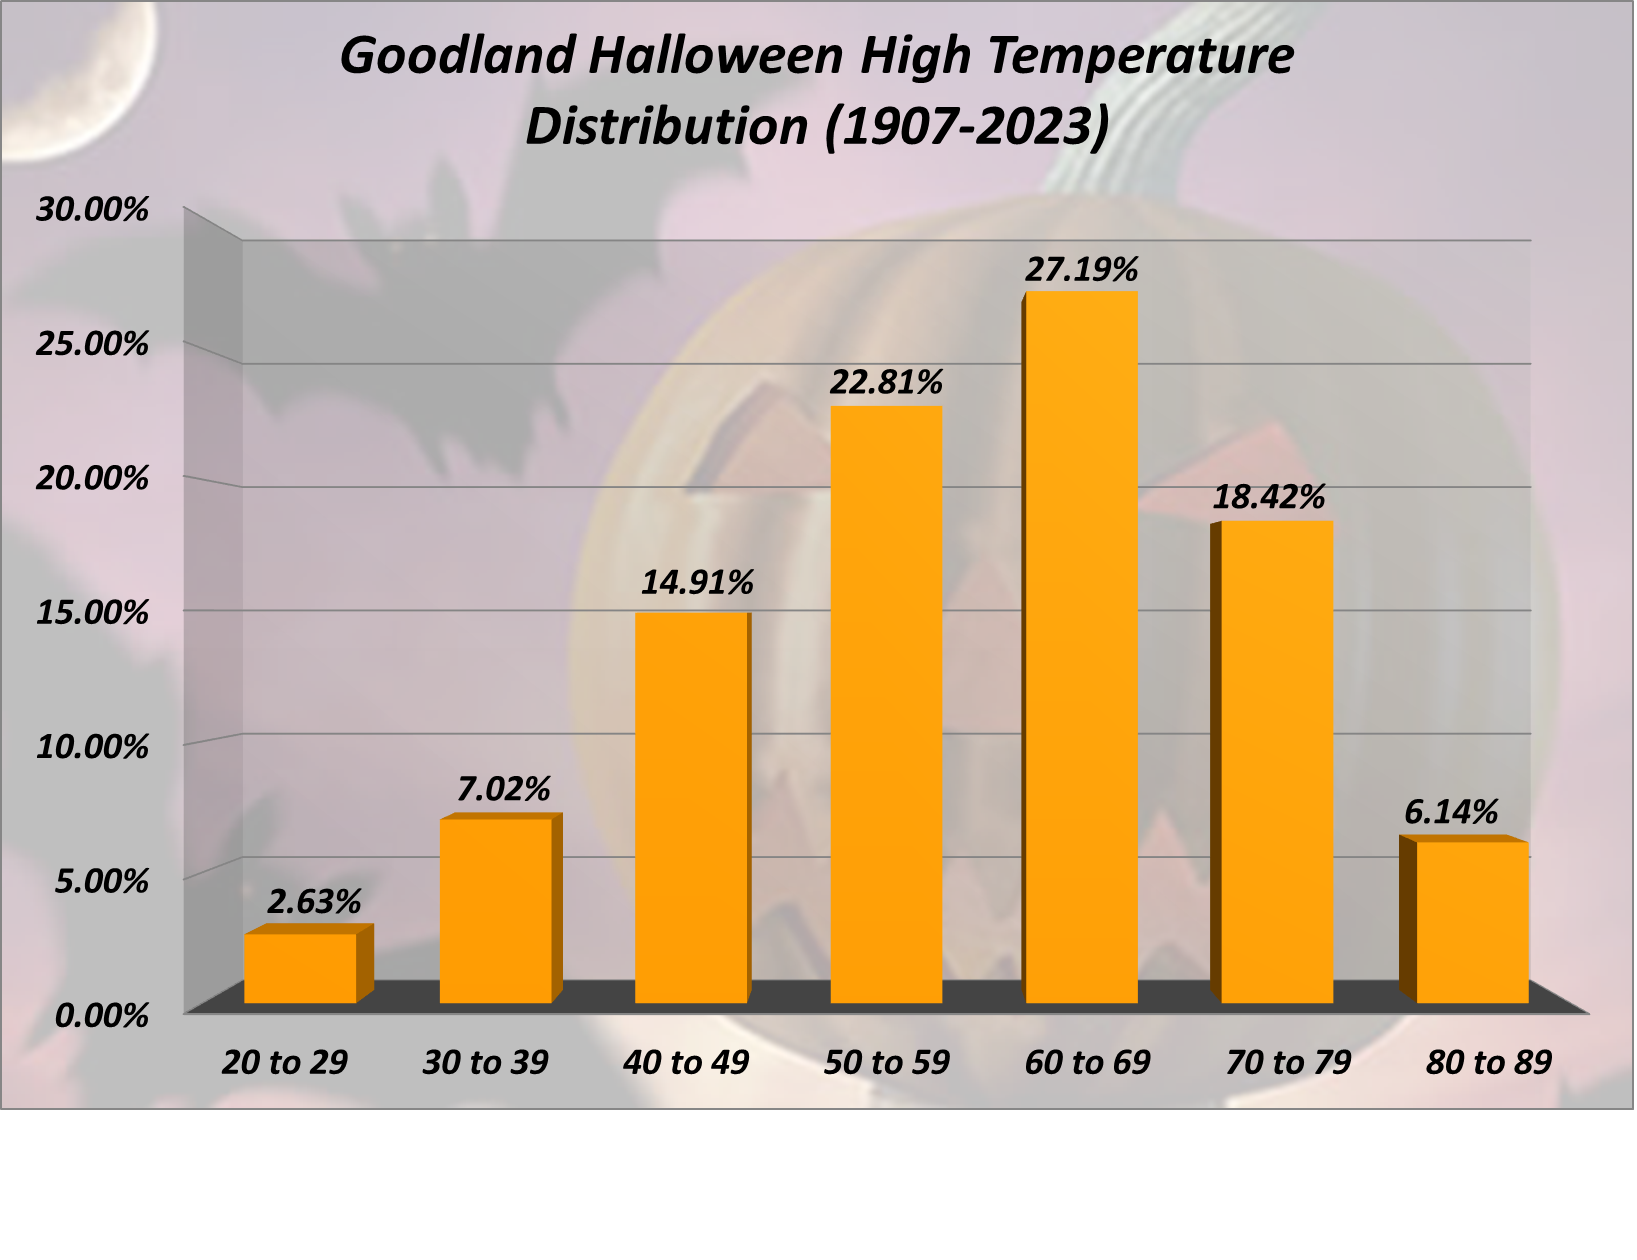
Distribution of High Temperatures in 10 Degree Fahrenheit Ranges

(Click image for a larger version)
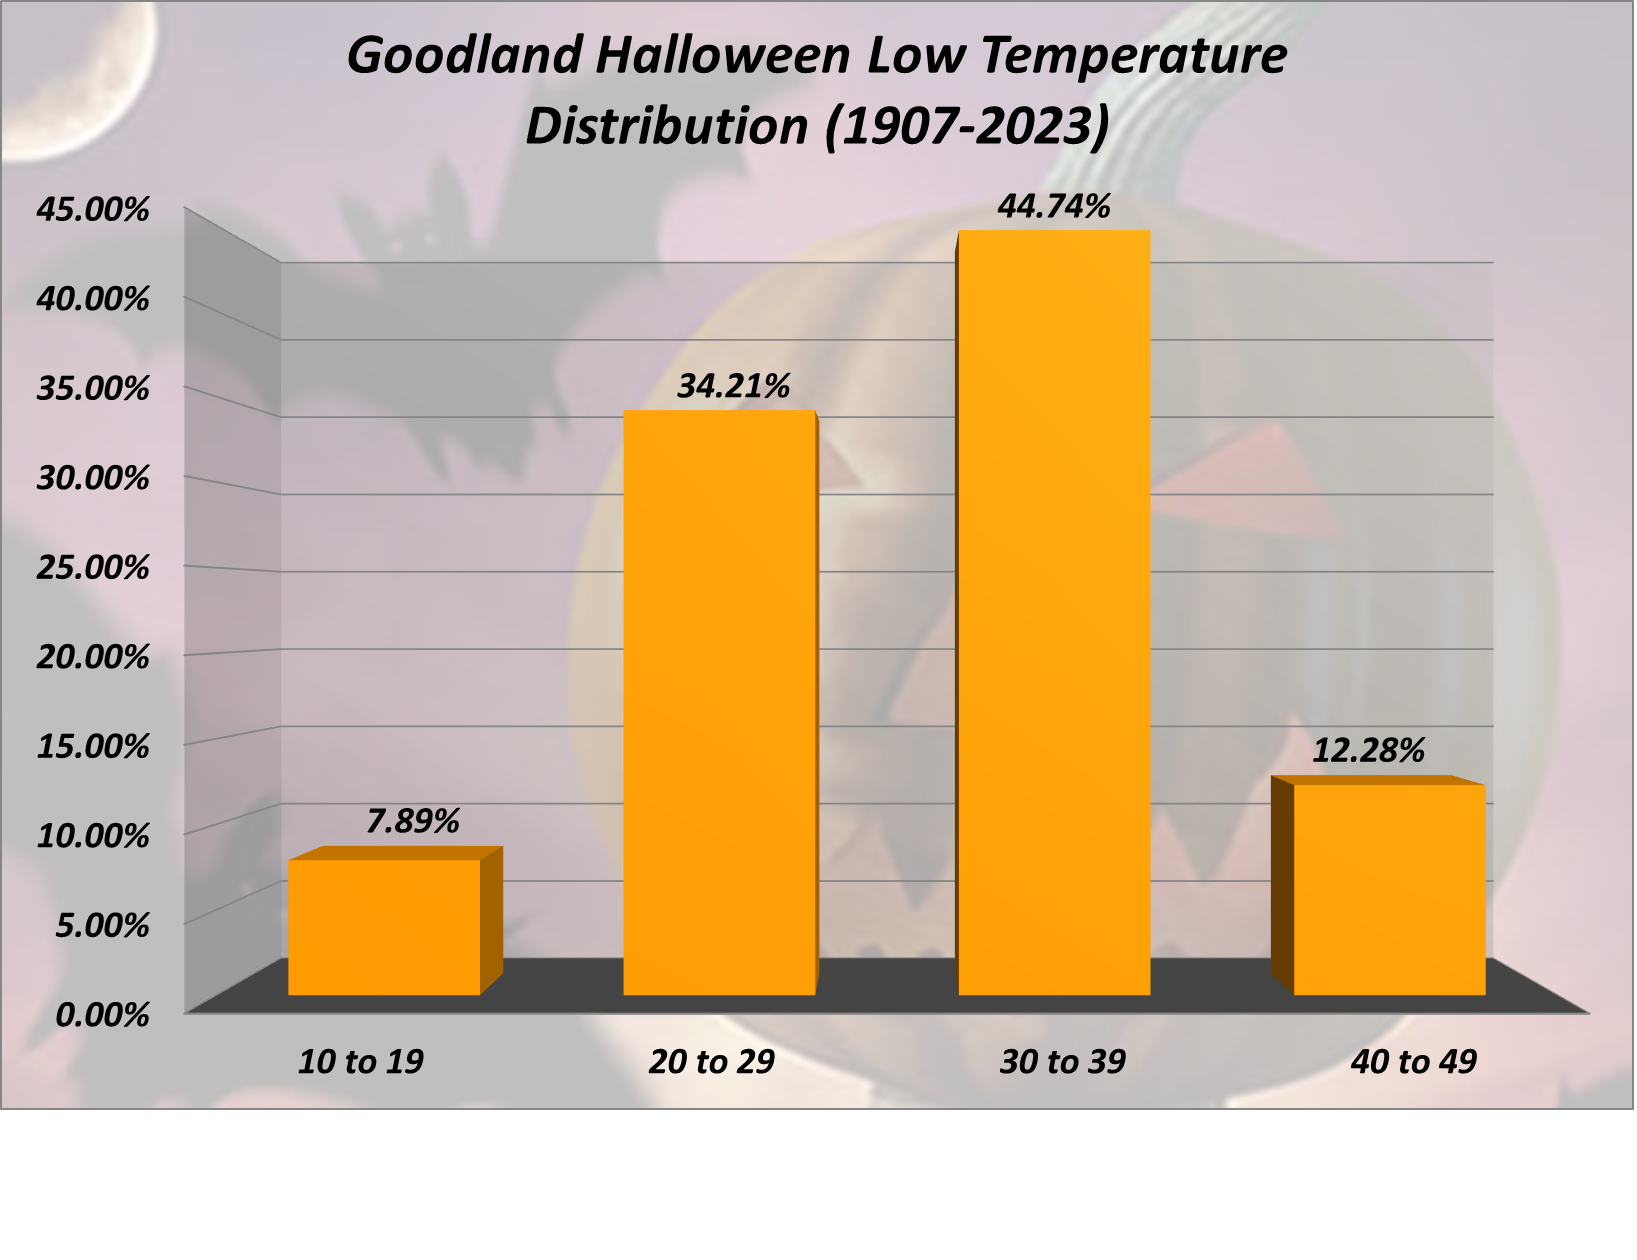
Distribution of Low Temperatures in 10 Degree Fahrenheit Ranges

(Click image for a larger version)
Precipitation Information
| Greatest Precipitation |
0.91” (1920) |
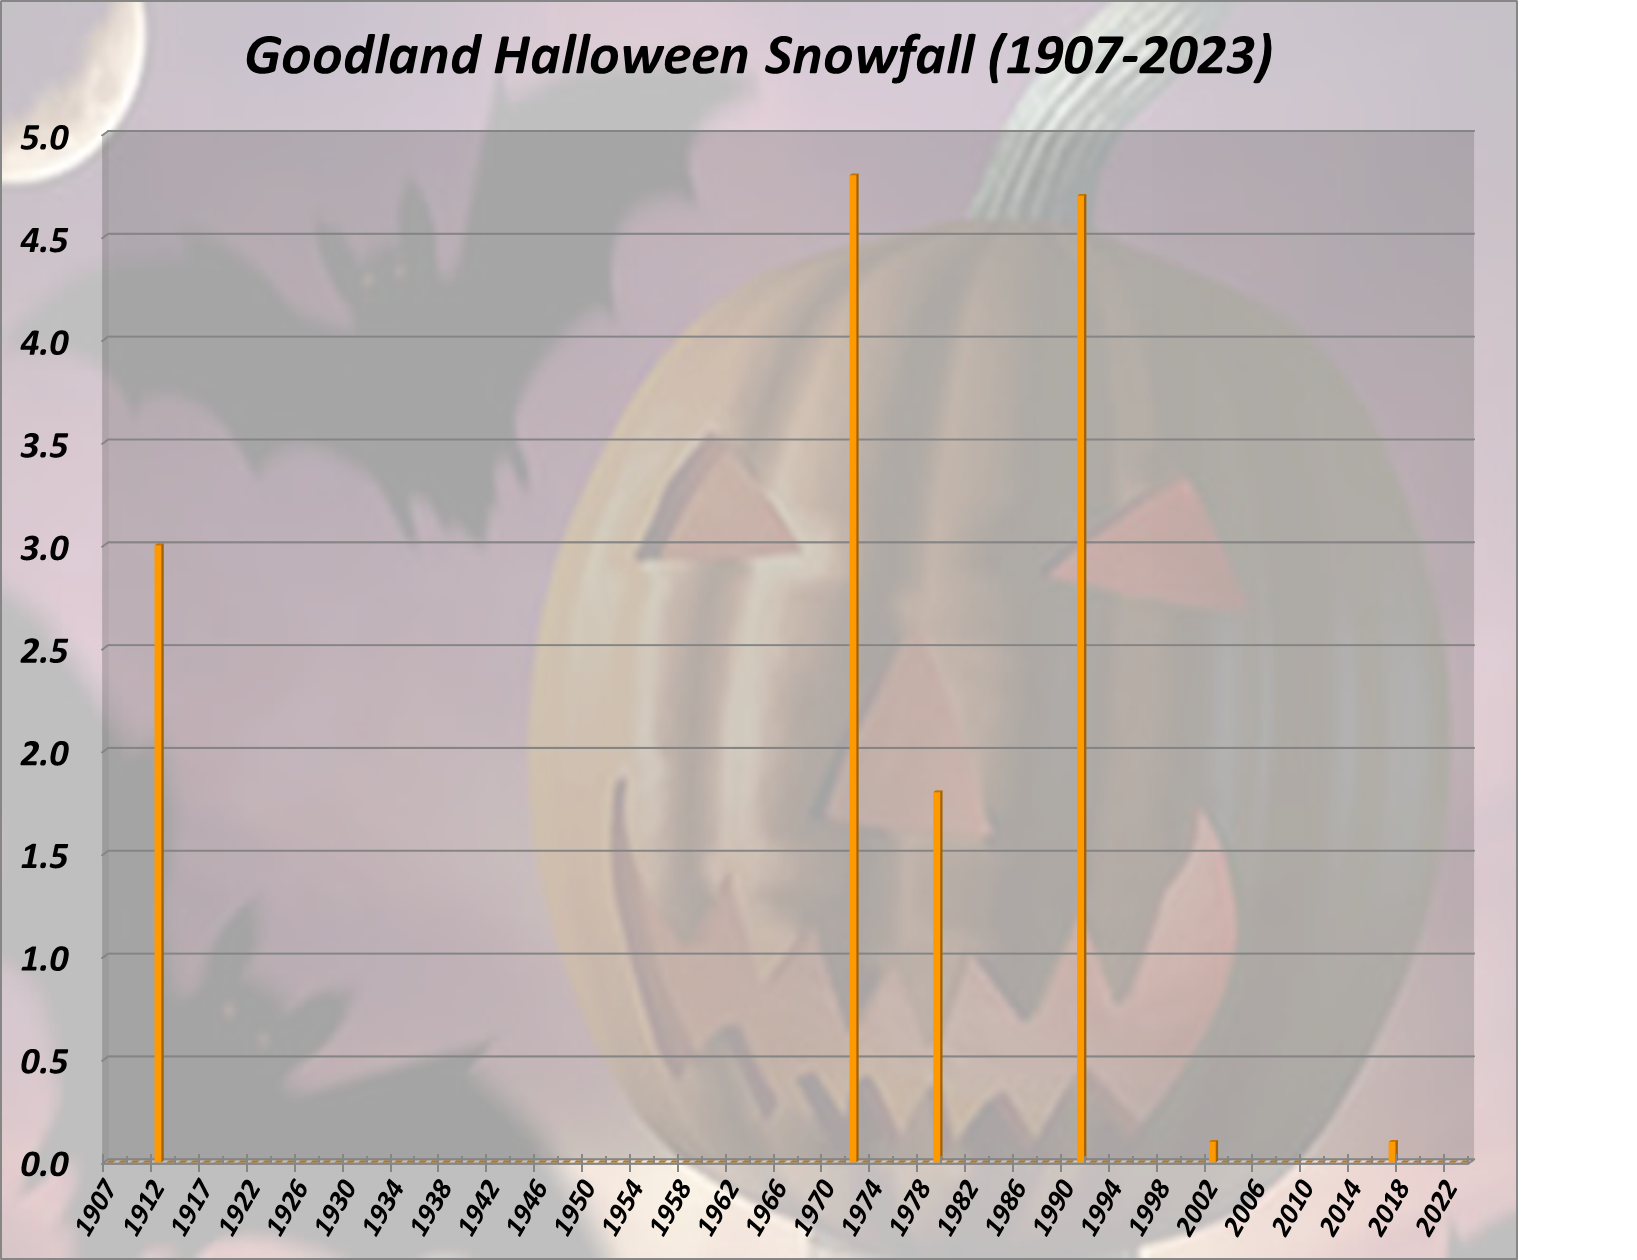
| Greatest Snowfall |
4.8” (1972) |
| Precipitation |
27 of 114 years
23.6% |
Measurable Precipitation
(more than a Trace) |
13 of 114 years
11.4% |
| Snowfall |
15 of 114 years
13.2% |
Measurable Snowfall
(more than a Trace) |
6 of 114 years
5.3% |
| Greatest Snow Depth |
9” (1971) |
“White” Halloween
(Snow Depth of 1” or more) |
8 of 114 years
7.0%
|
|
.png)
(Click image for a larger version)

(Click image for a larger version)
.png)
(Click image for a larger version)
BURLINGTON HALLOWEEN DAY CLIMATOLOGY
HILL CITY HALLOWEEN DAY CLIMATOLOGY
MCCOOK HALLOWEEN DAY CLIMATOLOGY
For additional holiday climate studies, return to the main menu
Updated November 18, 2023
|