Overview
|
An intense storm system moved across the central High Plains on Sunday, May 18th. Several strong supercell storms formed producing very large hail, damaging winds and several tornadoes. |
 Preliminary Storm Reports Compiled by the Storm Prediction Center. Click on image for more information. |
Tornadoes
Select a tornado from the table to zoom into the track and view more information. The default table view is limited to 8 tracks, but can be scrolled by a mouse wheel or dynamically expanded. Additionally, the table can fill the entire window by clicking the small circular expanding arrow icon at the very top right of the table and returned to its original size by clicking the button again. The side information panel that opens over the map can be closed using the "X" on the upper right corner of the pop-up. Zoom into the map and click damage points to see detailed information and pictures from the surveys.
|
NOTE: times shown below are local to your device's time zone. |

The Enhanced Fujita (EF) Scale classifies tornadoes into the following categories:
| EF0 Weak 65-85 mph |
EF1 Moderate 86-110 mph |
EF2 Significant 111-135 mph |
EF3 Severe 136-165 mph |
EF4 Extreme 166-200 mph |
EF5 Catastrophic 200+ mph |
 |
|||||
| Tornadoes that fail to impact any ratable structures on the EF-Scale are rated EF-Unknown (EF-U) | |||||
Radar
Cheyenne County Tornado
 |
 |
 |
 |
|
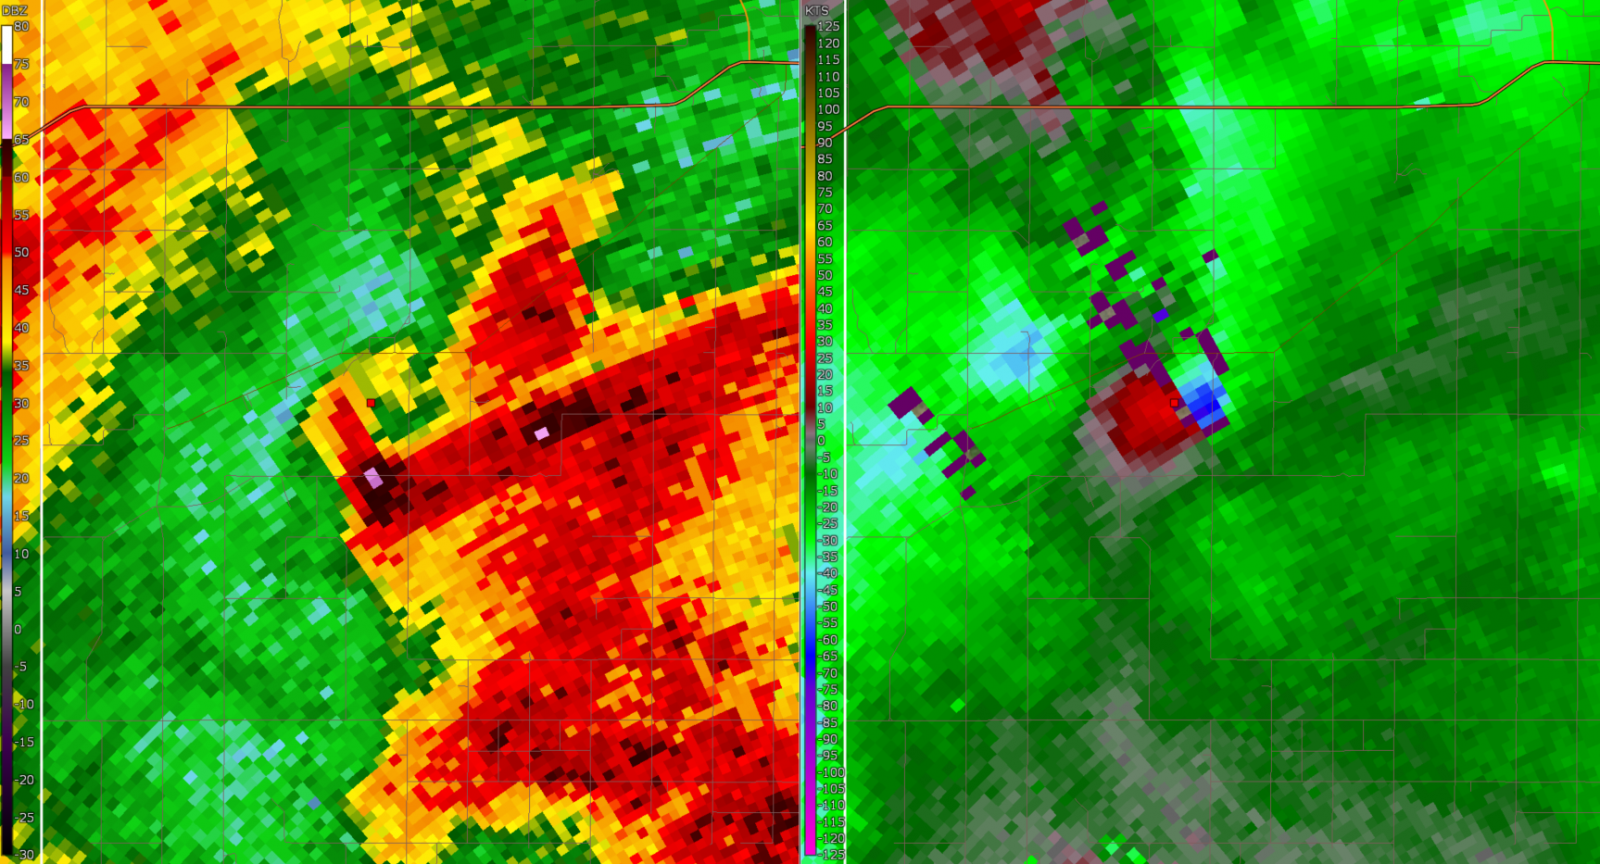
2211 UTC 0.5 degree reflectivity and Storm Relative Velocity. Red dot is approximate location of developing tornado. Green/blue indicate motion to the bottom right corner of image, red color is motion to the upper left. This pattern of rotation is called "anti-cyclonic" and is a clock wise direction. In majority of cases, supercells rotate in a cyclonic (counter clockwise) direction. |
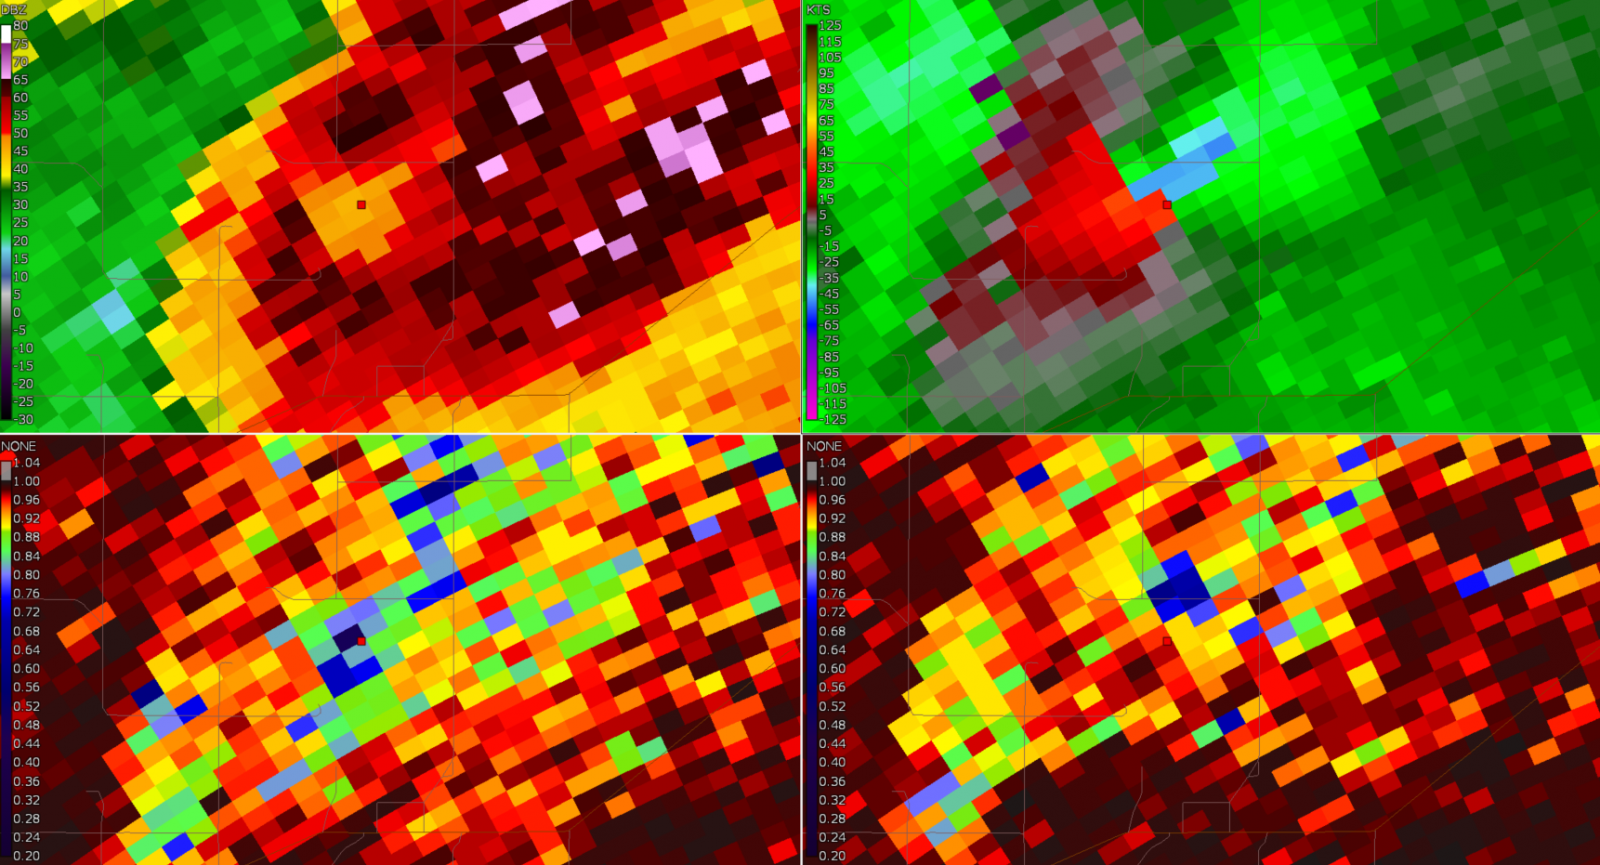
2215 UTC 0.5 Reflectivity, 0.5 Storm Relative Velocity, 0.5 Correlation Coefficient and 0.9 Correlation Coefficient. Red dot is location of ongoing tornado. Blue color in CC (correlation coefficient) in same area of strong rotation indicate debris. |
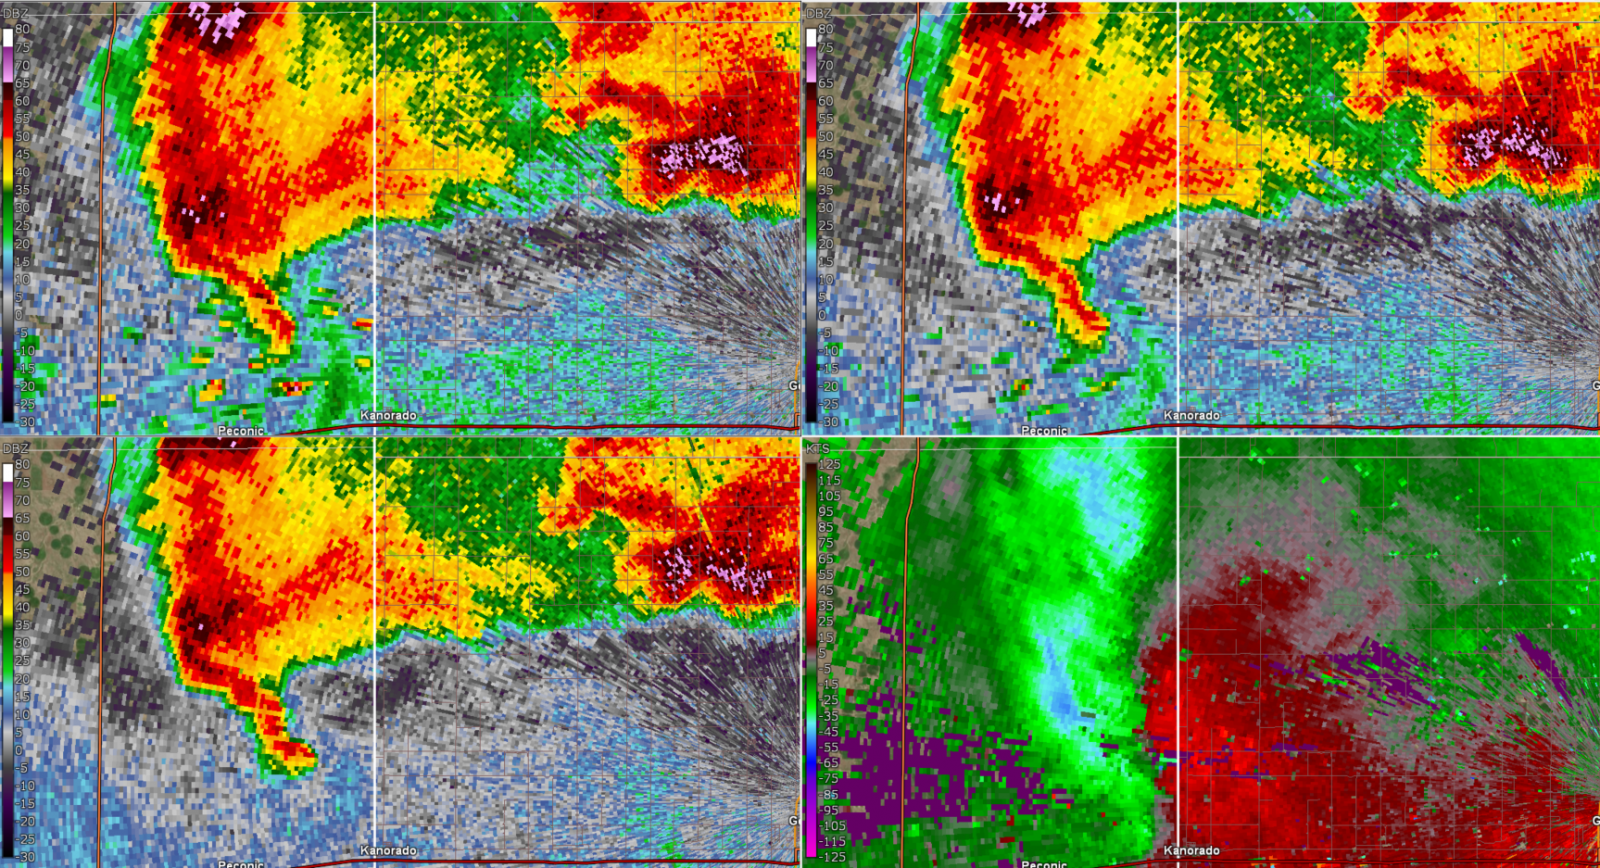
2211 UTC Reflectivity at 0.5, 0.9 and 1.3 degrees, 0.5 Storm Relative Velocity (SRV) Note the northward pointing hook echo transitioning into a donut shaped appearance at the 1.3 degree tilt. This is a sign of strong rotation in the storm. The orientation of these features reflects the anticyclonic nature of the storm. |
2201 UTC Reflectivity at 0.5, 0.9 and 1.3 degrees, 0.5 Storm Relative Velocity (SRV) This storm developed 20 miles to the southwest of the anticyclonic storm. Updraft area and developing hook echo developed on the southern flank of storm, nearly the complete opposite of the anticyclonic storm. Rotation aloft (not pictured) was indeed cyclonic. This storm produced a brief tornado shortly after this image. |
Southeast Logan County Tornado
 |
 |
 |
 |
|
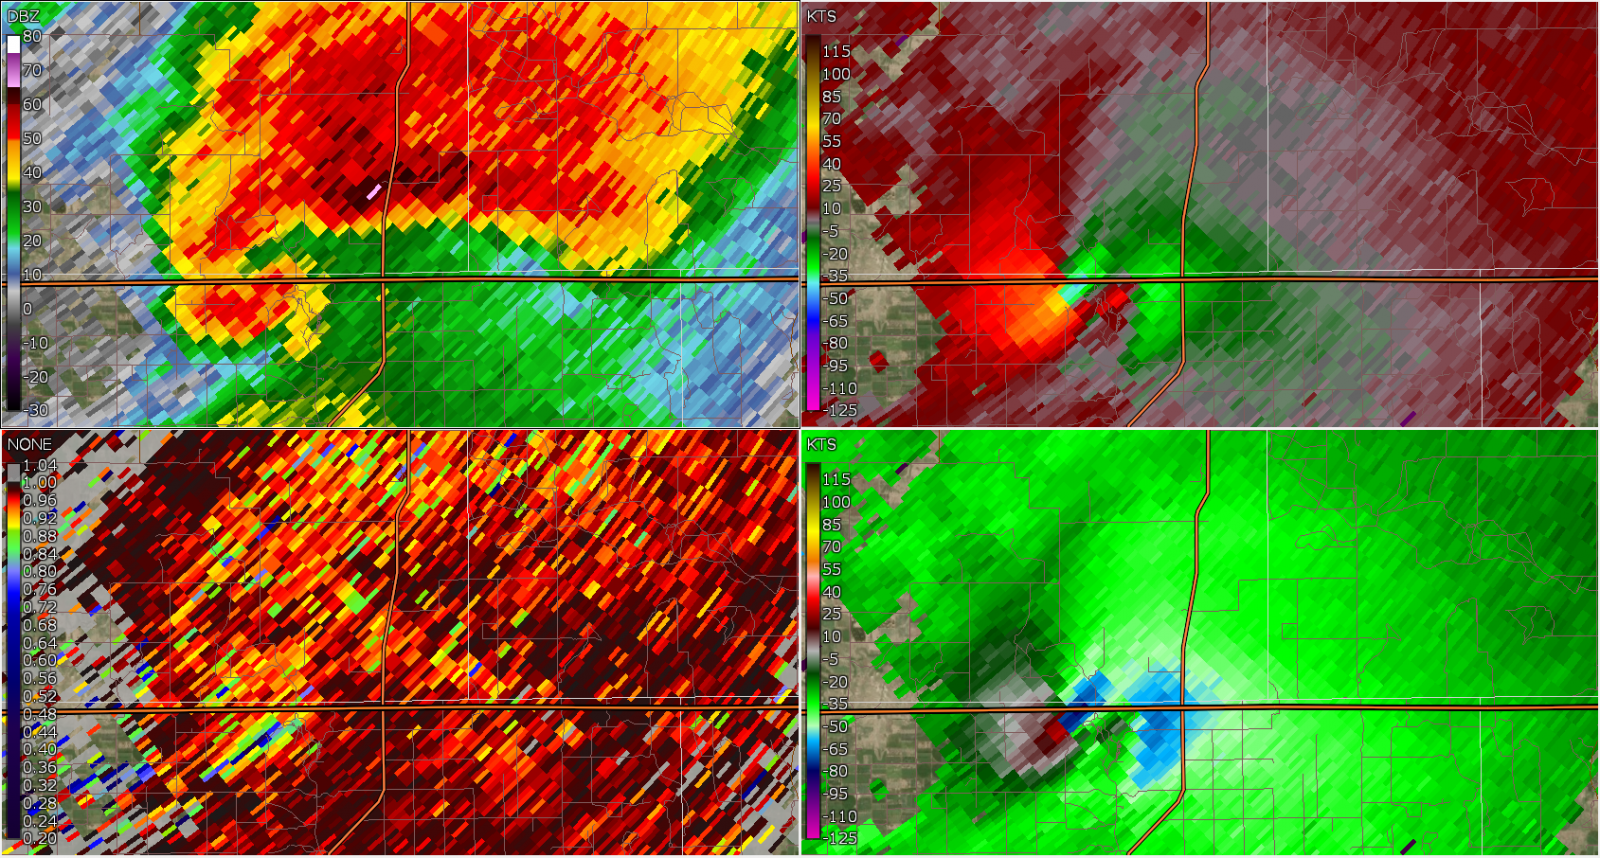
0.5 KGLD Reflectivity , 0.5 Degree Storm Relative Velocity, 0.5 degree Correlation Coefficient, 0.9 degree Coefficient. Radar loop 2222 UTC to 2258 UTC. Watching this image you can see the initial circulation move north out of Scott County and weaken, while new circulation (which becomes Grinnell tornado) begins to develop to its east. |
2245 UTC 0.5 Reflectivity, 0.5 Storm Relative Velocity, 0.5 Correlation Coefficient, 0.5 base velocity. Strong cyclonic circulation (green to the northwest, red towards the southeast) noted at end of 'hook echo'. Correlation coefficient (CC) showing an area of 0.85 and lower in same location as circulation, indicating debris being lofted by tornado. |
2249 UTC 0.5 Reflectivity, 0.5 Storm Relative Velocity, 0.5 Correlation Coefficient, 0.5 base velocity. 4 minutes after the previous radar scan. Area of low CC (values less than 0.7) has grown in size and magnitude providing a strong signal that a tornado is lofting debris. This signature is called a tornado debris signature (when colocated with a tornadic circulation). |
2258 UTC 0.5 Reflectivity, 0.5 Storm Relative Velocity, 0.5 Correlation Coefficient, 0.5 base velocity. Circulation has lifted towards the northwest and apparently has weakend per velocity measurements. Debris signature also has gotten broader and diminished in magnitude. This is indicating that this tornado has begun to occlude/end. |
Grinnell Tornado
 |
 |
 |
 |
|
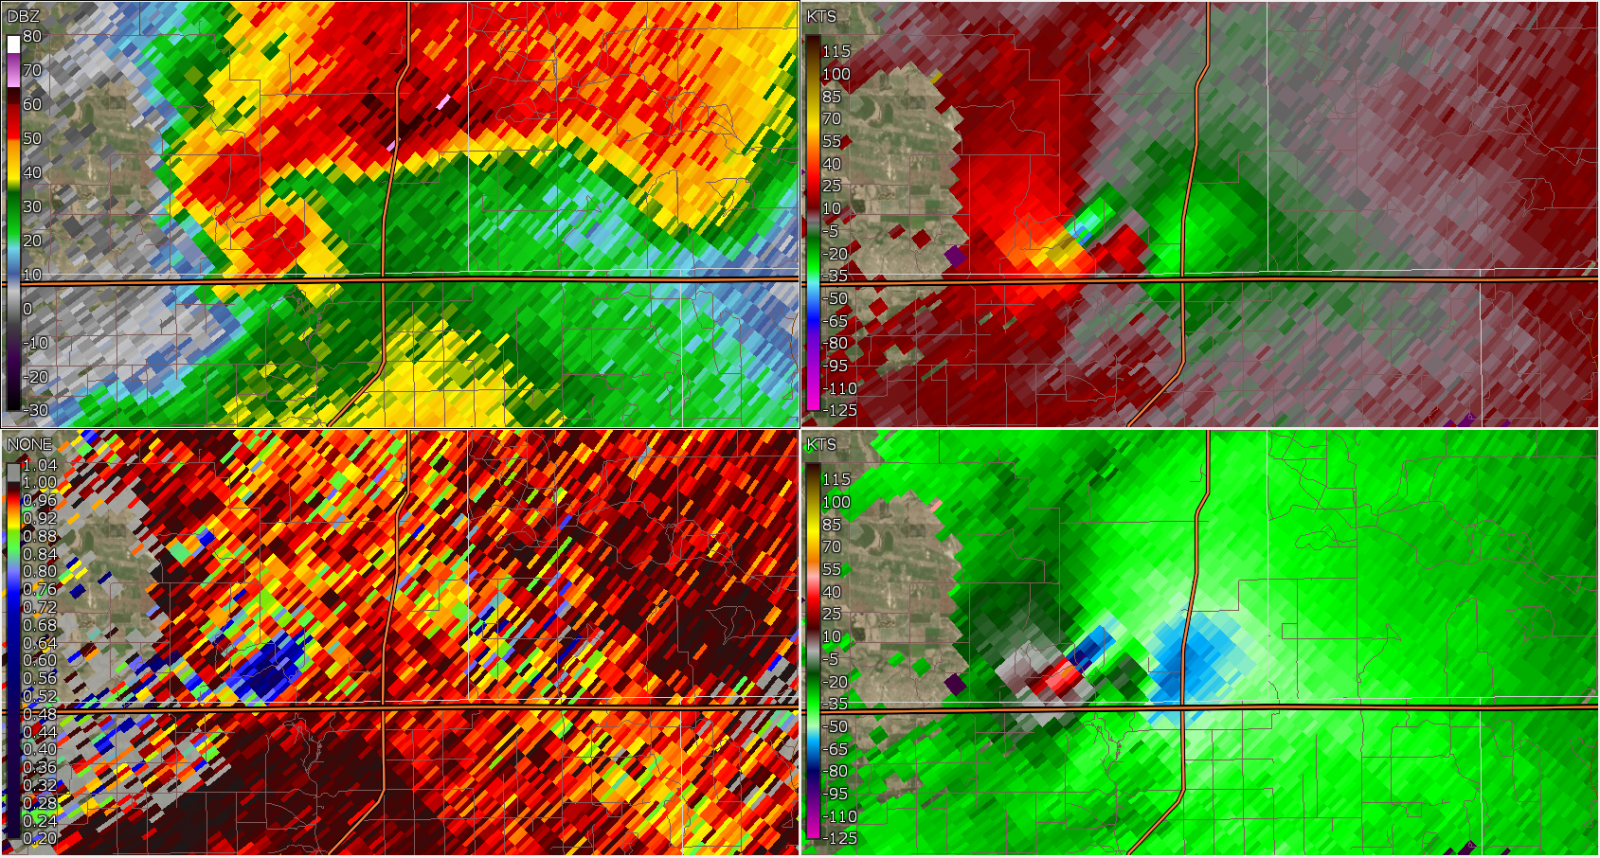
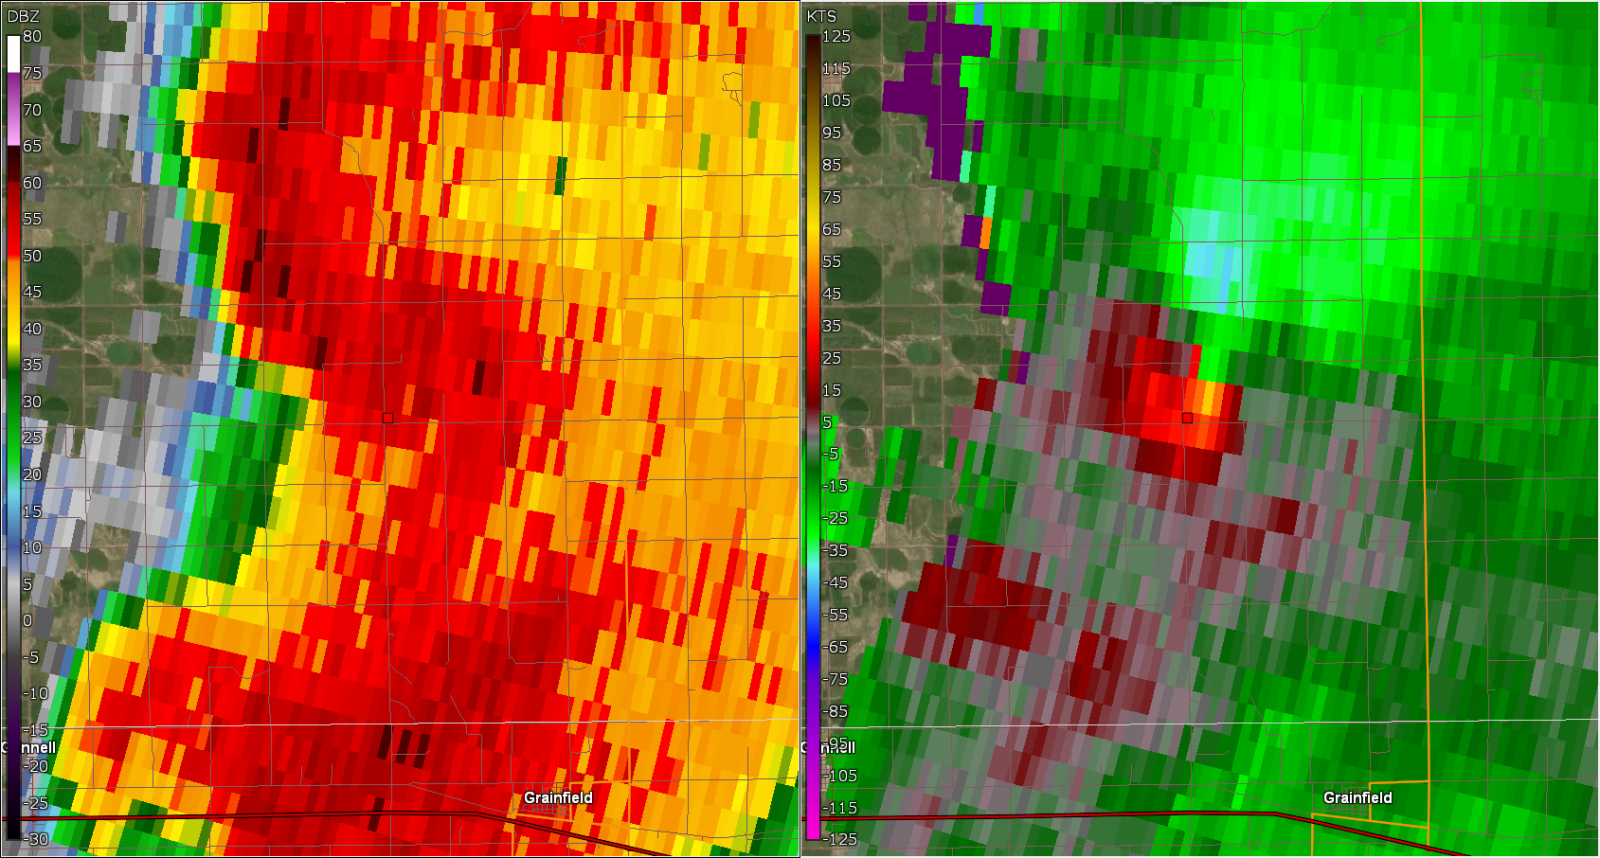
0.5 Degree Reflectivity / Storm Relative Velocity loop 2302 to 2358 UTC loop. Storm that hit the community of Grinnell was actually same storm that spawned a tornado in Scott and Logan county. That tornado ended and a new mesocyclone formed to its east. This new mesocyclone ultimately spawned the Grinnell tornado. |
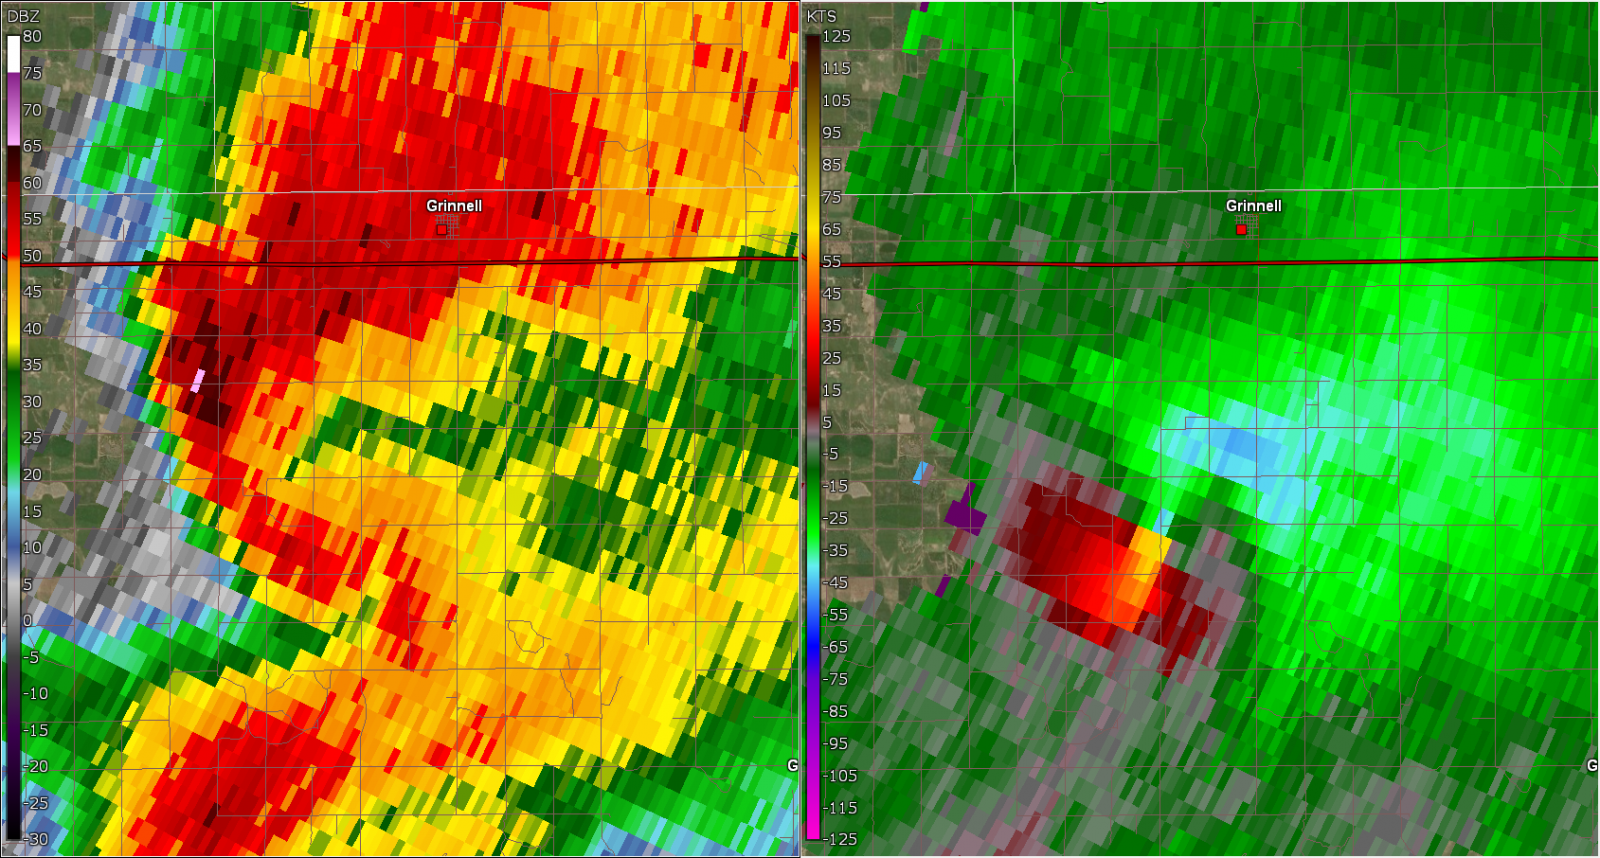
05/18 2340 UTC 0.5 Degree Reflectivity and Storm Relative Velocity. Intense circulation (green colors are motion to the left and red colors are motion to the right.) Circulation is found in 'hook echo' of storm.
|
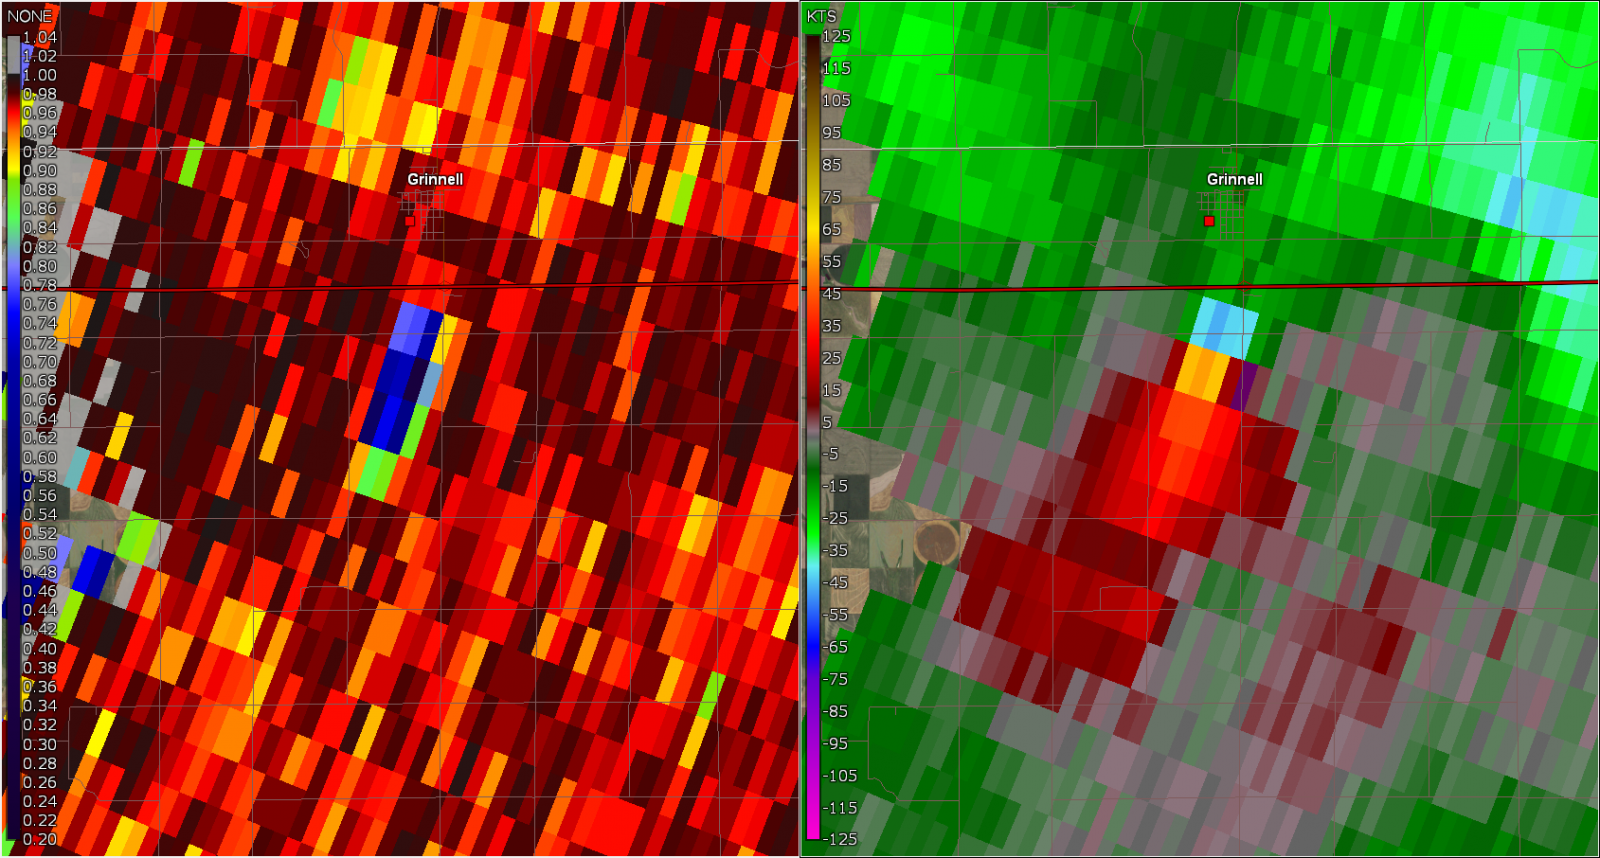
05/18 2352 UTC 0.5 degree Correlation Coefficient and Storm Relative Velocity. Blue area just south of Grinnell coincides with area of strong rotation just south of Grinnell. This area of low Correlation Coefficient (blue area) is indicative of debris being lofted into the air by tornado. |
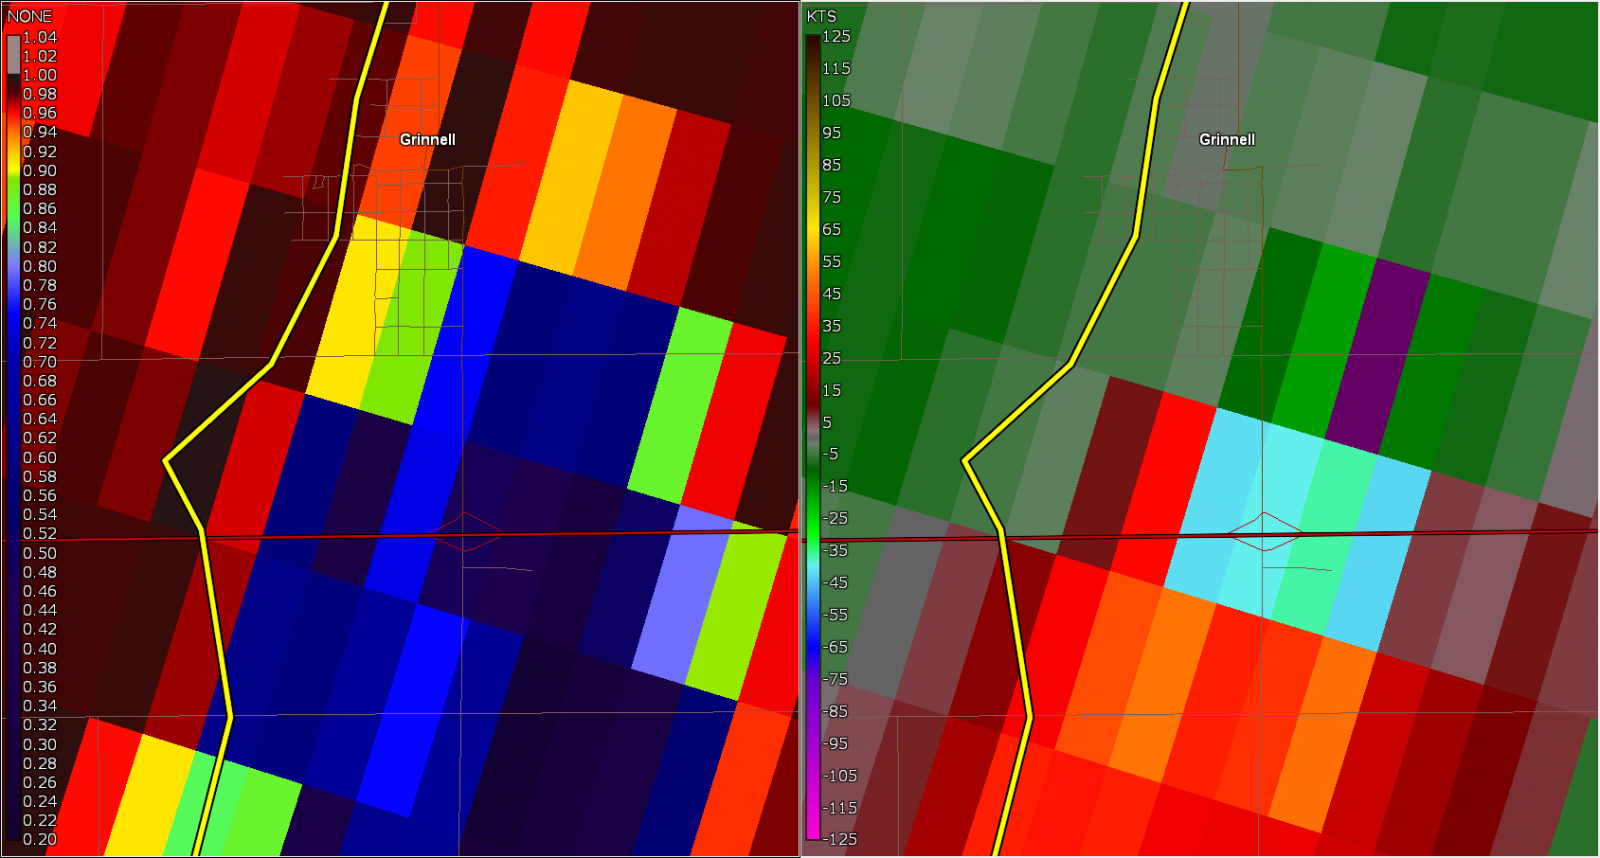
0.5 Correlation Coefficient and Storm Relative Velocity. Solid yellow line is observed Grinnell tornado path. Note that tornado path is to the west of radar circulation and debris signal. The WSR-88D generally does not detect the tornado directly, just the parent circulation. Additionally radar beam at this distance is approximately 4700 feet above ground. Caution should be used when assuming a tornado's path based on radar data along. |
SW of Hoxie Tornado
 |
 |
 |
 |
|
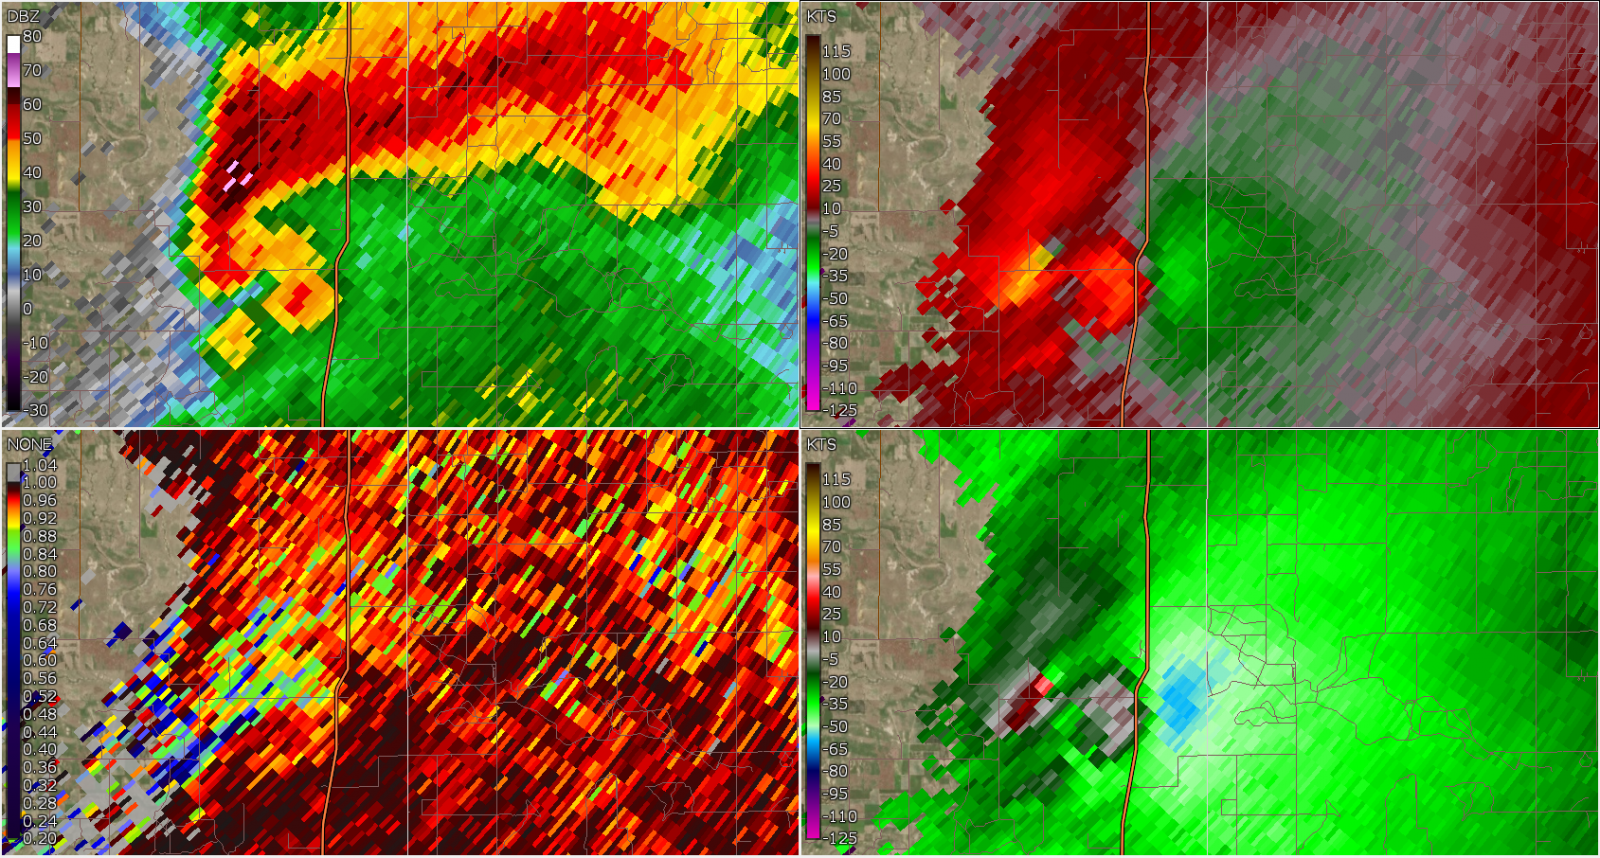
0.5 Degree Reflectivity / Storm Relative Velocity Loop Starting at 2355 UTC. The storm which spawned the Grinnell tornado later spawned two more tornadoes in rural Sheridan County. The red dot is where the two tornadoes occurred. |
0.5 Degree Reflectivity / Storm Relative Velocity loop 0007 UTC image. The main tornado is beginning at this time. Less than a minute later a second weaker tornado will form just west of the main one. |
0.5 Degree Reflectivity / Storm Relative Velocity loop 0010 UTC image. This is toward the end of the primary tornado. The second tornado is about to end. The main tornado would last another couple minutes before ending in a field. |
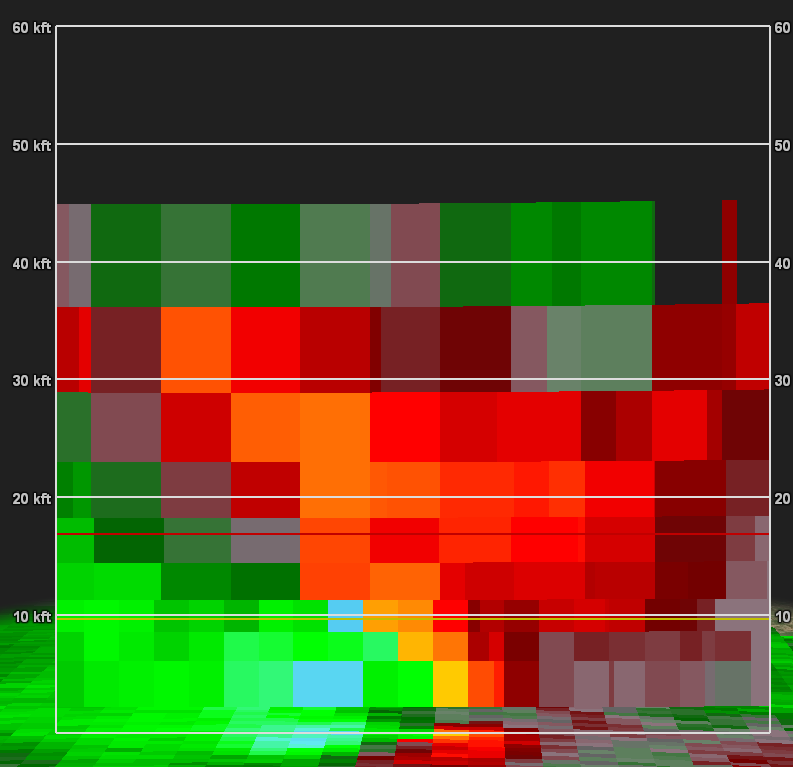
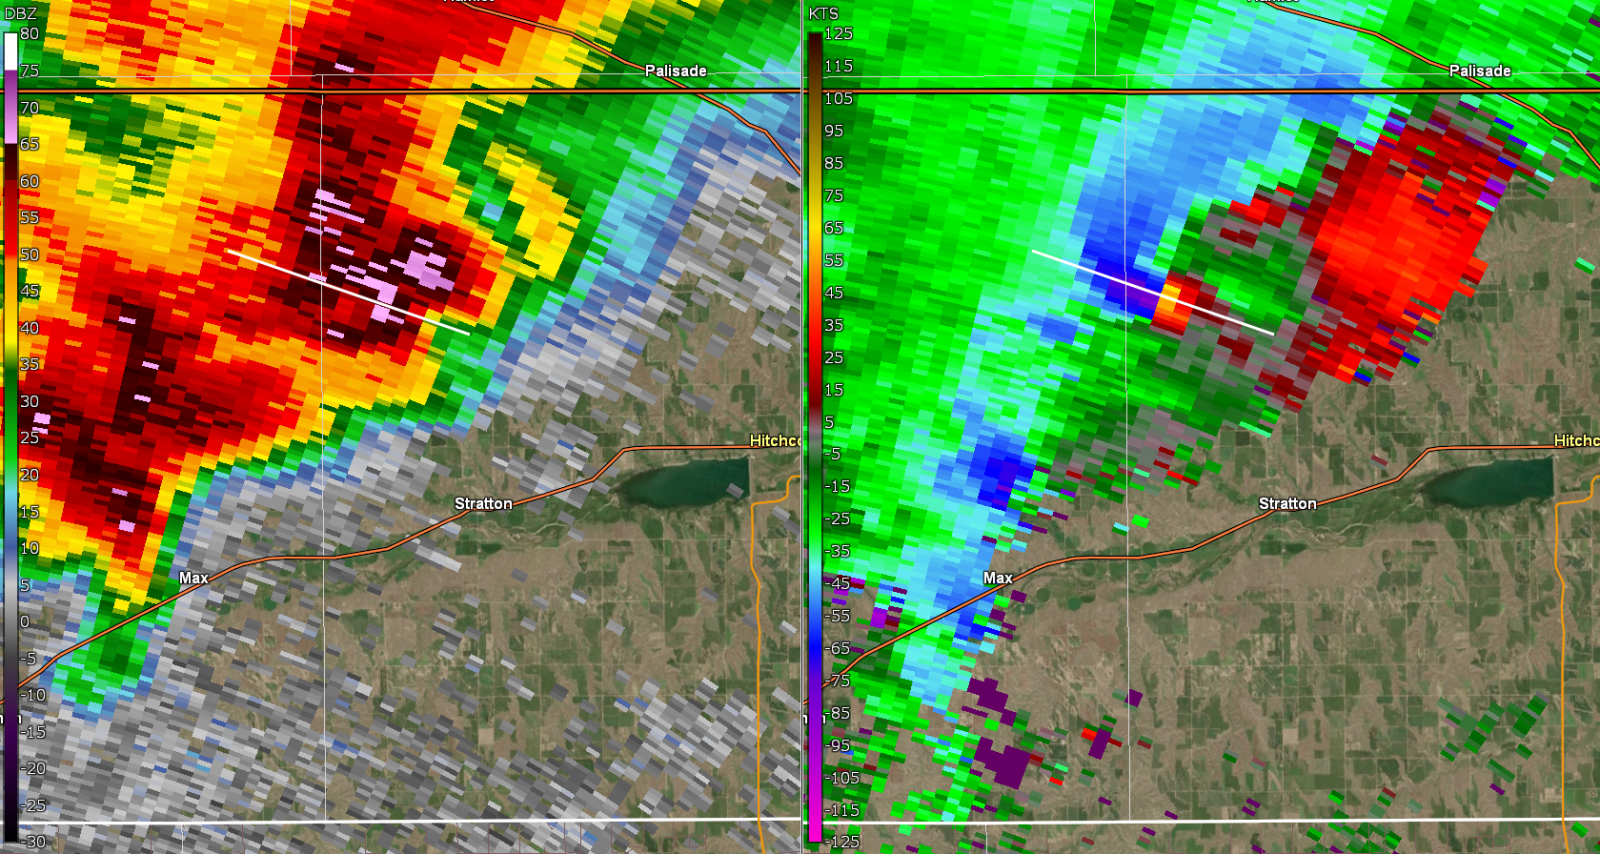
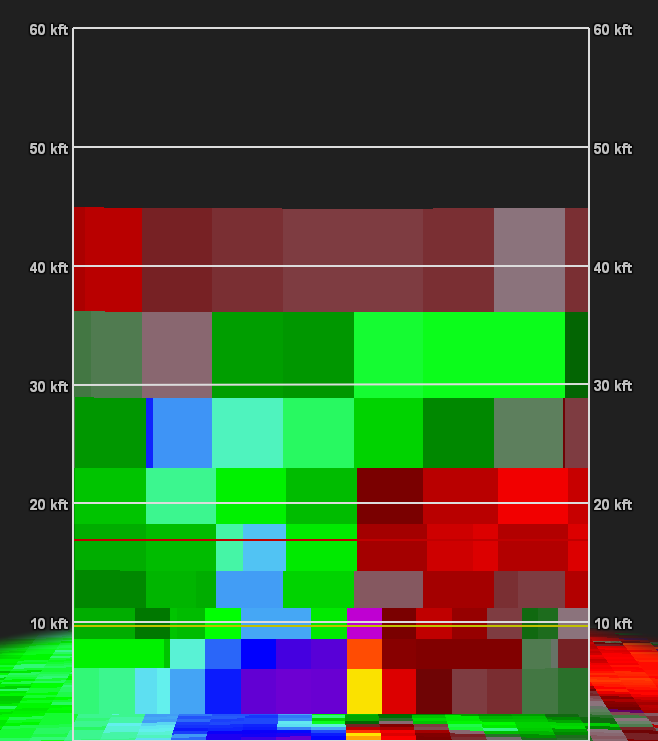
Cross Section of Storm Relative Velocity (SRV) along white line on image to the left. Green (cool) colors are towards the screen, red (warm) colors are away from the screen. This cross section indicated a strong and deep circulation (tilted to the north) associated with tornadic circulation. |
Hitchcock County Nebraska Tornado
 |
 |
 |
 |
|
0.5 Degree Reflectivity / Storm Relative Velocity Loop ending at 2328-2358 UTC. Note, change in color in last 3 frames is due to a change in storm motion, not a rapid change in overall intensity.
|
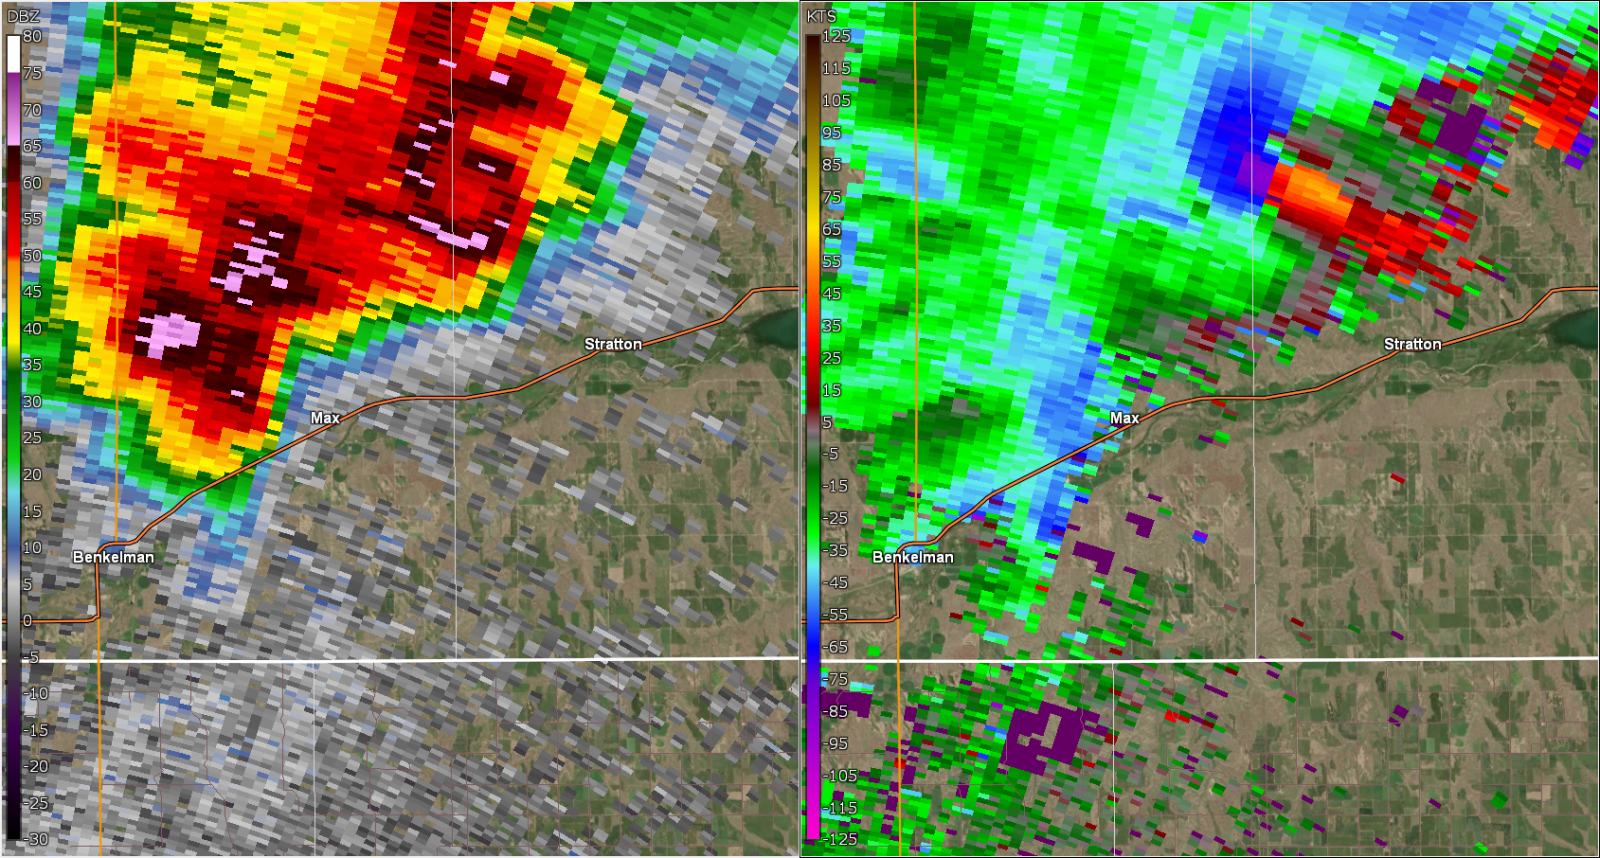
0.5 Degree Reflectivity / Storm Relative Velocity at 0001 UTC on May 19.
|
0.5 Degree Reflectivity / Storm Relative Velocity at 0004 UTC on May 19. Circulation has intensified to the northwest of Stratton. White line on image is for cross section in image to the right. |
Cross Section of Storm Relative Velocity (SRV) along white line on image to the left. Green (cool) colors are towards the screen, red (warm) colors are away from the screen. Image shows vertical extent of circulation.
|
Environment
Large scale pattern around the time the tornadoes (00 UTC 5/19/2025 or 6 pm MDT 5/18/2025) occurred featured a large trough over the Rockies with a strong shortwave trough embedded in this flow near the KS and CO border (Figure 1). At the 850 mb level (Figure 2 roughly 500-1000m above the ground) an intensifying low was observed near the KS and CO border with the center near Burlington CO. The green lines represent dewpoints greater than 8C with each contour indicating an increase of 2C. To the southeast of the low, very moist air was surging to the northwest, with strong dryline noted between Dodge City, KS and Amarillo , TX. Upper air balloon observations at Amarillo (Figure 3) and Dodge City (Figure 4) note the stark contrast in the airmass across the dryline. A closer look at the sounding for DDC indicated many different features that were supportive on supercell thunderstorms. Both mixed layer and most unstable (MU) CAPE where over 3000 j/kg indicating an extremely unstable environment. The hodograph for DDC showed the familiar downward pointing "C" shape indicating a large change in wind direction with height. The size of this shape also indicating winds are quite strong throughout the atmosphere. Storm relative helicity (which is a function of the curvature of the hodograph) between 0 and 1 km had a value of 571 m2/s2 which is extremely favorable for tornadoes. The combination of extreme instability, strong wind shear (especially near the surface) and other factors led to a significant tornado parameter (STP) of 12.9. This value is extremely high, being above the 90th percentile of EF4+ tornadoes (can see this on box and whiskers plot on bottom of hodograph image).
 |
 |
 |
 |
| Figure 1: 500 mb Analysis, May 19th | Figure 2: Caption | Figure 3: AMA Sounding May 19th 00 UTC | Figure 4: DDC Sounding May 19th 00 UTC |
 |
 |
||
| KDDC 00Z Sounding and Indices | KDDC 00Z Hodograph |
Near-storm environment summary.
| Figure 4: Caption | Figure 5: Caption | Figure 6: Caption |
Additional environmental data.
| Figure 7: Caption | Figure 8: Caption | Figure 9: Caption |
 |
Media use of NWS Web News Stories is encouraged! Please acknowledge the NWS as the source of any news information accessed from this site. |
|

