National Weather Service United States Department of Commerce

Heavy to Excessive Rainfall in the Central Appalachians; Severe Weather in the Mid-South; Hot Weather in Southern California

Heavy to excessive rainfall may lead to flooding today over southwest Pennsylvania into northern West Virginia, and western Maryland. Severe thunderstorms are possible this afternoon and evening in the Mid-South and across Eastern North Carolina. An extended period of hot weather is forecast for parts of coastal southern California including Los Angeles from today through Thursday. Read More >

Rating EF-2 Peak Wind 120 mph
Path Length 5.75 miles Peak Path Width 200 yards
Start Time 7:10 AM End Time 7:18 AM

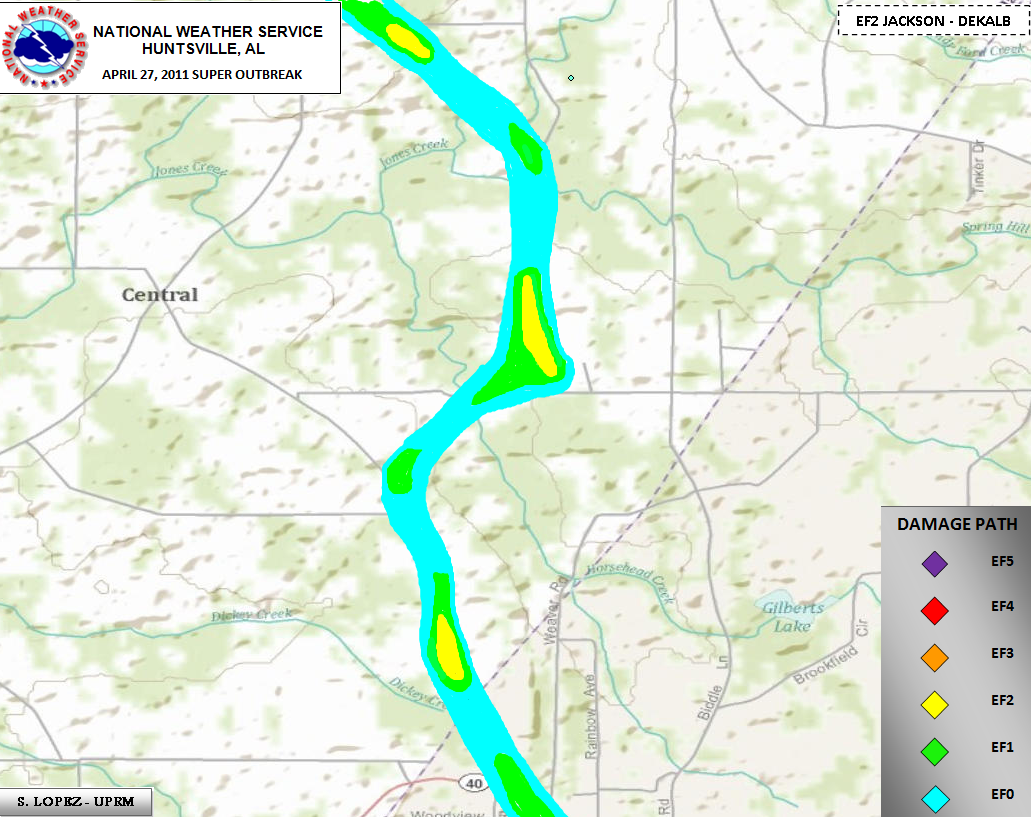
Complete Tornado Track Map 


Click on the image above to display an experimental contoured map created by Suheiley Lopez (UPRM) dipicting the strength of damage indicators seen along the track during NWS storm surveys.


      This tornado touched down very briefly in the Henagar area and tracked northward. Numerous large trees, some old oak trees, were snapped. Other large trees were uprooted as well along this portion of the track in DeKalb County.
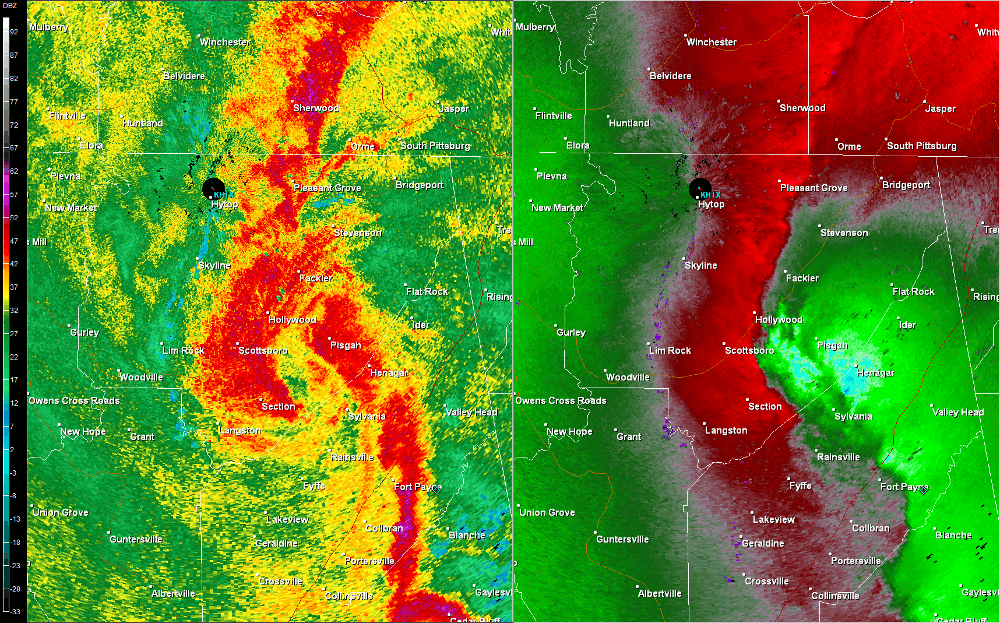
     The tornado continued moving north northeast from DeKalb County into Jackson County destroying at least 3 barns. The tornado produced EF-2 intensity winds as it struck a well-constructed home south of Rosalie, collapsing the west end of the home completely. A shed was destroyed on this property as well. Additional trees were snapped or uprooted in Rosalie along highway 71. The tornado then turned more northeast along highway 71 snapping or uprooting several more large trees. The tornado lifted near the junction of highway 71 and CR 345.

Hytop, AL Radar (HTX) reflectivity radar loop of the EF-2 tornado track from 7:08 - 7:31 am CDT.  The imagery on the left is reflectivity, while the imagery on the right is storm-relative velocity.  Click on the image to loop.

Hytop, AL Radar (HTX) radar loop of the EF-2 tornado track.  The imagery on the left is reflectivity, while the imagery on the right is storm-relative velocity.  Click on the image to loop.

 Back to April 27 Survey Info