|
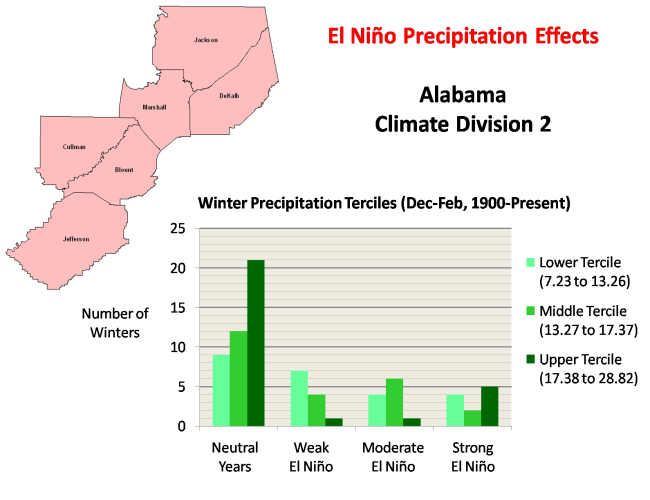
The graph below details impacts during the winter months (December through February) associated with El Niños of the indicated intensity in Alabama climate division 2. Winter precipitation is divided into terciles, or the driest third, the middle third, and the wettest third of all winters between 1900 and 2007. The precipitation totals associated with these groups are indicated on the graph. For example, for all winters since 1900 for this climate division, the driest third had precipitation totals from 7.23 inches to 13.26 inches. Notice in the graph below that only one winter during all of the moderate El Niño events during the period experienced precipitation totals in the wettest tercile. Of the 11 winters during moderate El Niño events, six ranked in the middle third of all winters, while four were among the driest third of all winters. Thus, the vast majority of past winters during moderate events have been in the middle third or the driest third. While not as strong as the trend in Alabama climate division 1, the trend towards dry conditions is still noted.
|
 |
|
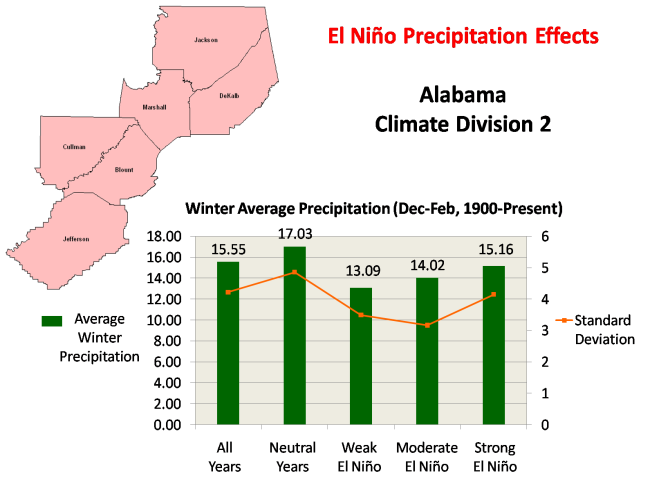
The graph below shows El Niño's effect on average winter precipitation between 1900 and 2007. Notice that average precipitation decreases fairly markedly during weak El Niño events vs. neutral conditions, and that an upward trend in precipitation is noted as El Niño conditions strengthen. Still, average winter precipitation is slightly more than three inches lower for moderate El Niño events when compared to neutral years. Also, notice that the standard deviation, or variability, of winter precipitation is lowest during moderate El Niños. In fact, average precipitation during neutral winters is nearly one standard deviation above average precipitation during weak or moderate El Niño winters.
|
 |


 Local Radar
 Weather Map