|
Weather Summary/Overview |
||||||||||||||||||
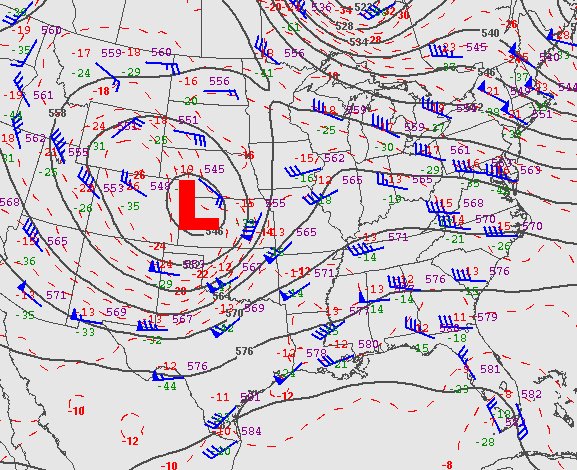
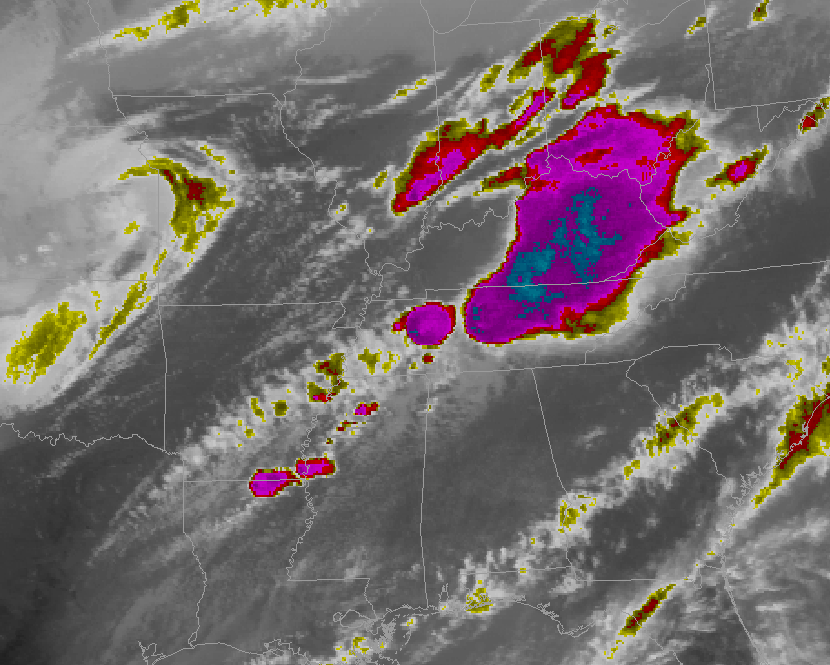
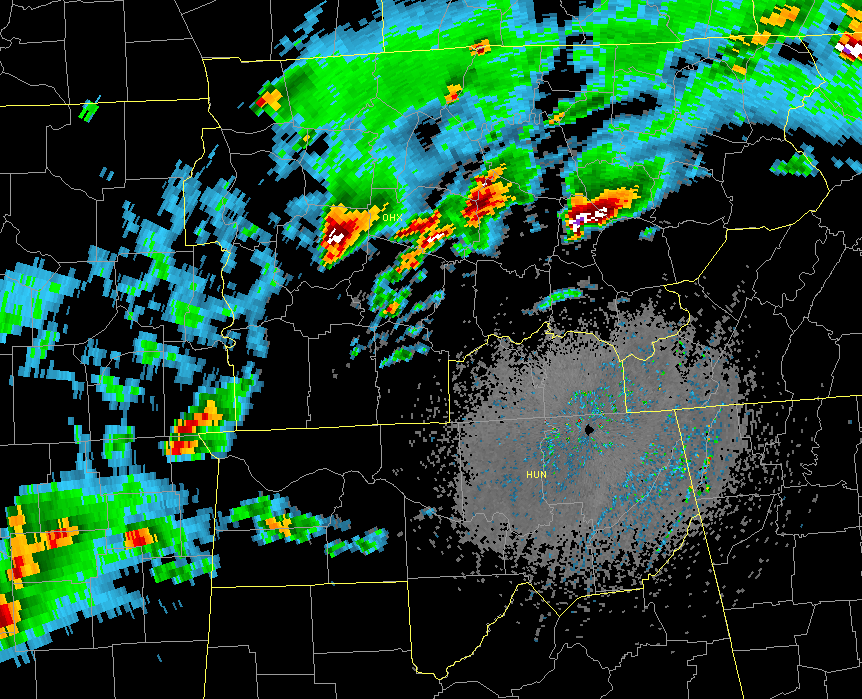
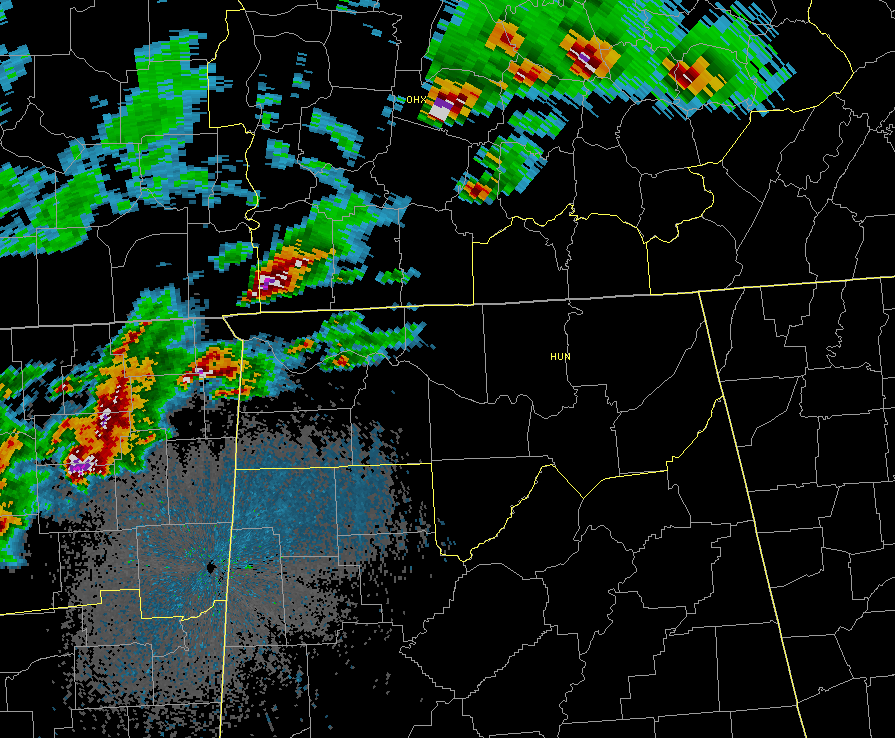
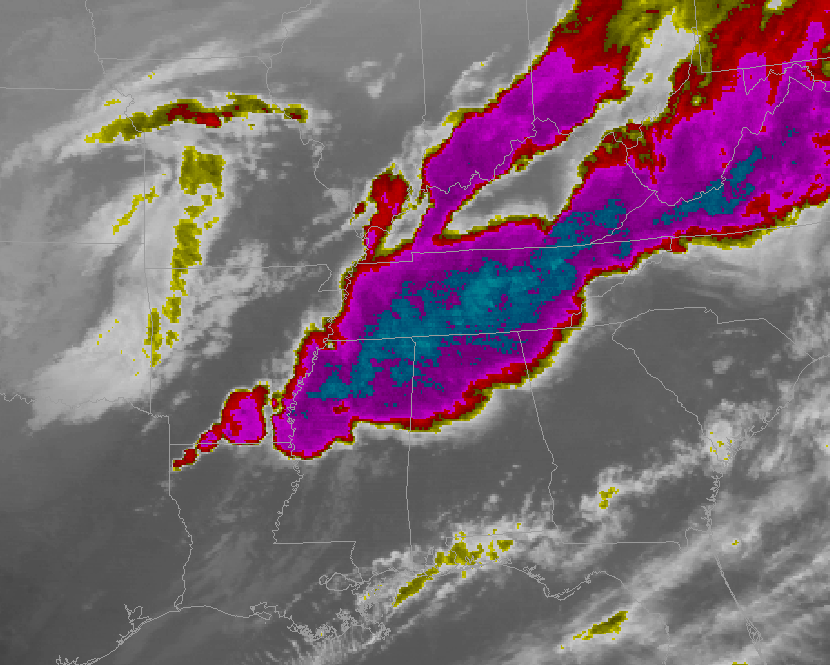
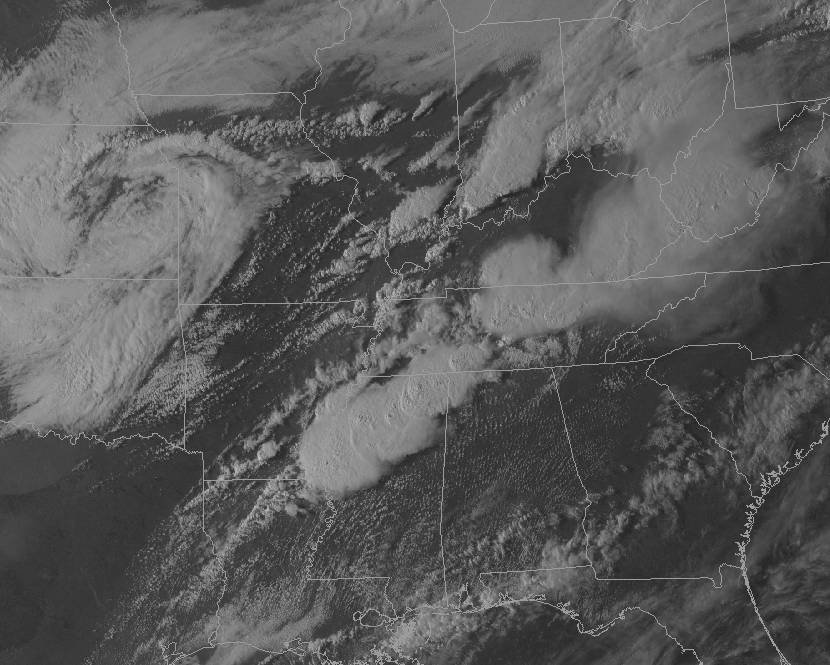
| Early on Friday the 7th, a classic spring severe weather setup began to unfold across the area. A strong upper level storm system (see an upper-air map) was positioned across the central Plains with an associated band of very strong winds aloft extending into Arkansas and Missouri. This system was forecast to shift southeast with time and approach the mid Mississippi and Tennessee Valleys Friday evening. At the same time, a strong surface low pressure system was located across Kansas (see a surface map from 7am 4/7/06) with a trailing dryline extending through the Southern Plains. This surface low was forecast to develop east southeast and to eventually track across northwest Tennessee by the late night hours. The combination of these two features helped to bring a surge of gulf moisture northward into the Tennessee Valley and also create favorable wind shear conditions for supercell thunderstorms and tornadoes. Supercell thunderstorms began to erupt rapidly across western Tennessee and Kentucky during the late morning hours on Friday. Several of these supercell thunderstorms continued to gain strength and wind energy as they tracked eastward toward the Nashville Metropolitan area by the early afternoon hours (see a radar image from 4:30pm Friday afternoon). However, storms were slower to develop across the Tennessee Valley. The primary reason was that a pocket of warm air about 5000 feet above the ground, commonly referred to as a “cap” or thermal inversion, was inhibiting the growth of thunderstorms. This cap began to erode by late in the afternoon as moisture began to increase across the region and the upper level trough began to bring in cooler temperatures above the surface. Thunderstorms began to erupt across northern Mississippi shortly after 4 PM CDT Friday afternoon, and many of these became severe very quickly (see a radar image from 5pm Friday afternoon). The first tornadic supercell moved into northwest Alabama around 5 PM, but it would not be the last. All totaled, eight severe storms moved across the Tennessee Valley region between 5 PM and midnight, several of which were long lived supercells.
|
||||||||||||||||||
|
|
||||||||||||||||||


 Local Radar
 Weather Map