National Weather Service United States Department of Commerce
  Storm surveys have been conducted examining storm damage that occurred on Wednesday, May 6th. Summaries for these surveys are found below. All tornado ratings use the Enhanced Fujita Scale.


Synopsis

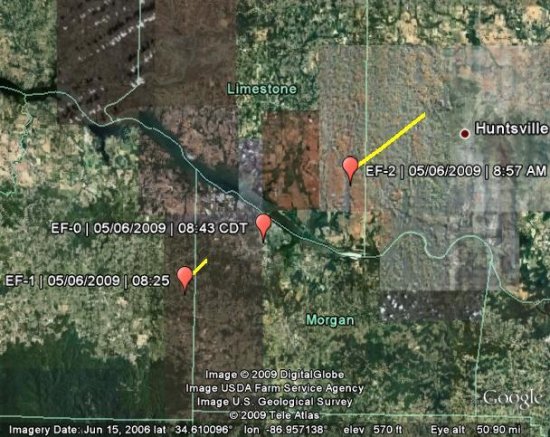
A squall line moved across the Tennessee Valley during the morning of May 6 2009. Showers and thunderstorms within this line produced flooding and flash flooding across the already saturated ground. Some of the storms within became strong to severe, with many reports of wind damage and a number of tornadoes. The strongest tornado during this event began before 9:00 AM, and moved northeast across the City of Madison (where EF-2 damage was noted), before lifting over western Huntsville.

Surveys were conducted for these storms later during Wednesday and again on Thursday, May 7th. Below is some information on the tornadoes that occurred. More information will be posted as it becomes available.


Limestone and Madison Counties

Rating EF-2 Peak Wind 115 mph
Path Length 10.9 miles Peak Path Width 75 yards

Summary: The tornado touched along Segers Road in Eastern Limestone County snapping and uprooting numerous large trees. A tree fell on a mobile home on Hardiman Road and split it in half. The tornado continued to move northeast and crossed into Madison County. Significant tree damage occurred in several subdivisions along County Line Road, Mill Road and further east along Browns Ferry, Wall Triana, and Hughes Roads. Windows were blown out of several houses in the Huntington Chase subdivision along with significant roof damage. A large attached garage was completely flattened along Browns Ferry, and roof damage was observed in the Bridgefield subdivision. Several residents of Bridgefield noted that they received the tornado warning and took cover before the storm hit. Sporadic damage persisted as the tornado moved northeast across Slaughter Road and into the Providence development. The tornado finally lifted near Research Park and Plummer Road.

This National Weather Service radar image from 8:57am shows strong rotation in eastern Limestone County approaching the west side of Madison. This radar image shows the storm around the time the tornado touched down. The base reflectivity product in the left panel shows rainfall intensity. The storm relative velocity product in the right panel shows winds toward (in green) and away (in red) from the radar at Hytop, AL.


Lawrence and Morgan Counties

Rating EF-1 Peak Wind 105 mph
Path Length 4 miles Peak Path Width 75 yards

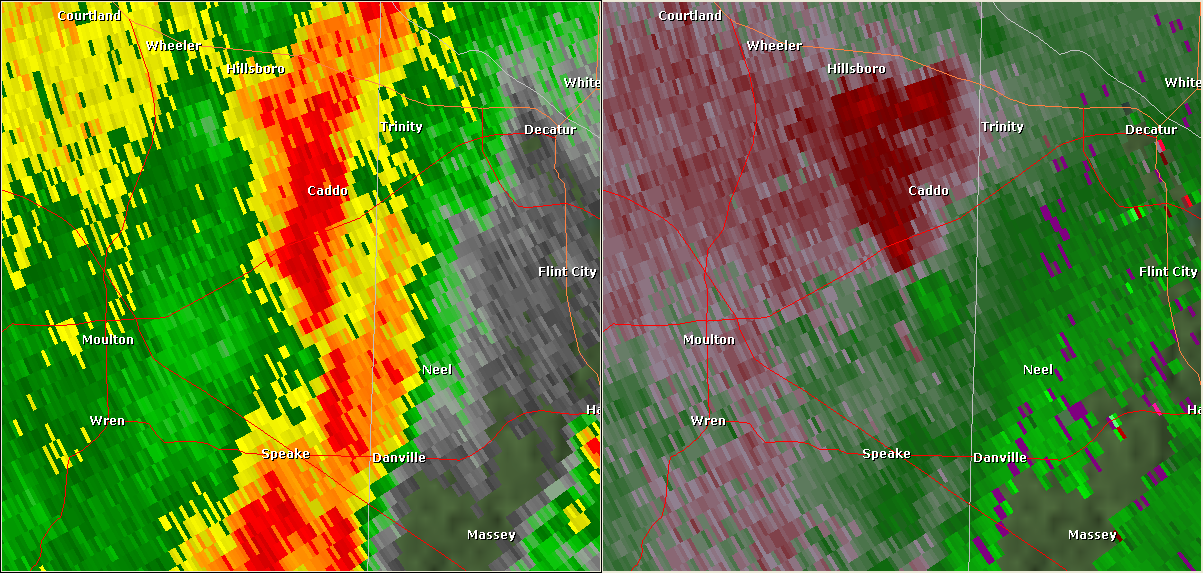
*Summary: A line of thunderstorms pushed across Lawrence and Morgan counties on the morning of Wednesday May 6, 2009. The storm that produced damage in eastern Lawrence and western Morgan counties continued eastward and produced additional tornado touchdowns. The following is a breakdown of each specific tornado touchdown:

Touchdown #1 (Lawrence county): the tornado touched down in the backyard of a mobile home along County Road 327. At this location, a large oak tree fell onto the mobile home in which a woman and her young daughter were taking shelter. The home was a total loss due to the damage from the large tree slicing the home into two sections. Numerous trees were uprooted and snapped surrounding the home.

The damage path continued moving northeast from this location. Along County Road 328, significant damage occurred at a mobile home. More than half of the structure was moved off of its well-secured foundation and the majority of the roof was blown off. A few outbuildings were completely destroyed, and vehicles were moved from their original locations in the driveway. Numerous large trees were snapped and uprooted at this location.

The storm continued moving northeast and crossed into western portions of Morgan county. Numerous large trees were uprooted or snapped along the path of this storm. Minor structural damage to homes occurred along the path when trees were blown down onto them. The tornado lifted about half of a mile north of the intersection of Raper Road and Pleasant Hill Road.

This National Weather Service radar image from 8:24am shows rotation in eastern Lawrence County south of the Midway-Caddo area. This radar image shows the storm shortly before the tornado touched down. The base reflectivity product in the left panel shows rainfall intensity. The storm relative velocity product in the right panel shows winds toward (in green) and away (in red) from the radar at Hytop, AL.


Morgan County

Rating EF-0 Peak Wind 80 mph
Path Length 0.75 mile Peak Path Width 25 yards

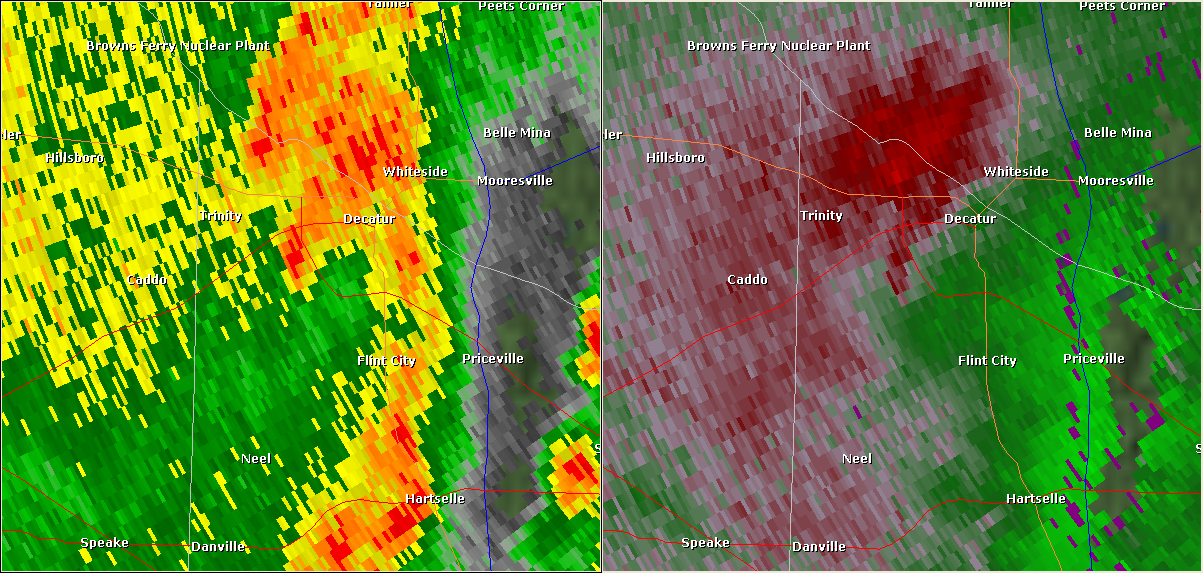
*Touchdown #2 (Morgan County): The tornado briefly touched down near the intersection of 7th Avenue and 5th Street in Decatur. Trees were uprooted and snapped along the brief damage path. Several homes and vehicles were also damaged by the downed trees. The tornado lifted near the intersection of 16th Avenue and Sherman street.

This National Weather Service radar image from 8:38am shows rotation in the Decatur area. The base reflectivity product in the left panel shows rainfall intensity. The storm relative velocity product in the right panel shows winds toward (in green) and away (in red) from the radar at Hytop, AL.