 |
||||||||||||||||||||||||
|
Additional Information About Storm Reports Received Can Be Viewed Here. |
||||||||||||||||||||||||
|
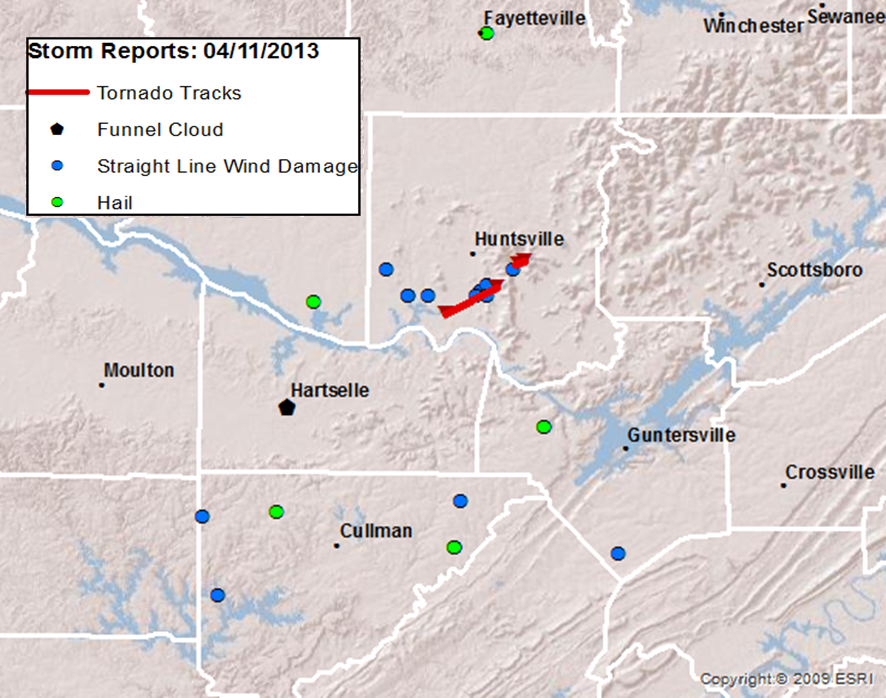
Tornado Surveys Completed tornado track location/data) |
||||||||||||||||||||||||
|
|
||||||||||||||||||||||||
|
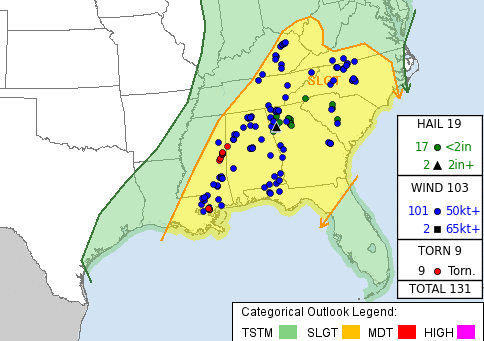
Summary: On April 11th, a line of heavy showers and scattered thunderstorms extended just ahead of a cold front at 10 am (see below, left). As the late morning and early afternoon hours progressed, breaks in cloud cover increased instability as the cold front pushed east into northwestern Alabama. This line quickly intensified shortly after 2 pm, as it moved into north central and eastern portions of Alabama. Scattered severe thunderstorms occurred along the line between 2 pm and 7 pm, creating straight line wind damage,small hail, and two weak tornadoes in the Huntsville area. The image below on the right shows the Day 1 Severe Weather Outlook from the Storm Prediction Center, which was issued at 8 am on April the 11th. Overlayed are severe weather reports which were received on the 11th. Click on either image below to see a more detailed and larger image.
|
||||||||||||||||||||||||
|
||||||||||||||||||||||||
|
|
||||||||||||||||||||||||
|
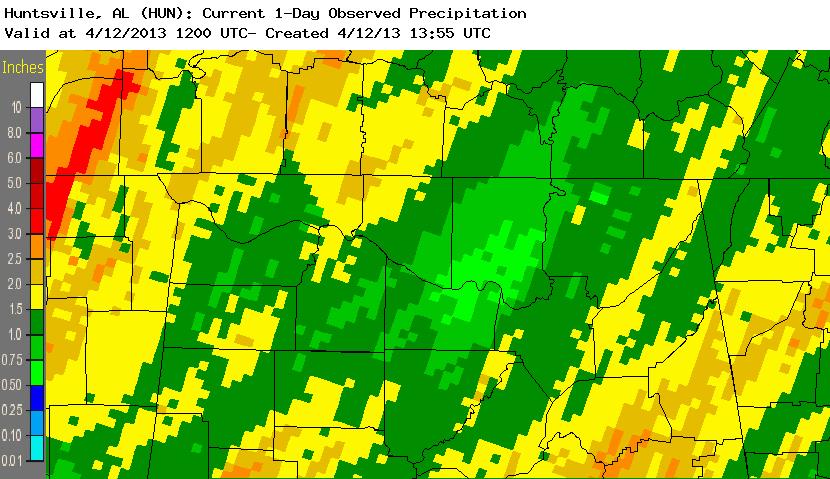
The slow movement of this line also produced some heavier rainfall. Below is a image of rainfall totals from 7 am on Thursday (April 11th) through 7 am Friday (April 12th). Most of the heavier rainfall fell in a short 2 to 4 hour period. |
||||||||||||||||||||||||
|
|


 Local Radar
 Weather Map