|
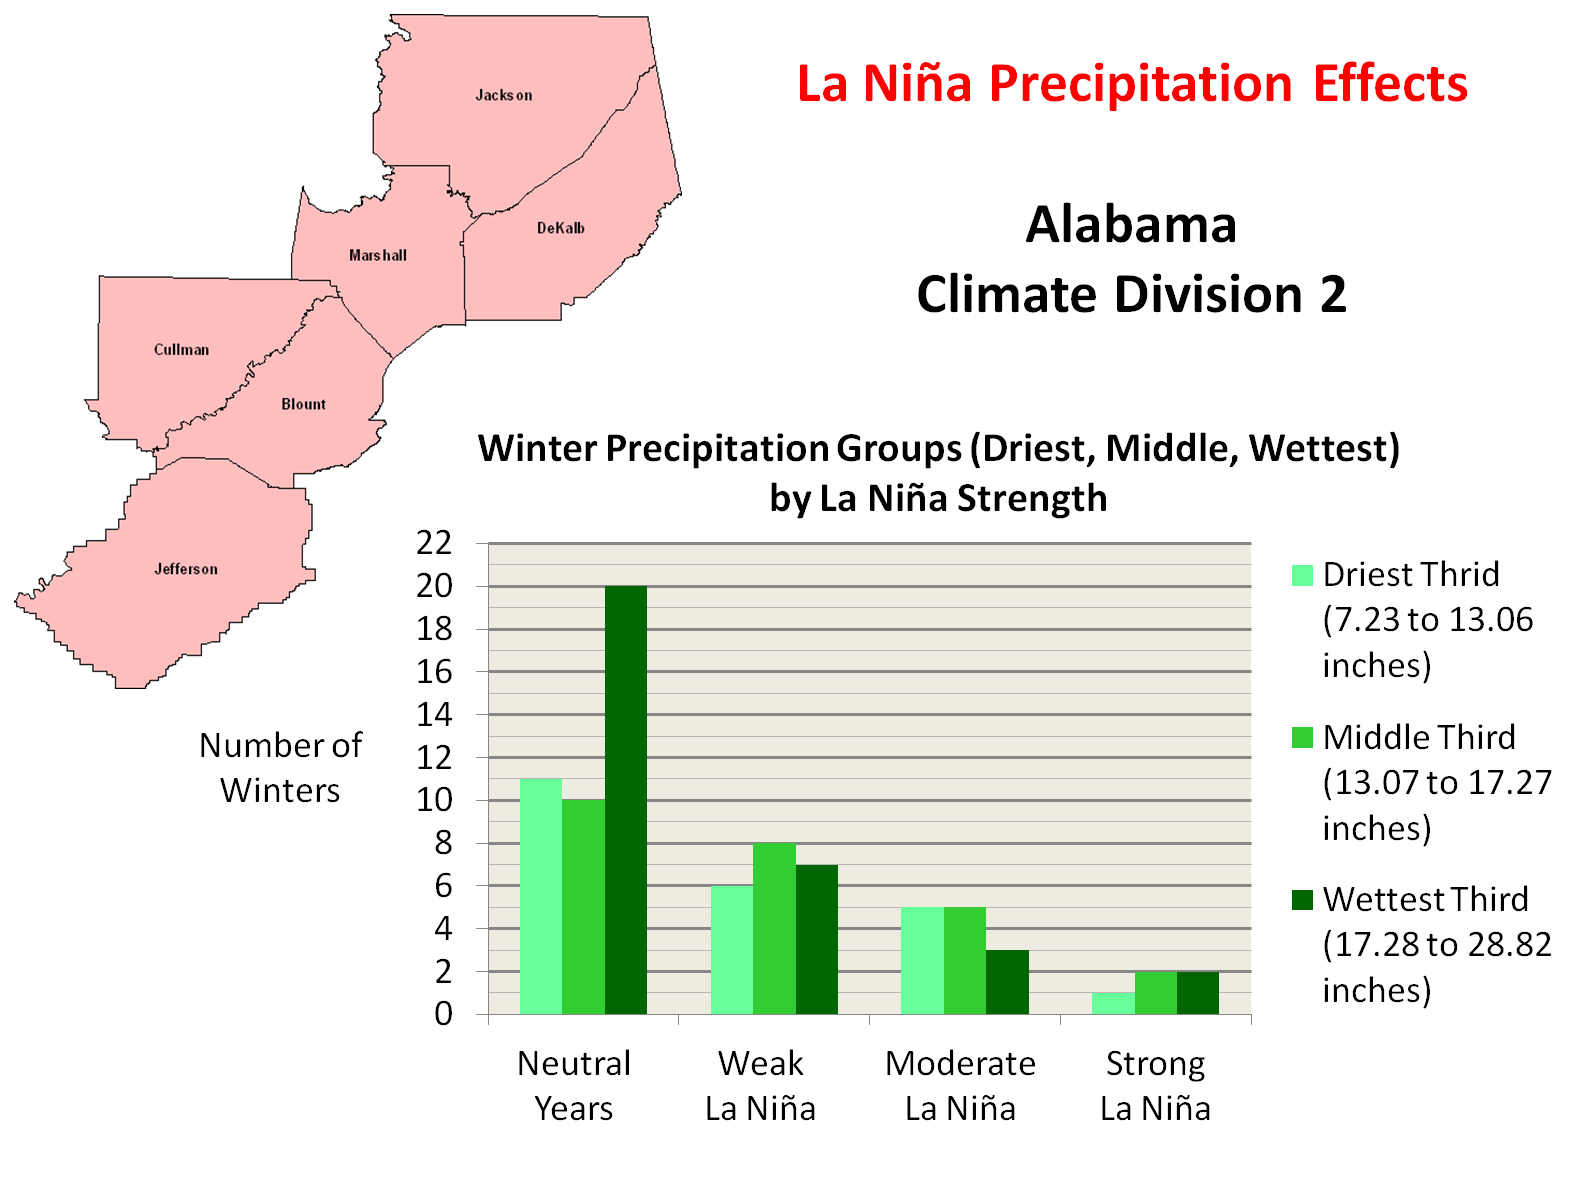
The graph below details impacts during the winter months (December through February) associated with La Niñas of the indicated intensity in Alabama Climate Division 2. Winter precipitation is divided into terciles, or the driest third, the middle third, and the wettest third of all winters. The precipitation totals associated with these groups are indicated on the graph. For example, for all winters since 1896 for this climate division, the driest third had winter season precipitation totals of 7.23 inches to 13.06 inches. It is important to pay particular attention to La Niñas of strong intensity, since that is the anticipated magnitude of this winter's event. Notice in the graph below, for example, that the majority of winters during strong La Niña events since 1896 were among the middle or wettest third. Of the 5 winters during strong La Niñas, two were in the wettest third, two in the middle third and one in the driest third of all winters since 1896. |
 |
|
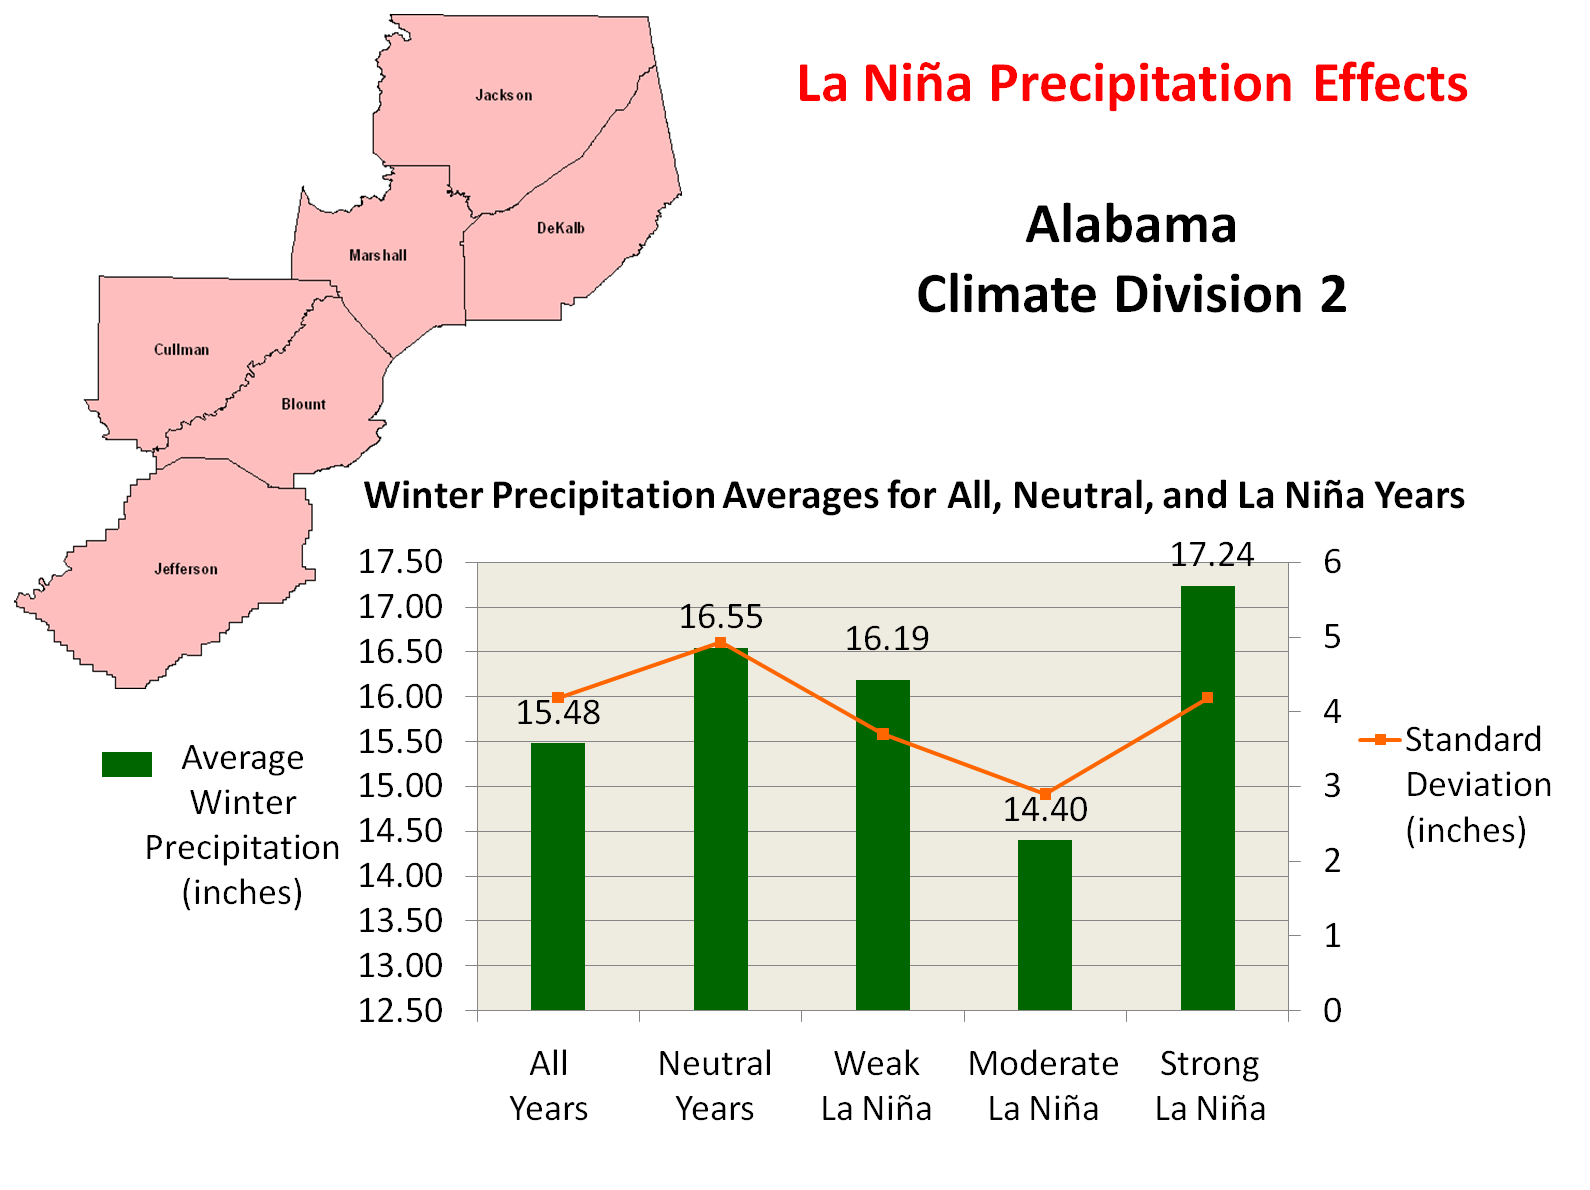
The graph below shows La Niña's effect on average winter precipitation since 1896. Notice that average precipitation decreases fairly markedly during moderate La Niñas, but that an upward trend is noted as La Niña conditions strengthen. However, also notice that the standard deviation value is relatively high during strong La Niña events. This indicates relatively high variability of precipitation is observed in this region of northeast Alabama during strong La Niña winters. Thus, while precipitation may average higher, resulting winter totals have exhibited a rather large range of values. |
 |


 Local Radar
 Weather Map