|
|
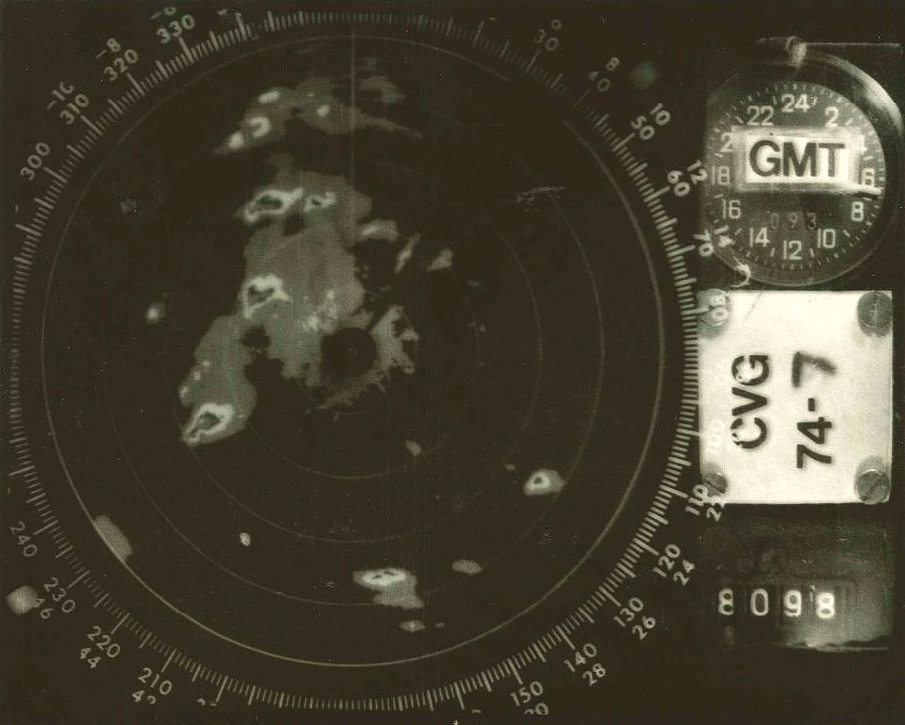
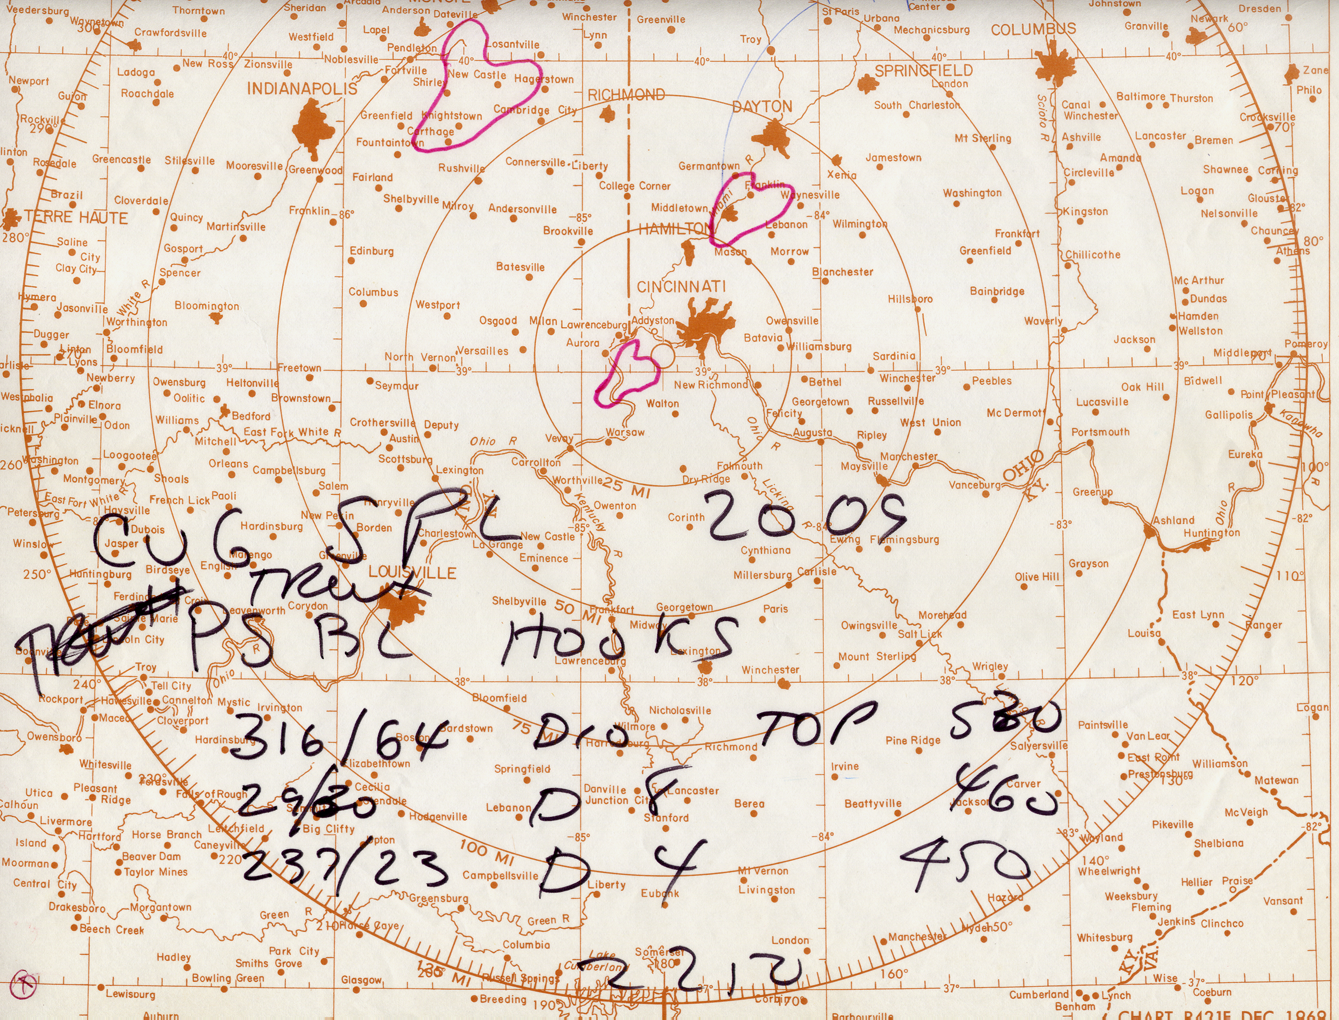
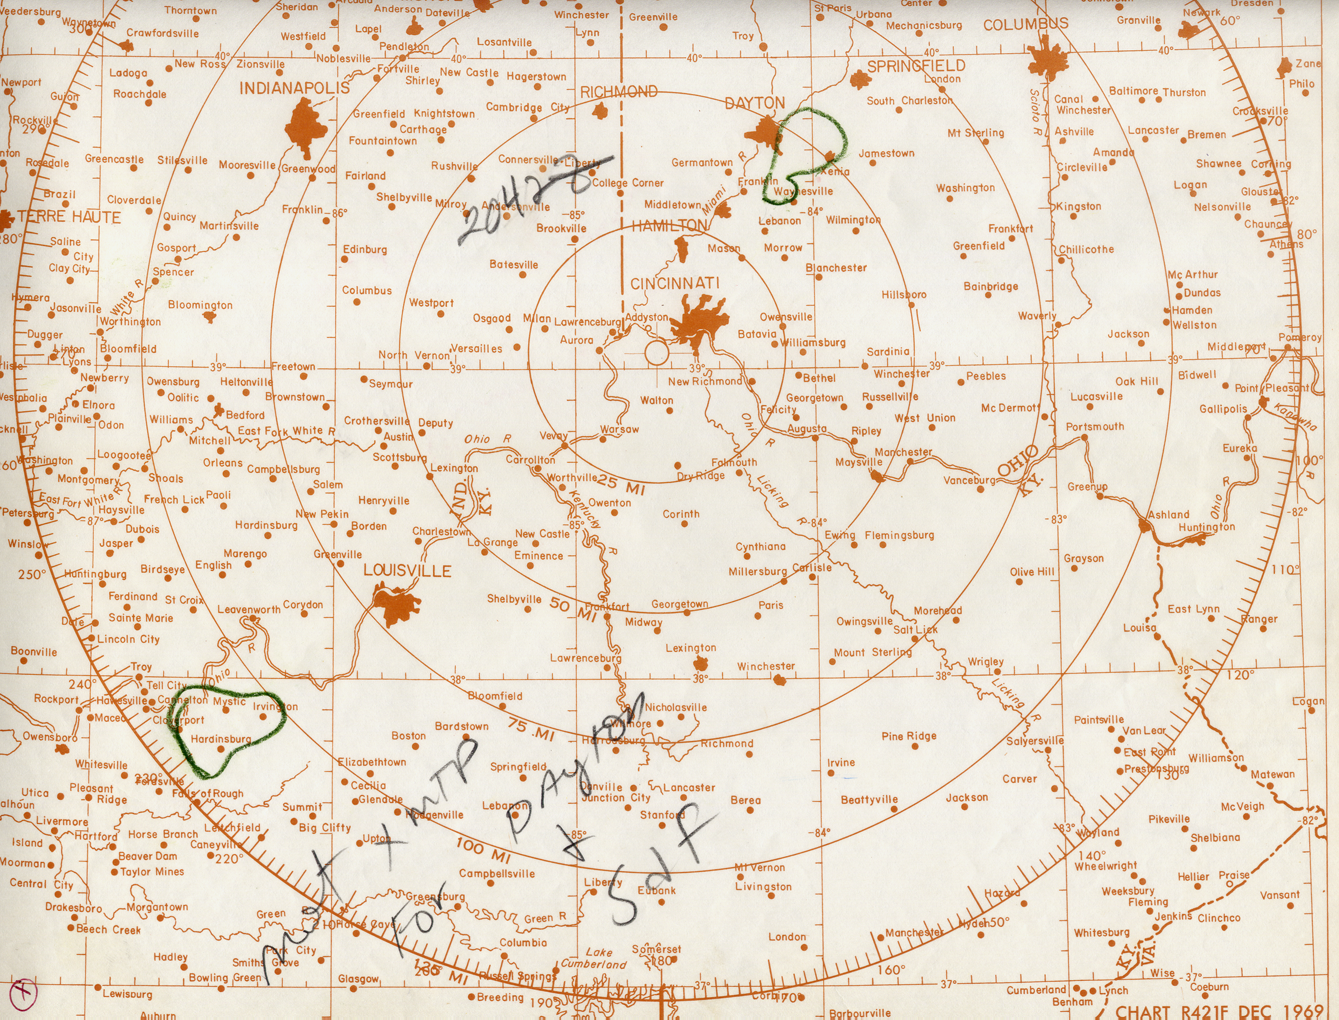
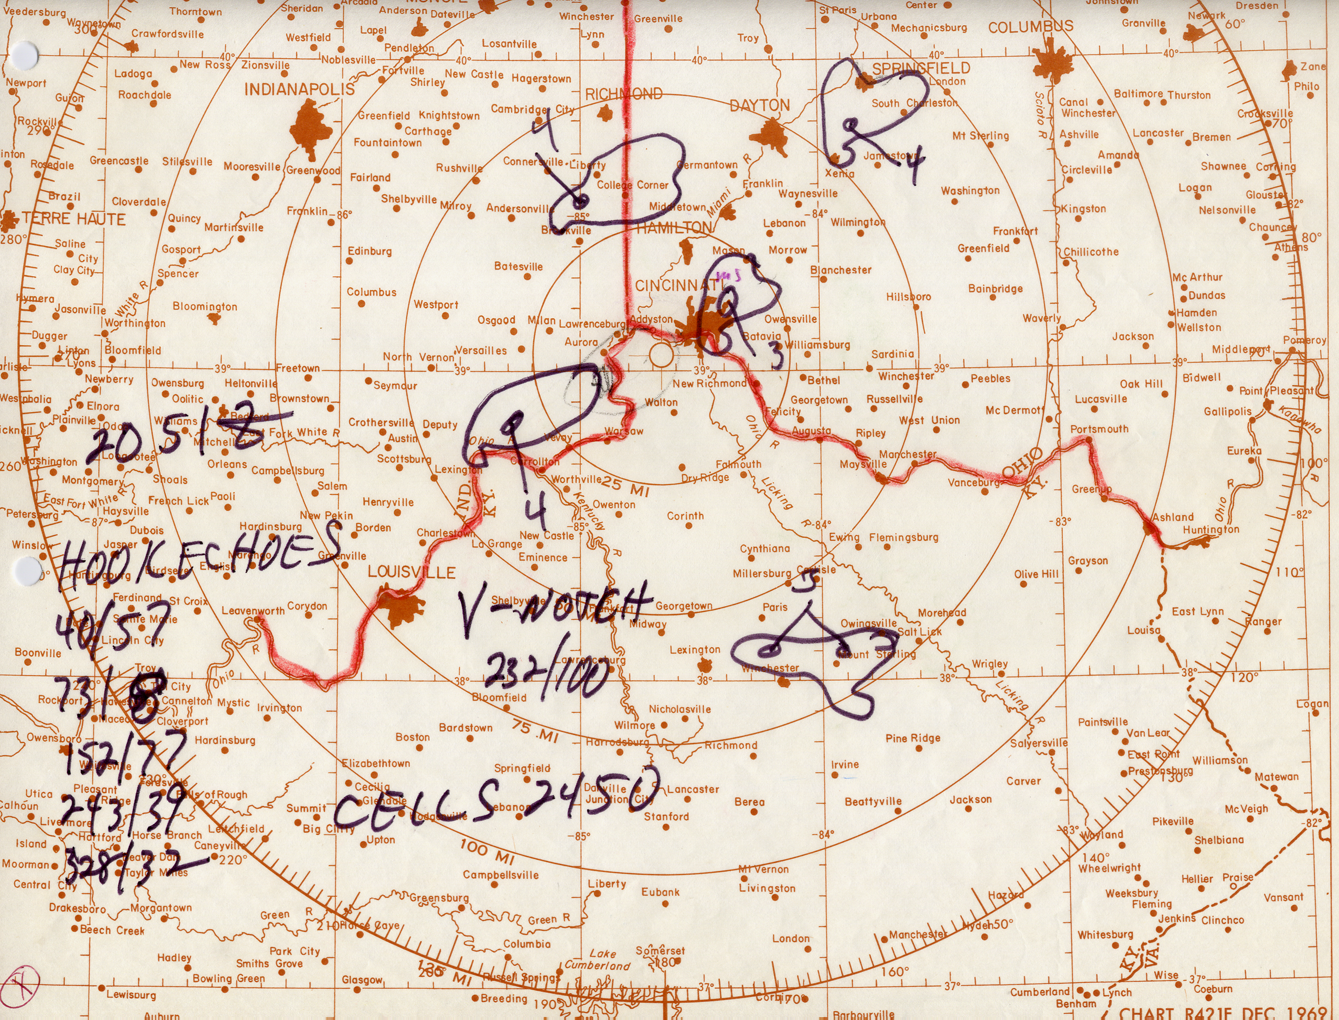
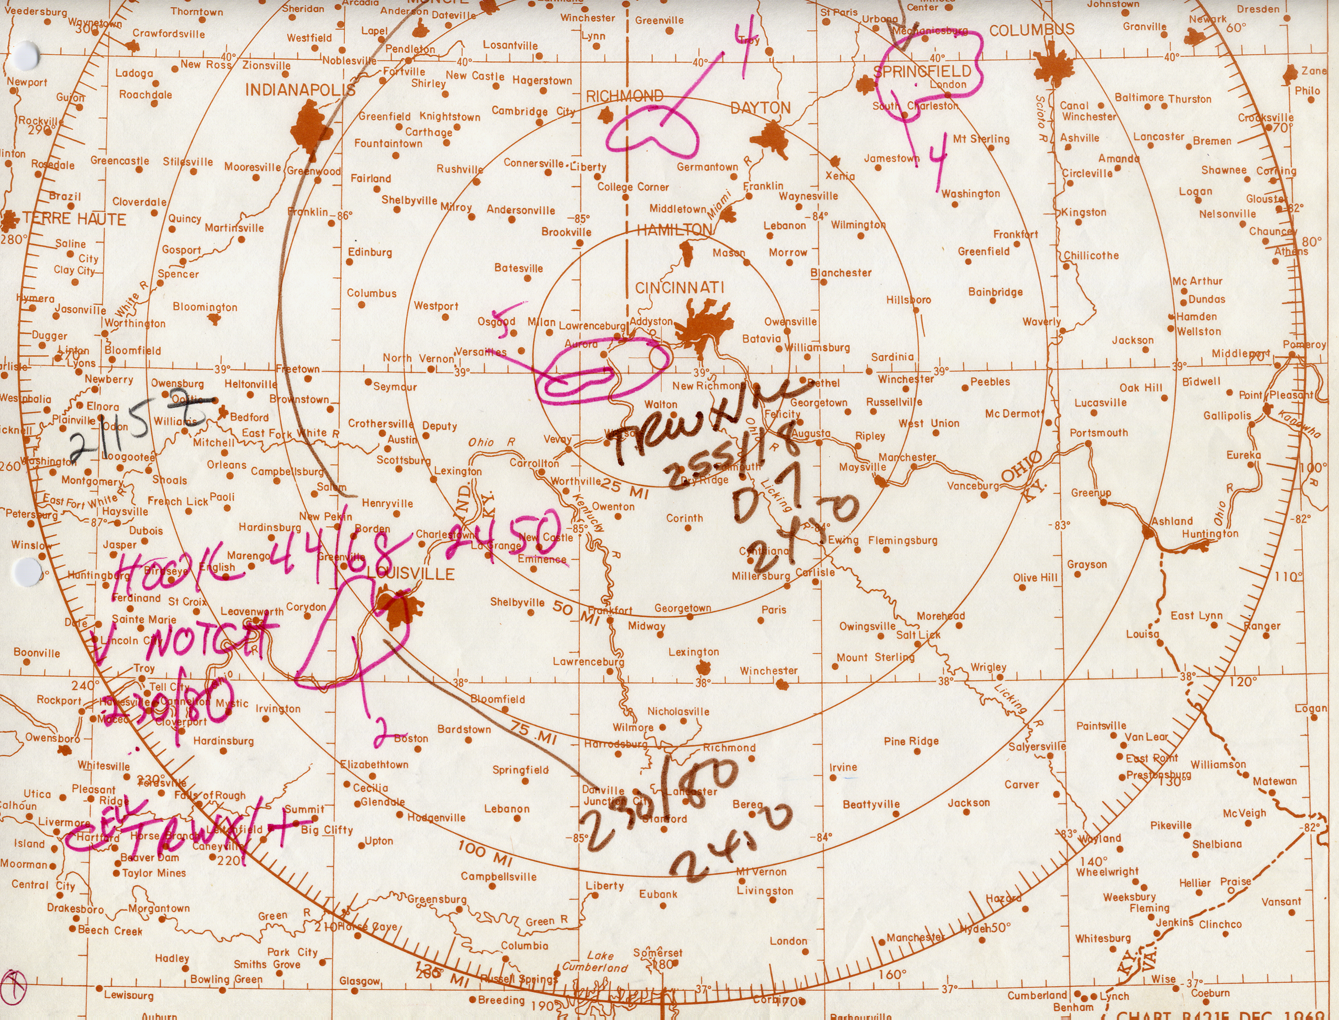
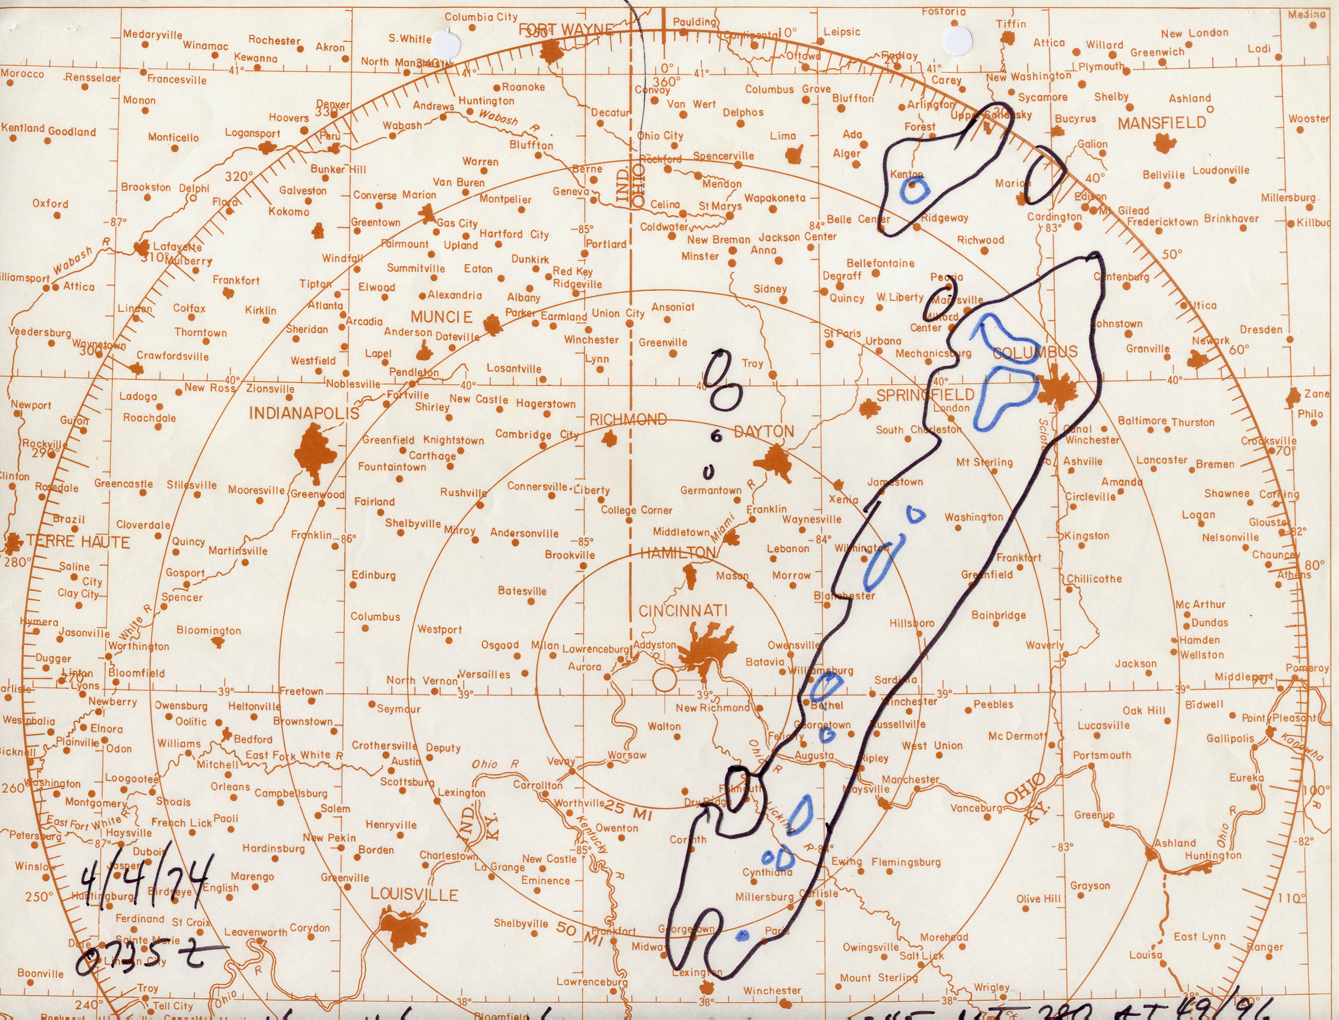
CVG WSR-57 radar shows
several hook echoes (courtesy of NCDC) |
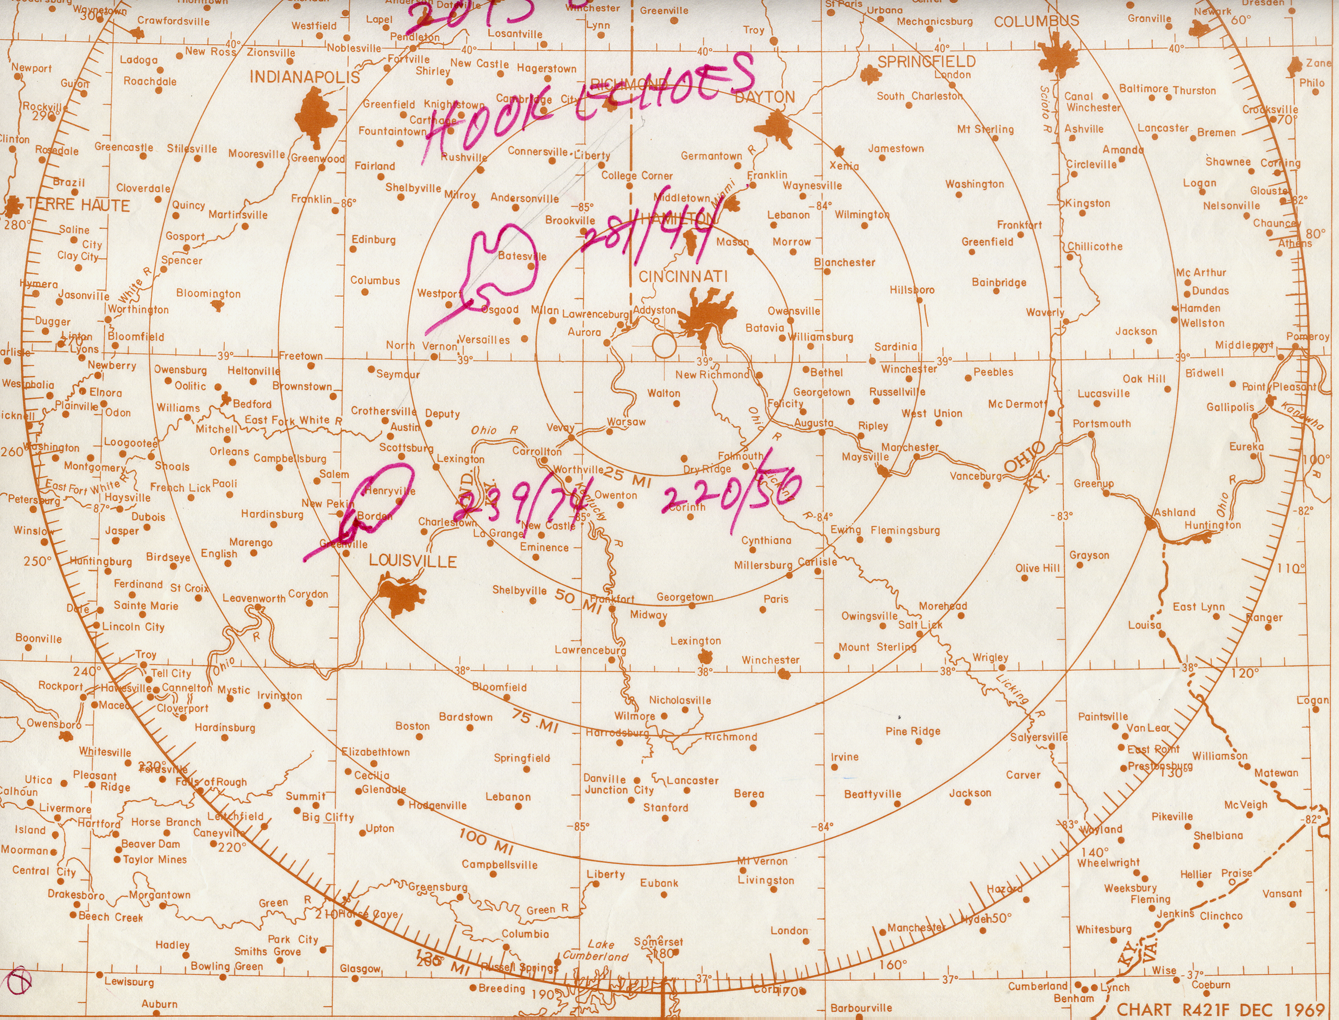
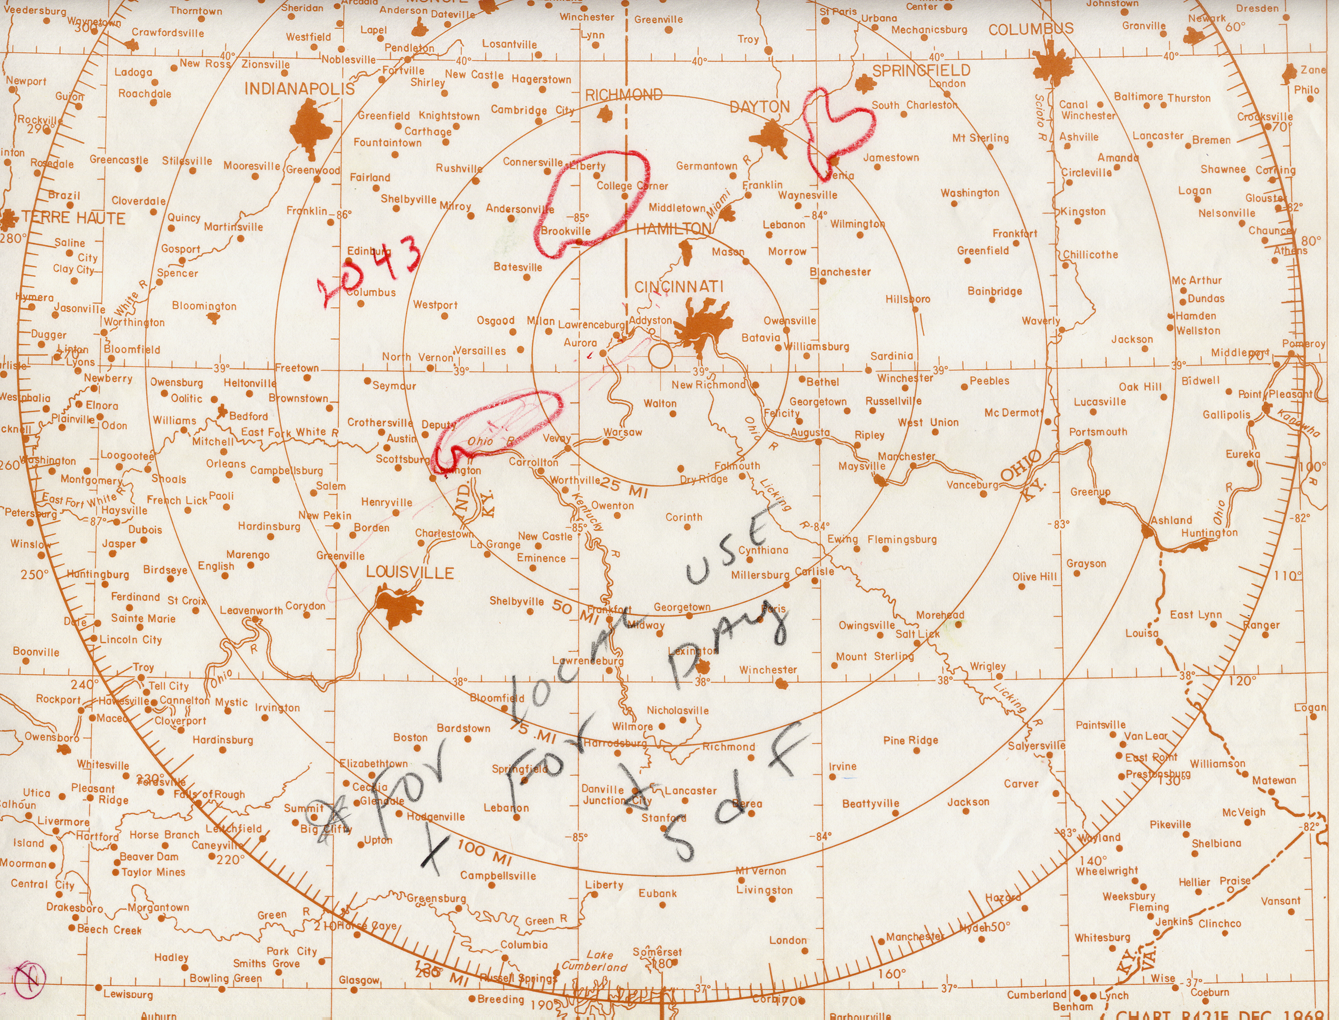
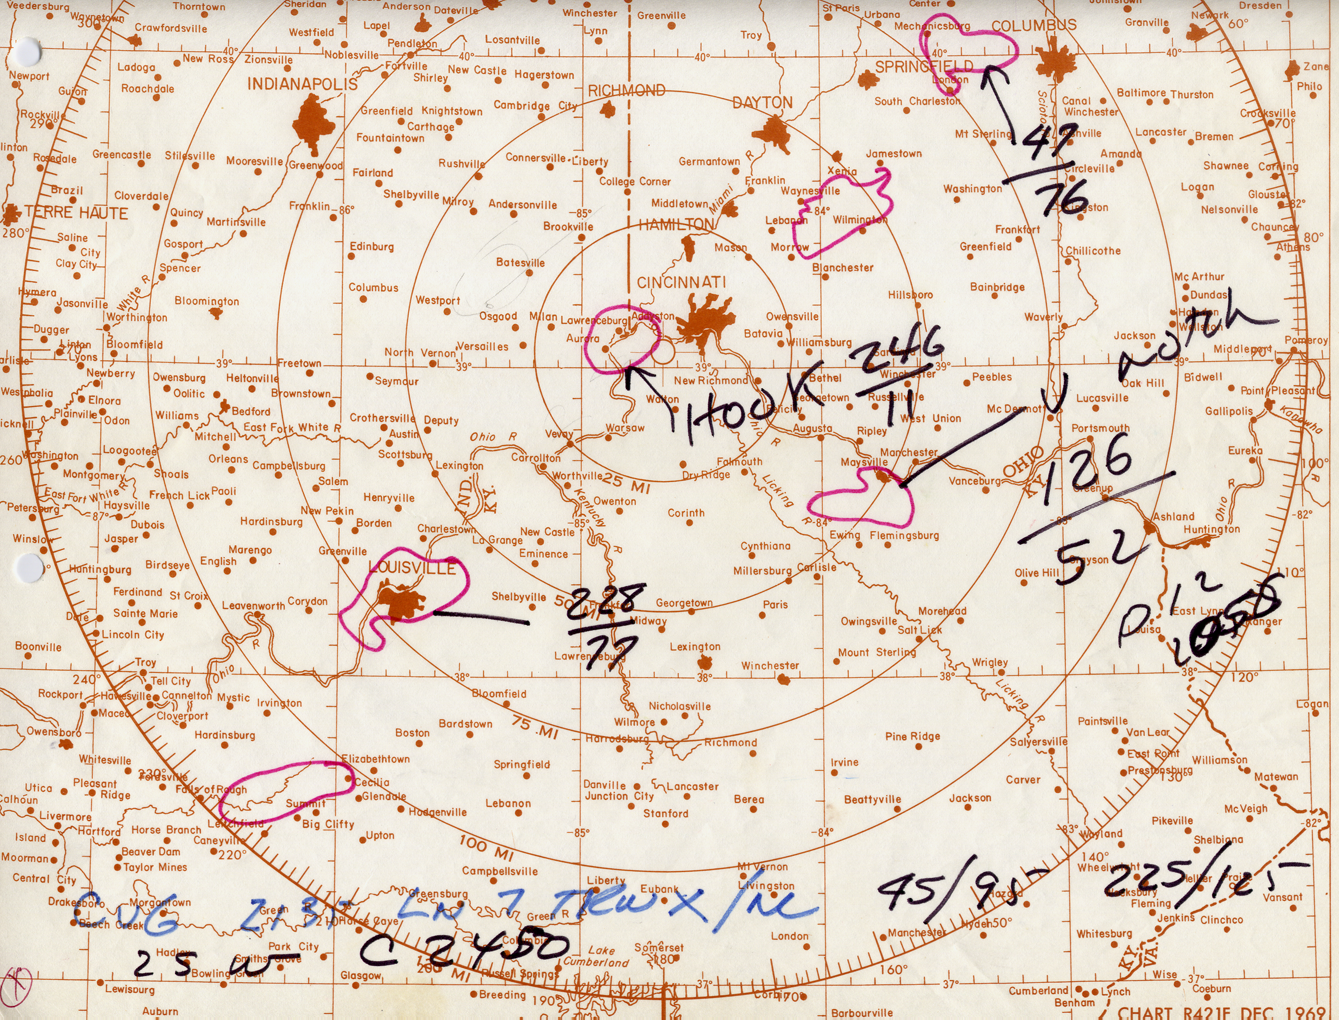
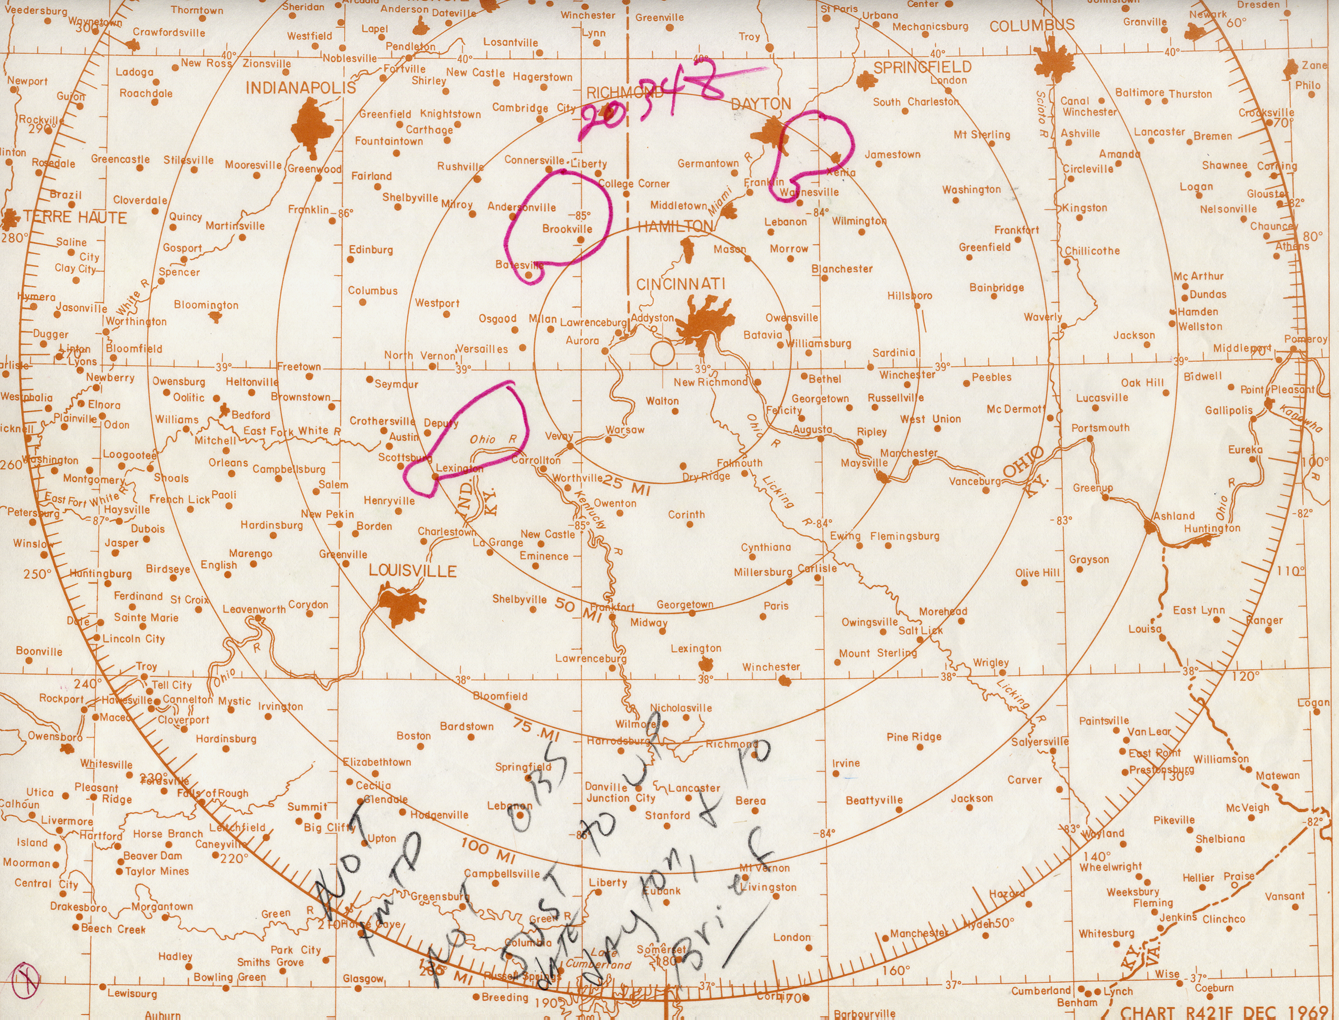
CVG WSR-57 radar shows
several hook echoes (courtesy of NCDC) |
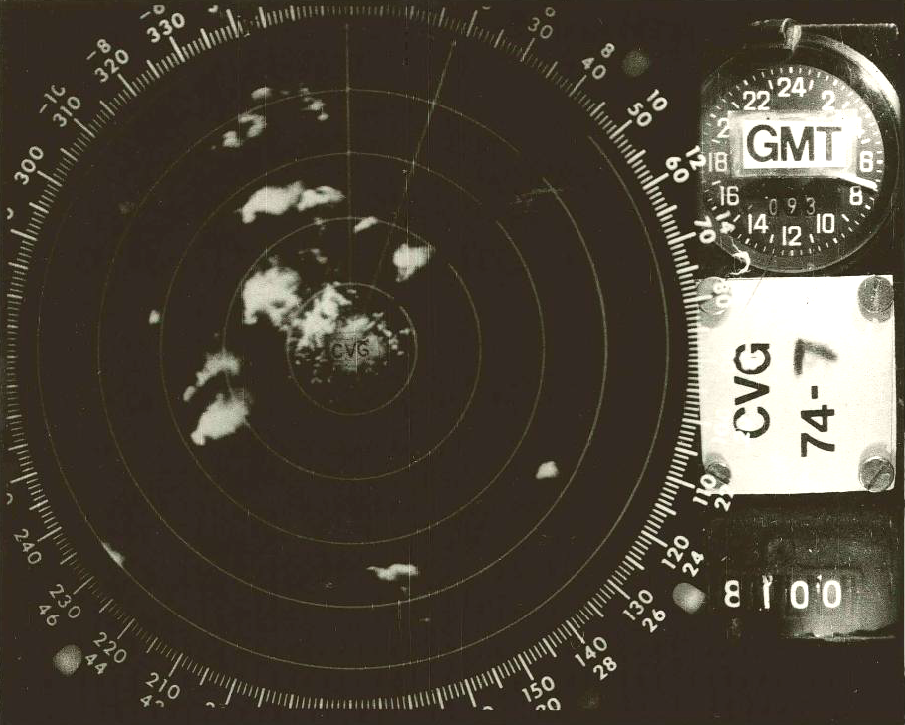
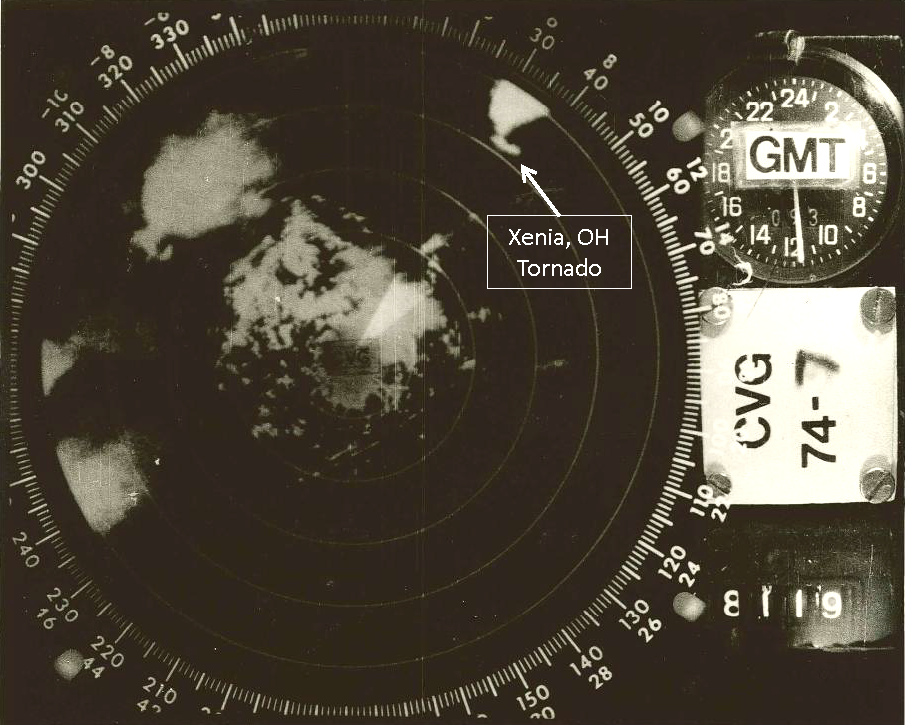
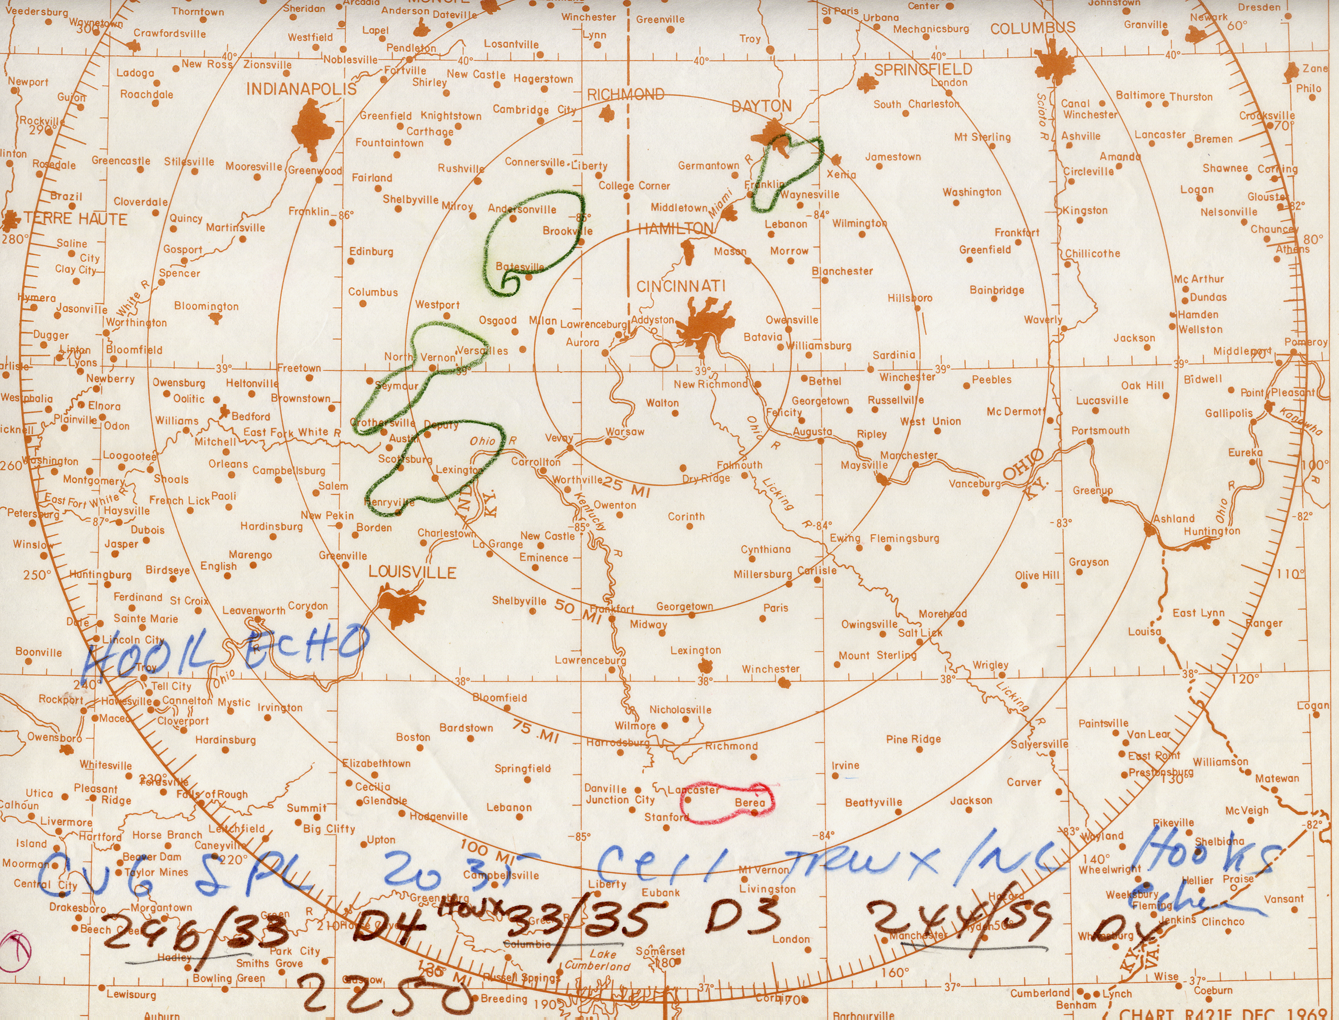
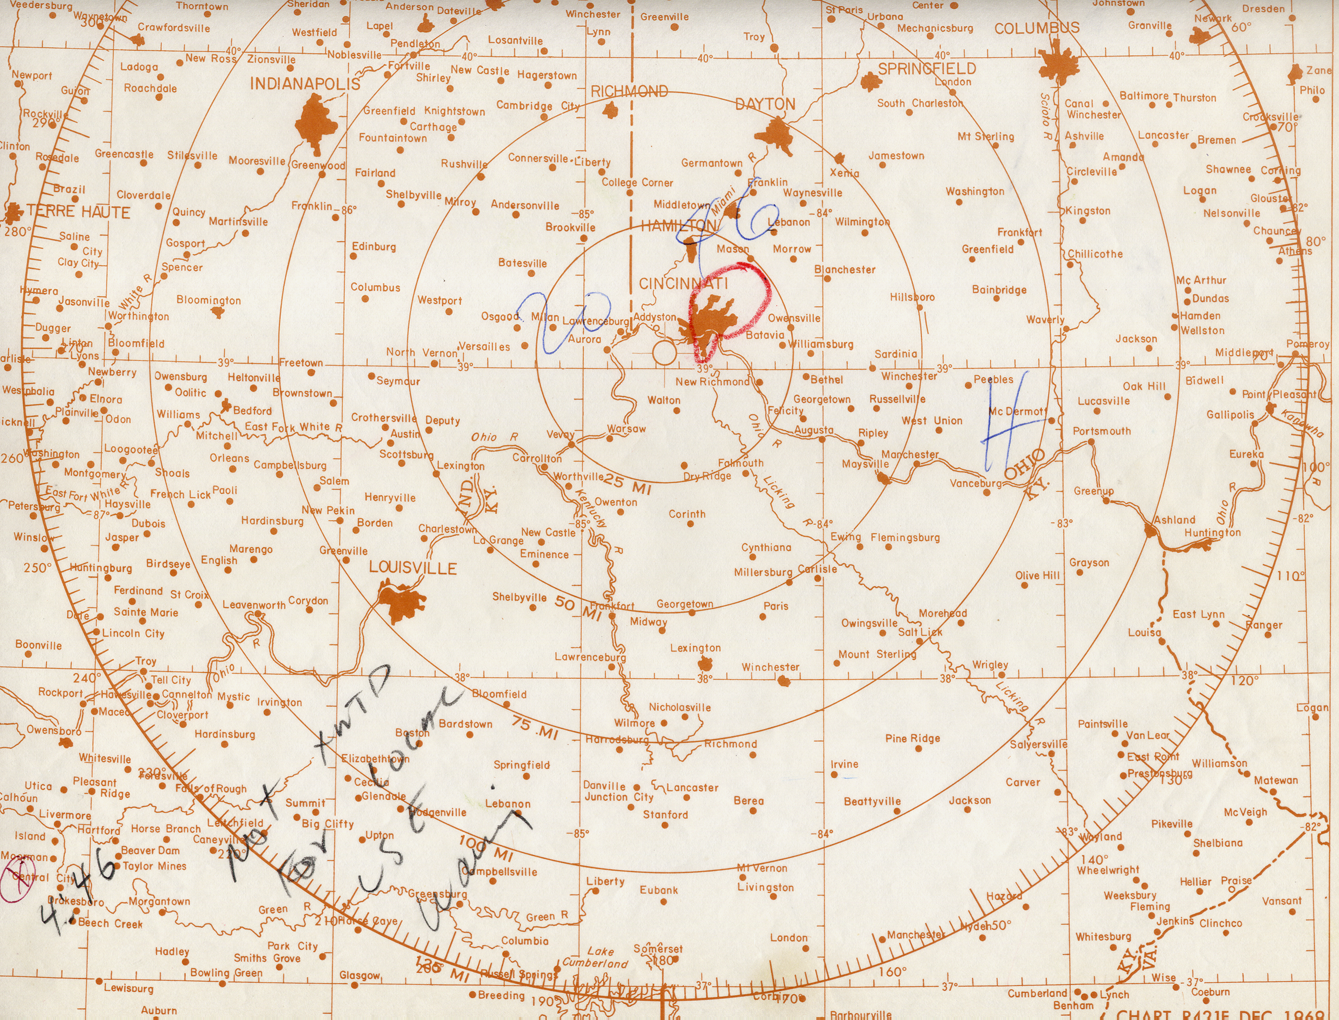
CVG WSR-57 radar shows
Xenia storm (upper right) (courtesy of NCDC) |
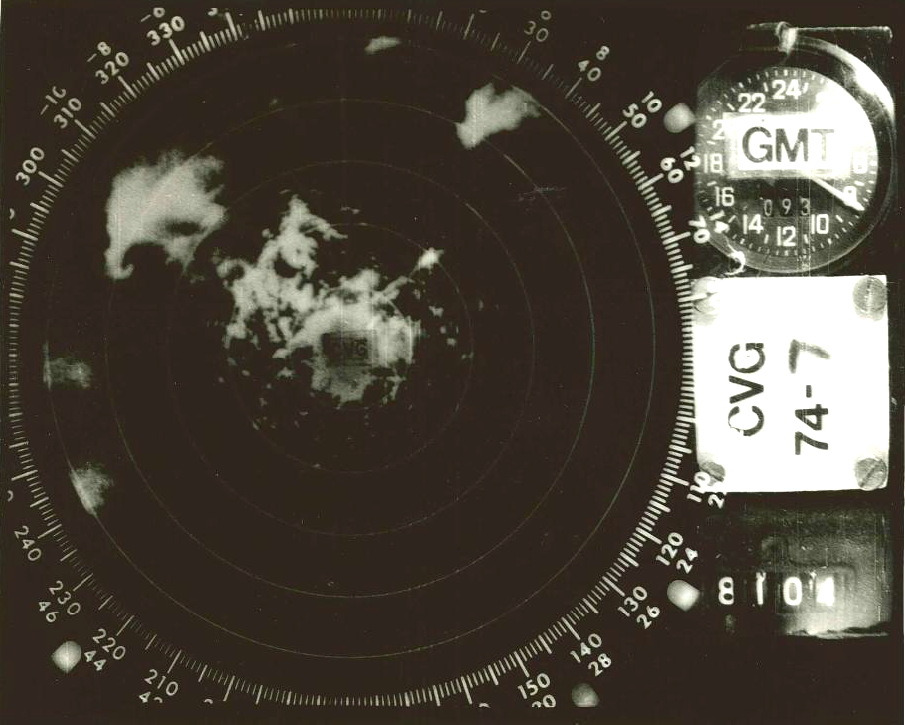
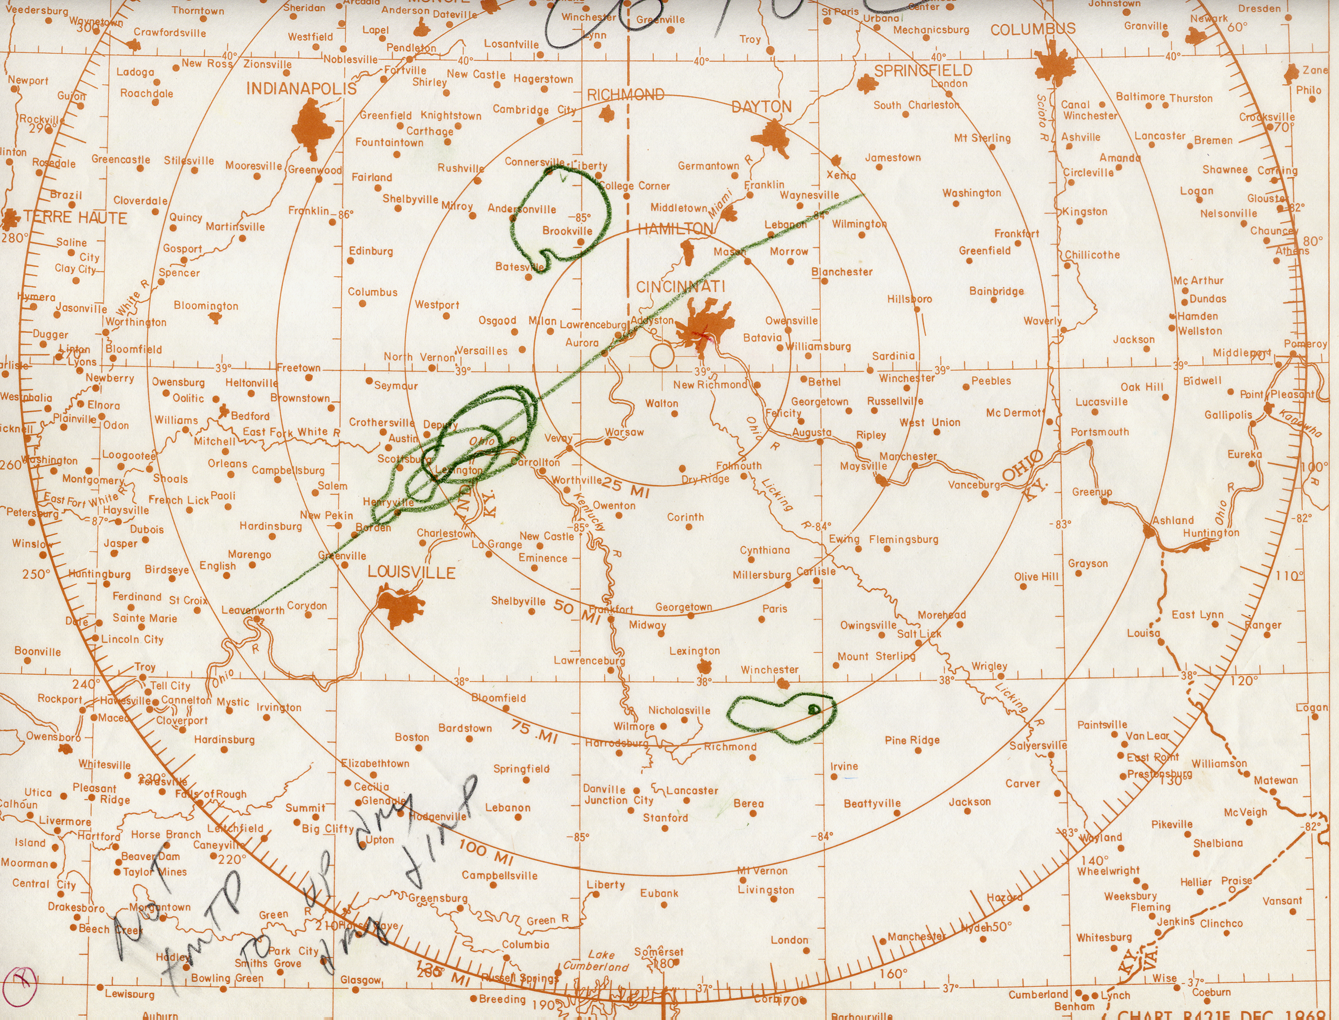
CVG WSR-57 radar shows
Xenia tornado developing (courtesy of NCDC) |
Wright-Patterson AFB radar
collection of images from April 3-4 |
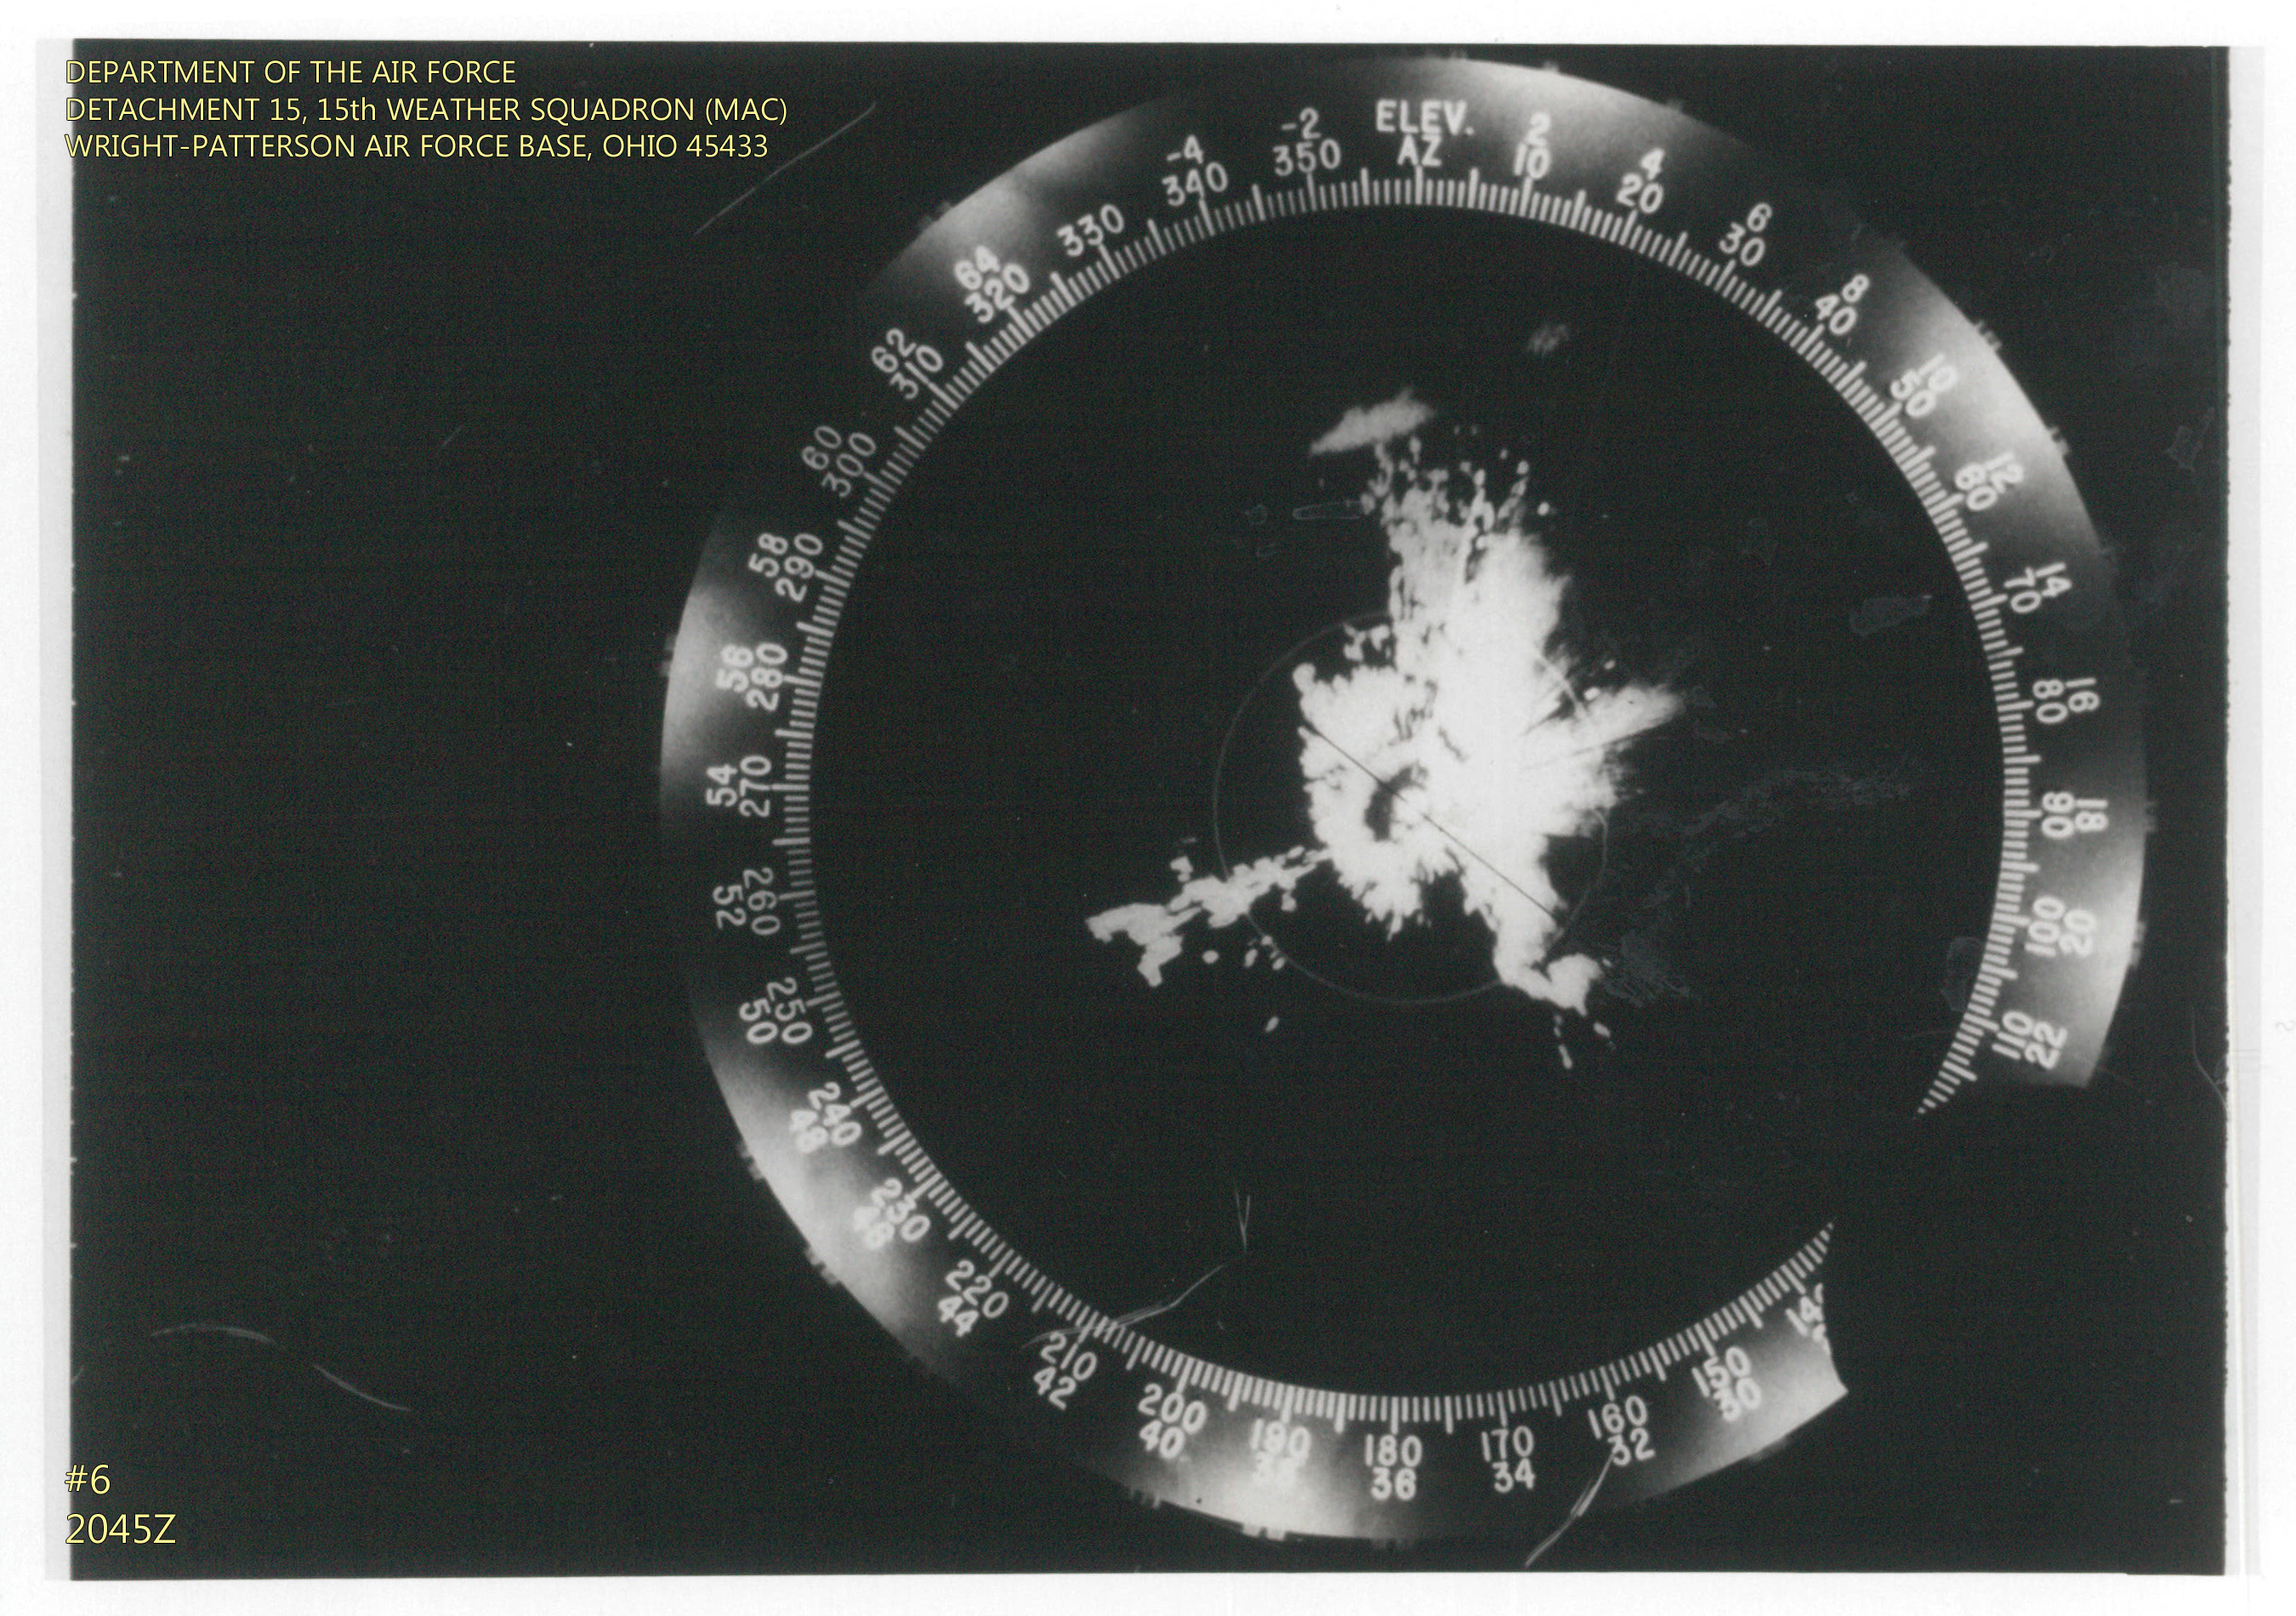
Wright-Patterson AFB radar
depicting the Xenia storm (445 PM) |
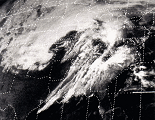
April 3, 1974 visible satellite
loop, courtesy of Corfidi/SPC (click for animation) |
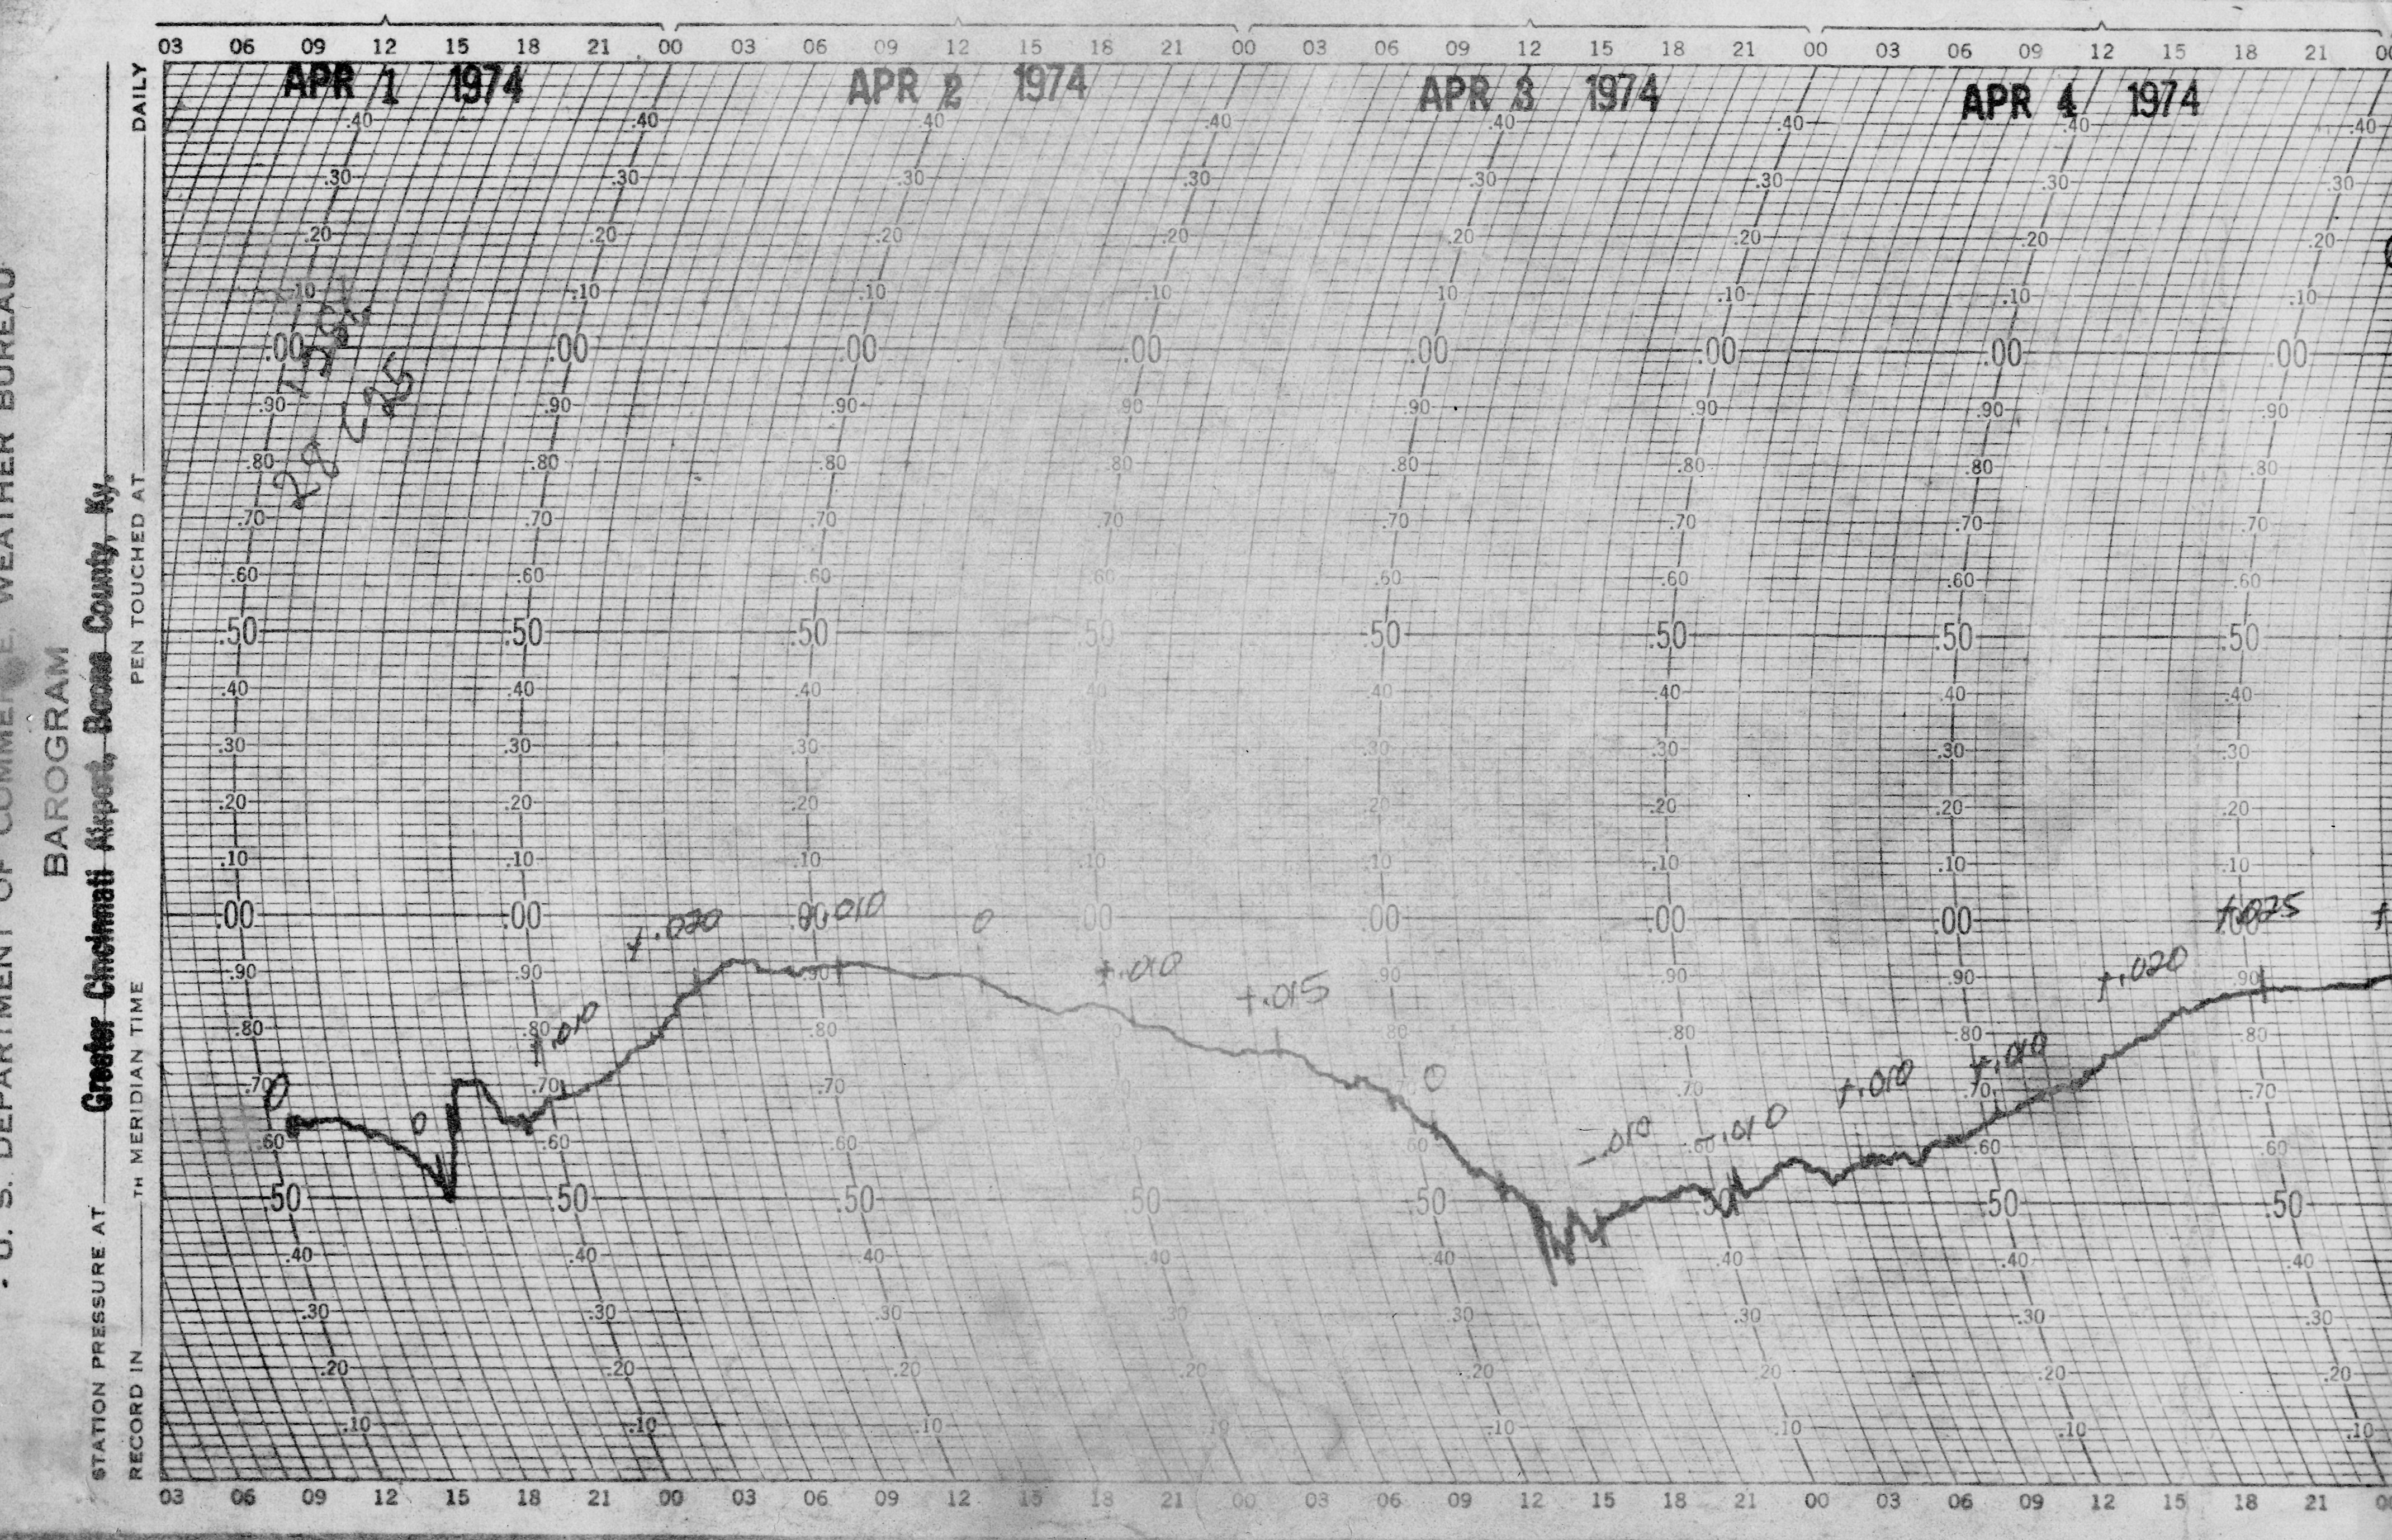
Cincinnati barogram shows
a significant drop in air pressure on April 3, 1974 |
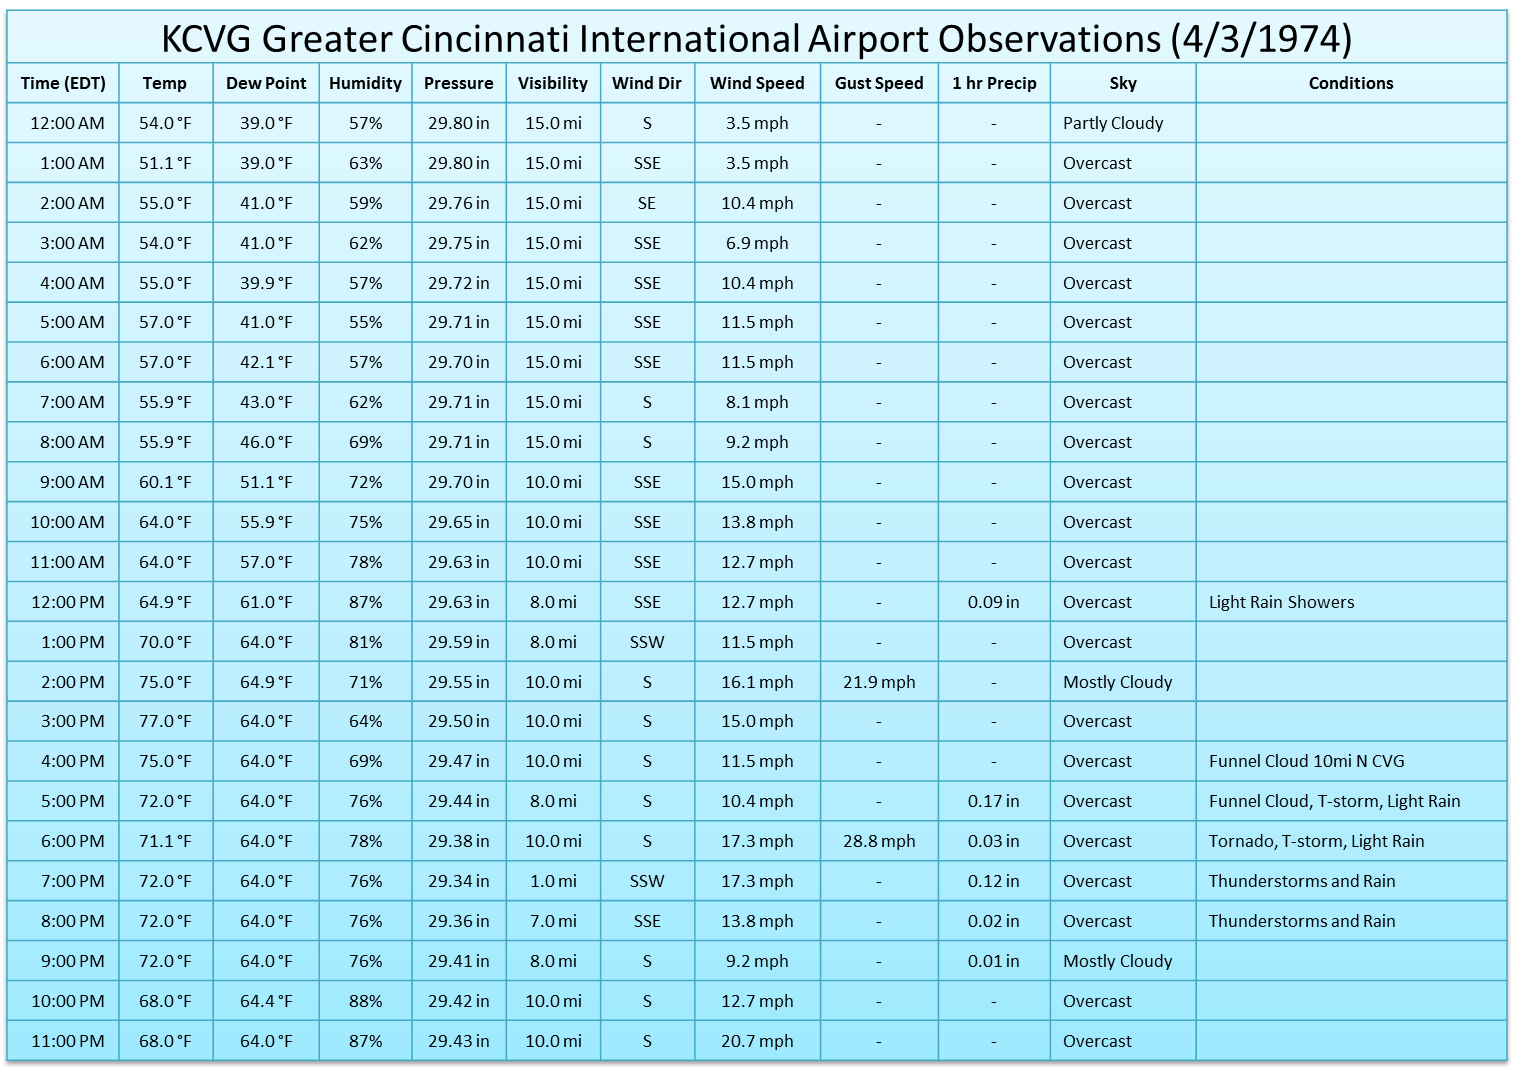
April 3, 1974 weather obs
from the Greater Cincinnati International Airport |
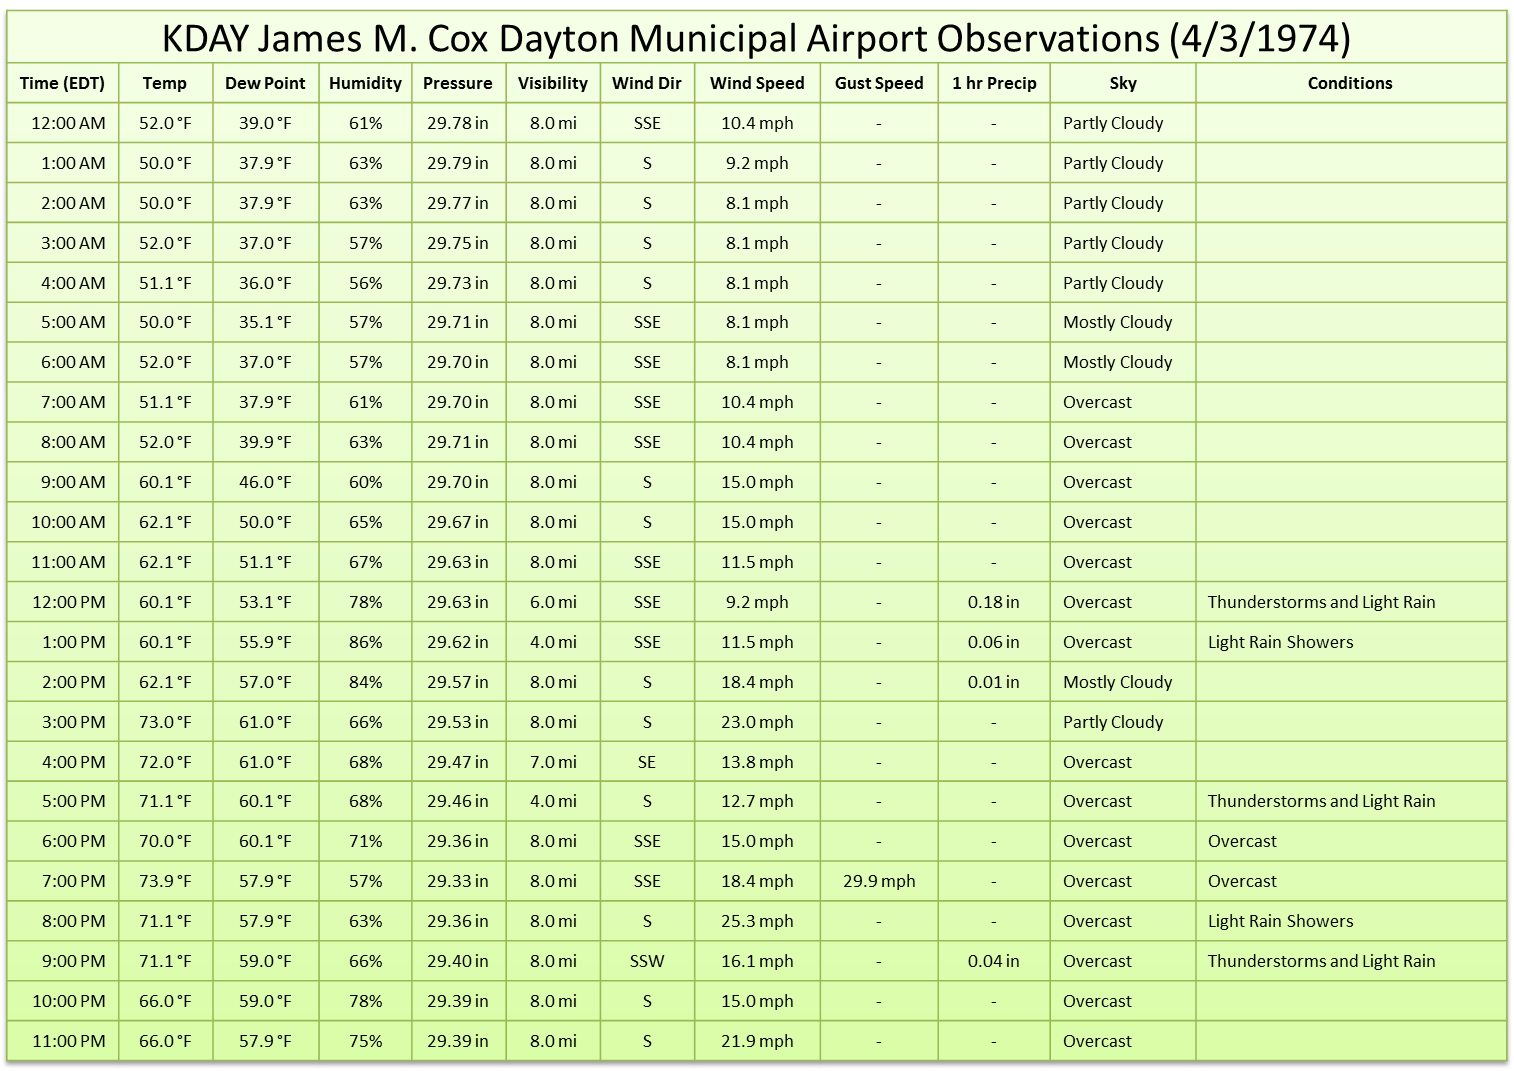
April 3, 1974 weather obs
from the James M. Cox Dayton Municipal Airport |
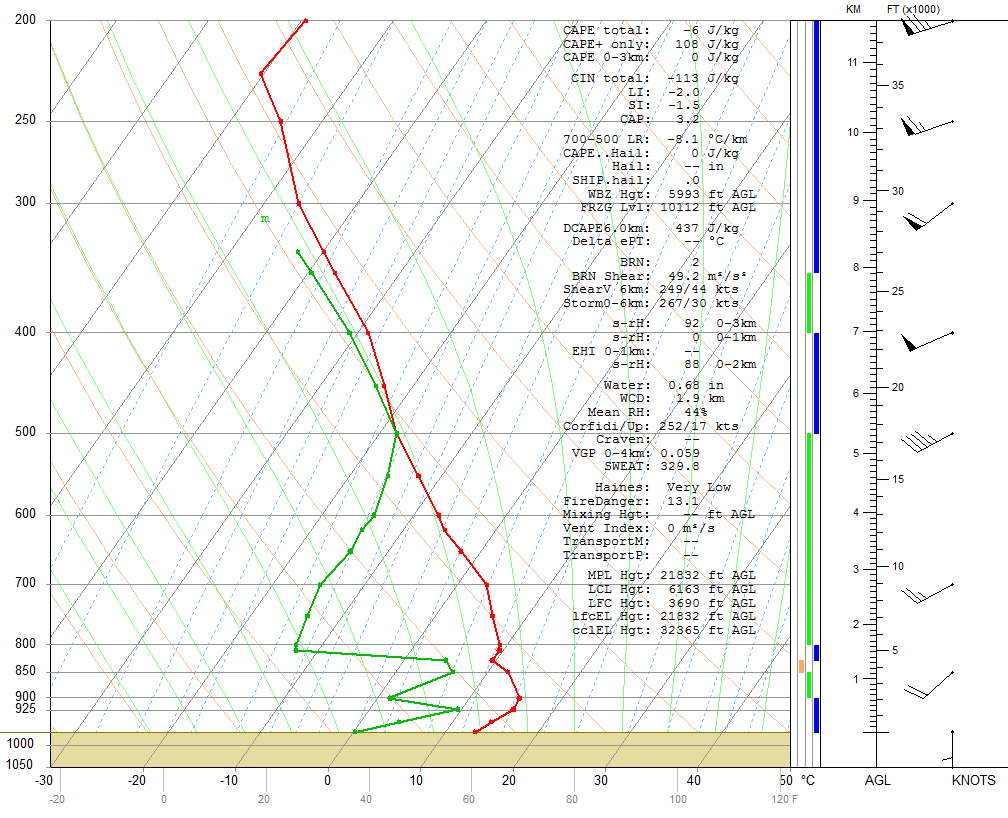
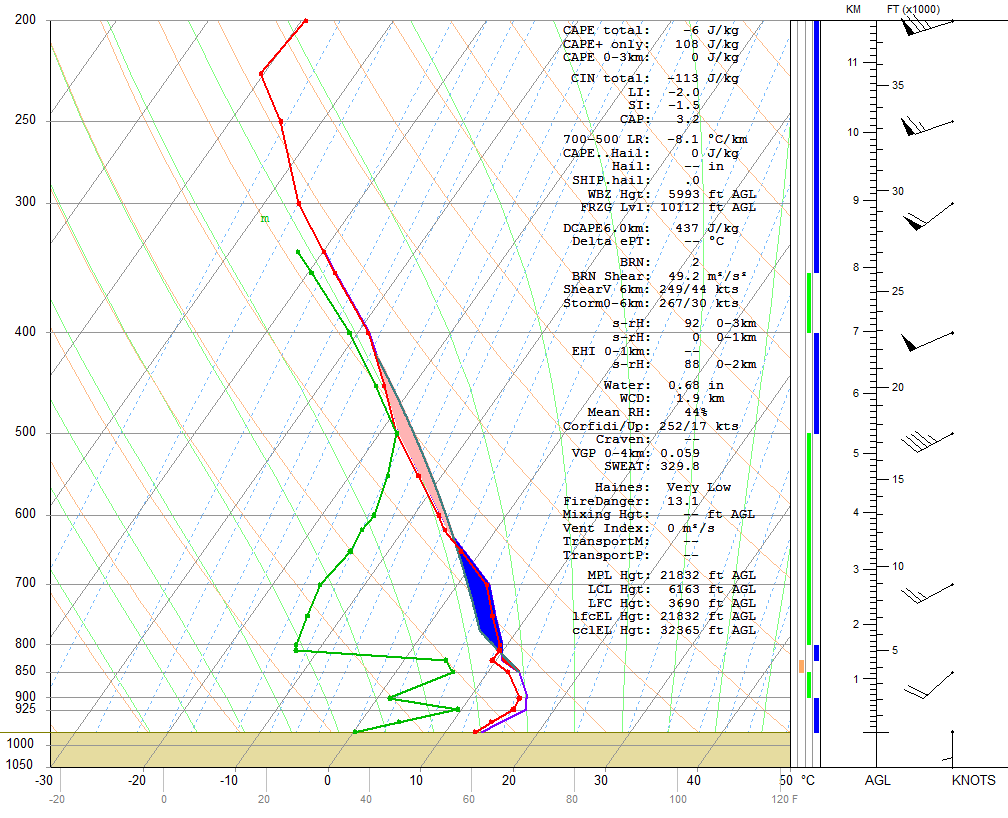
Dayton 12Z April 3 skew-T
(with most unstable CAPE) |
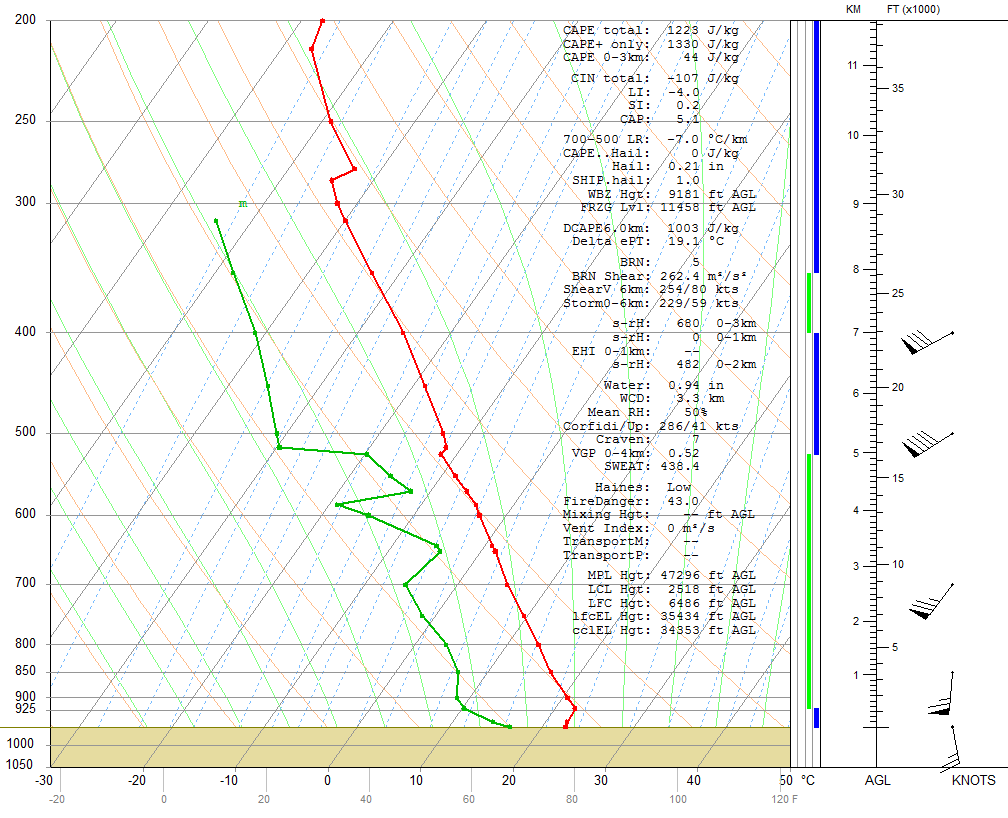
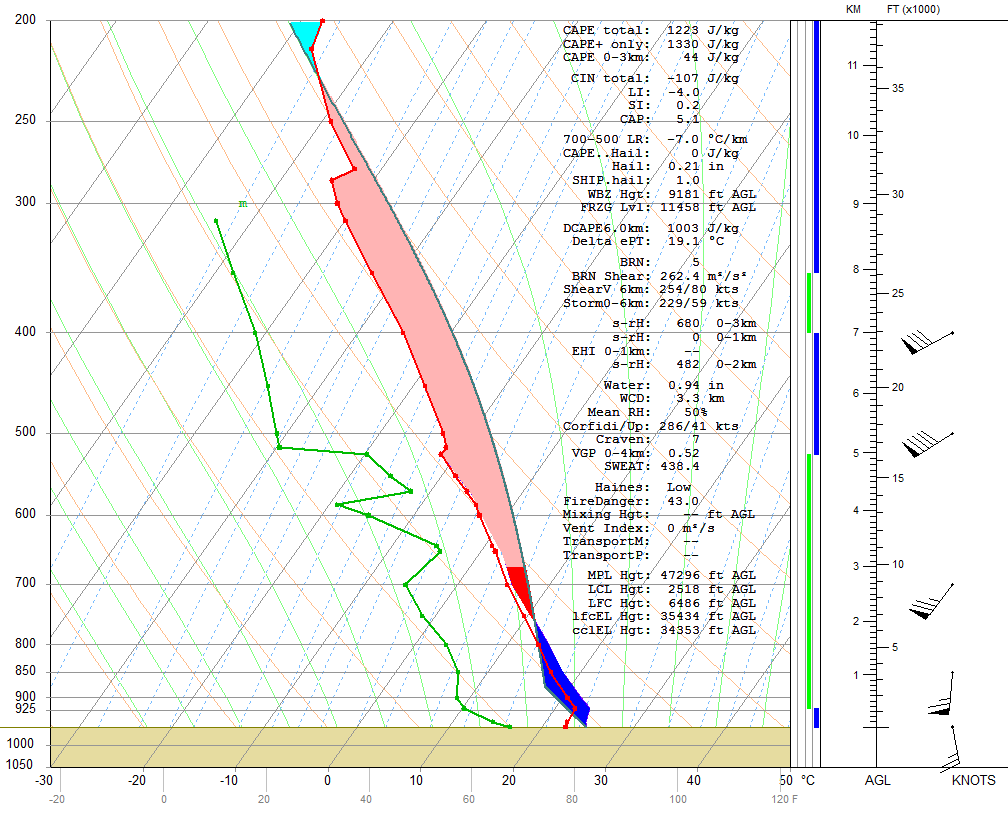
Dayton 00Z April 4 skew-T
(with most unstable CAPE) |
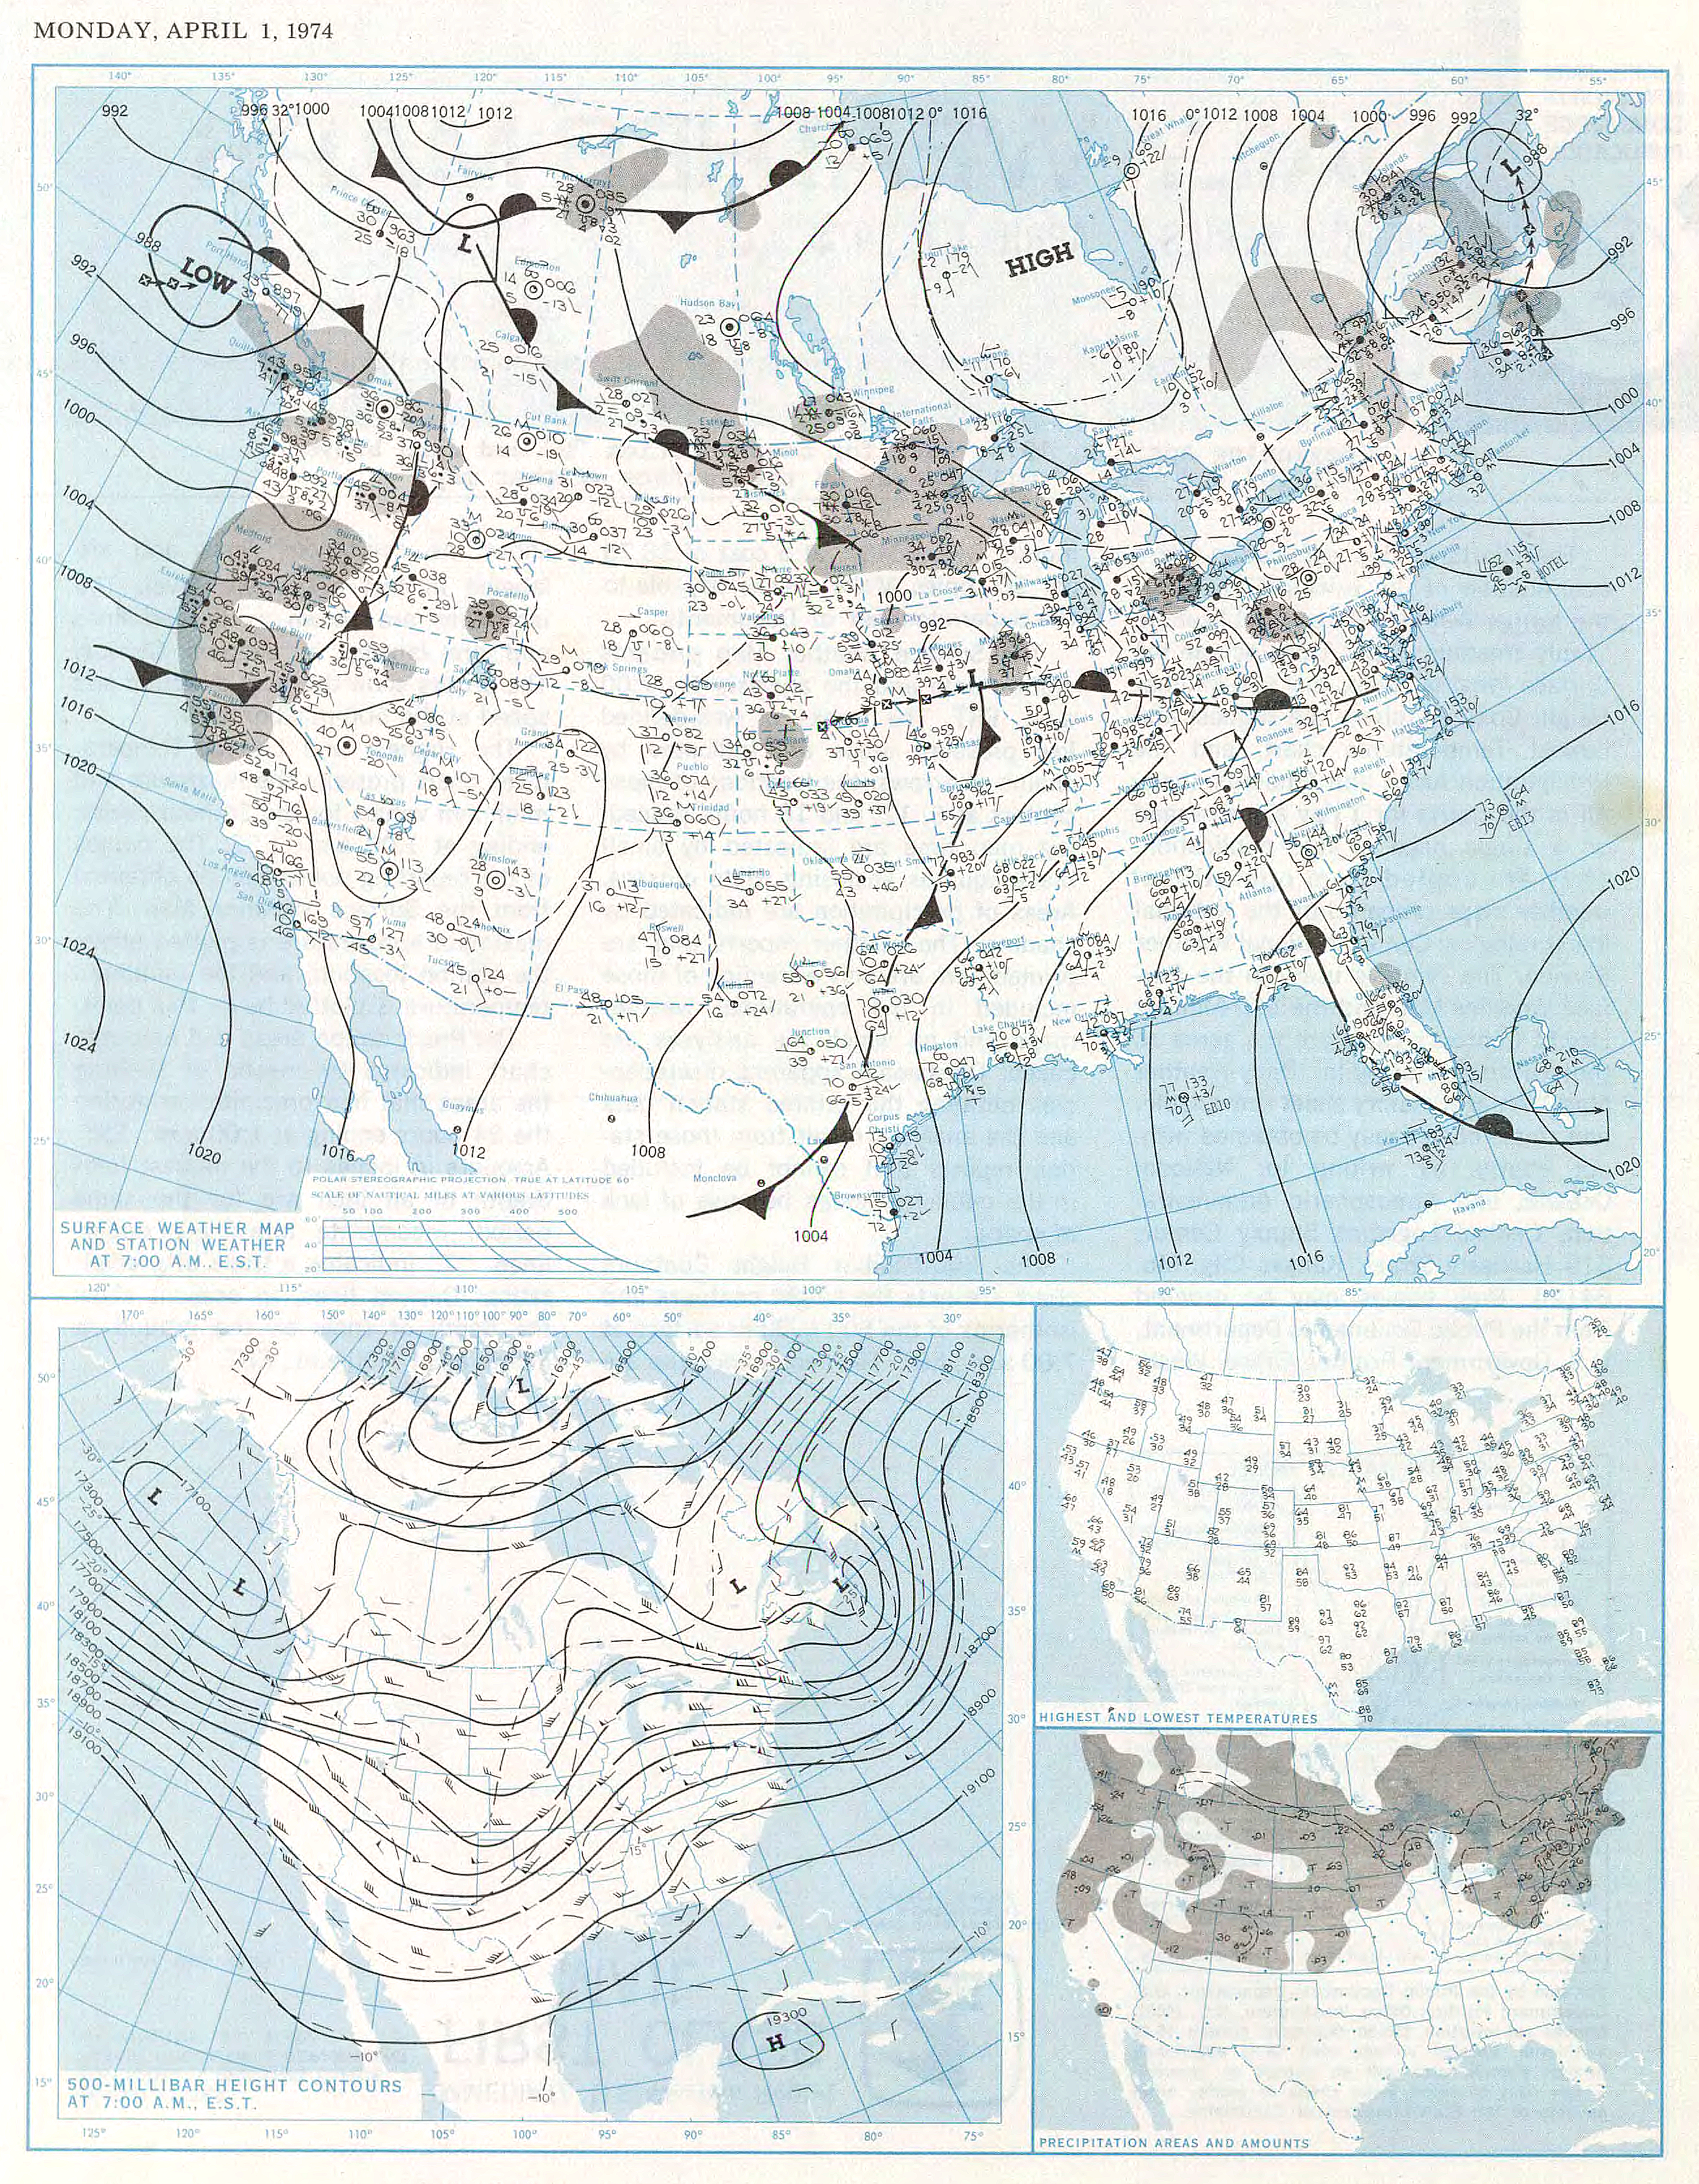
April 1, 1974 weather maps
|
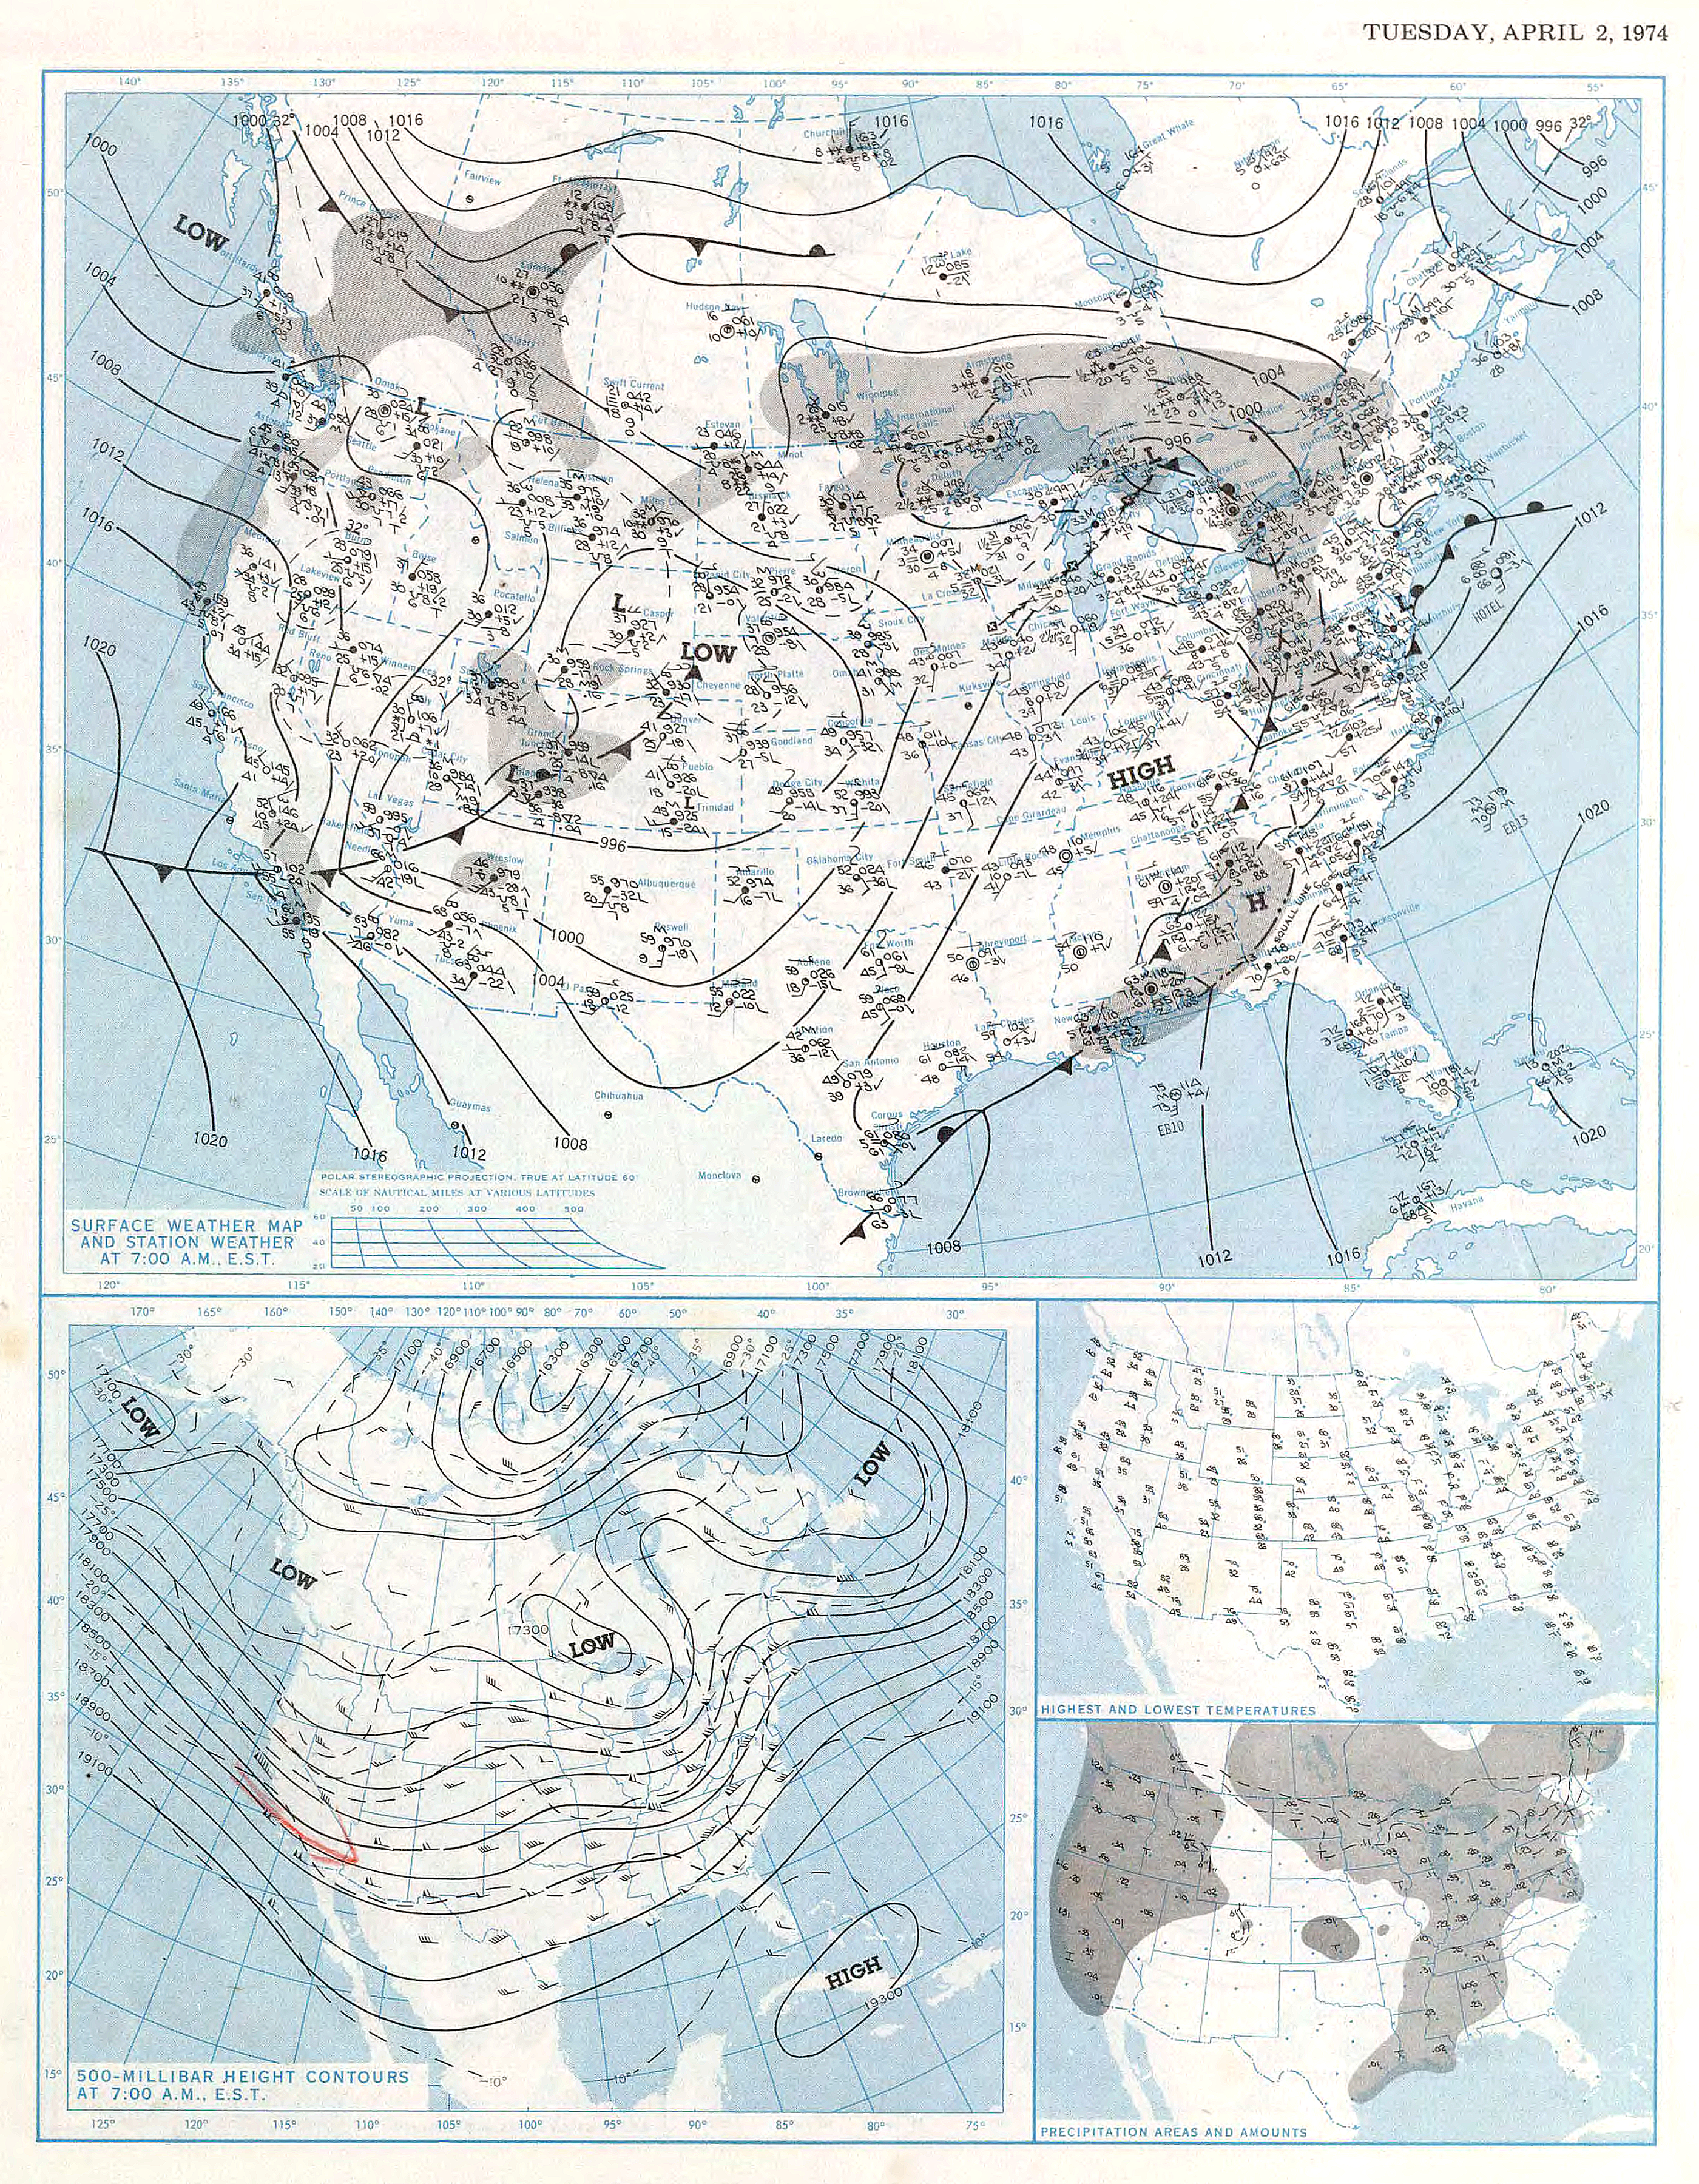
April 2, 1974 weather maps
|
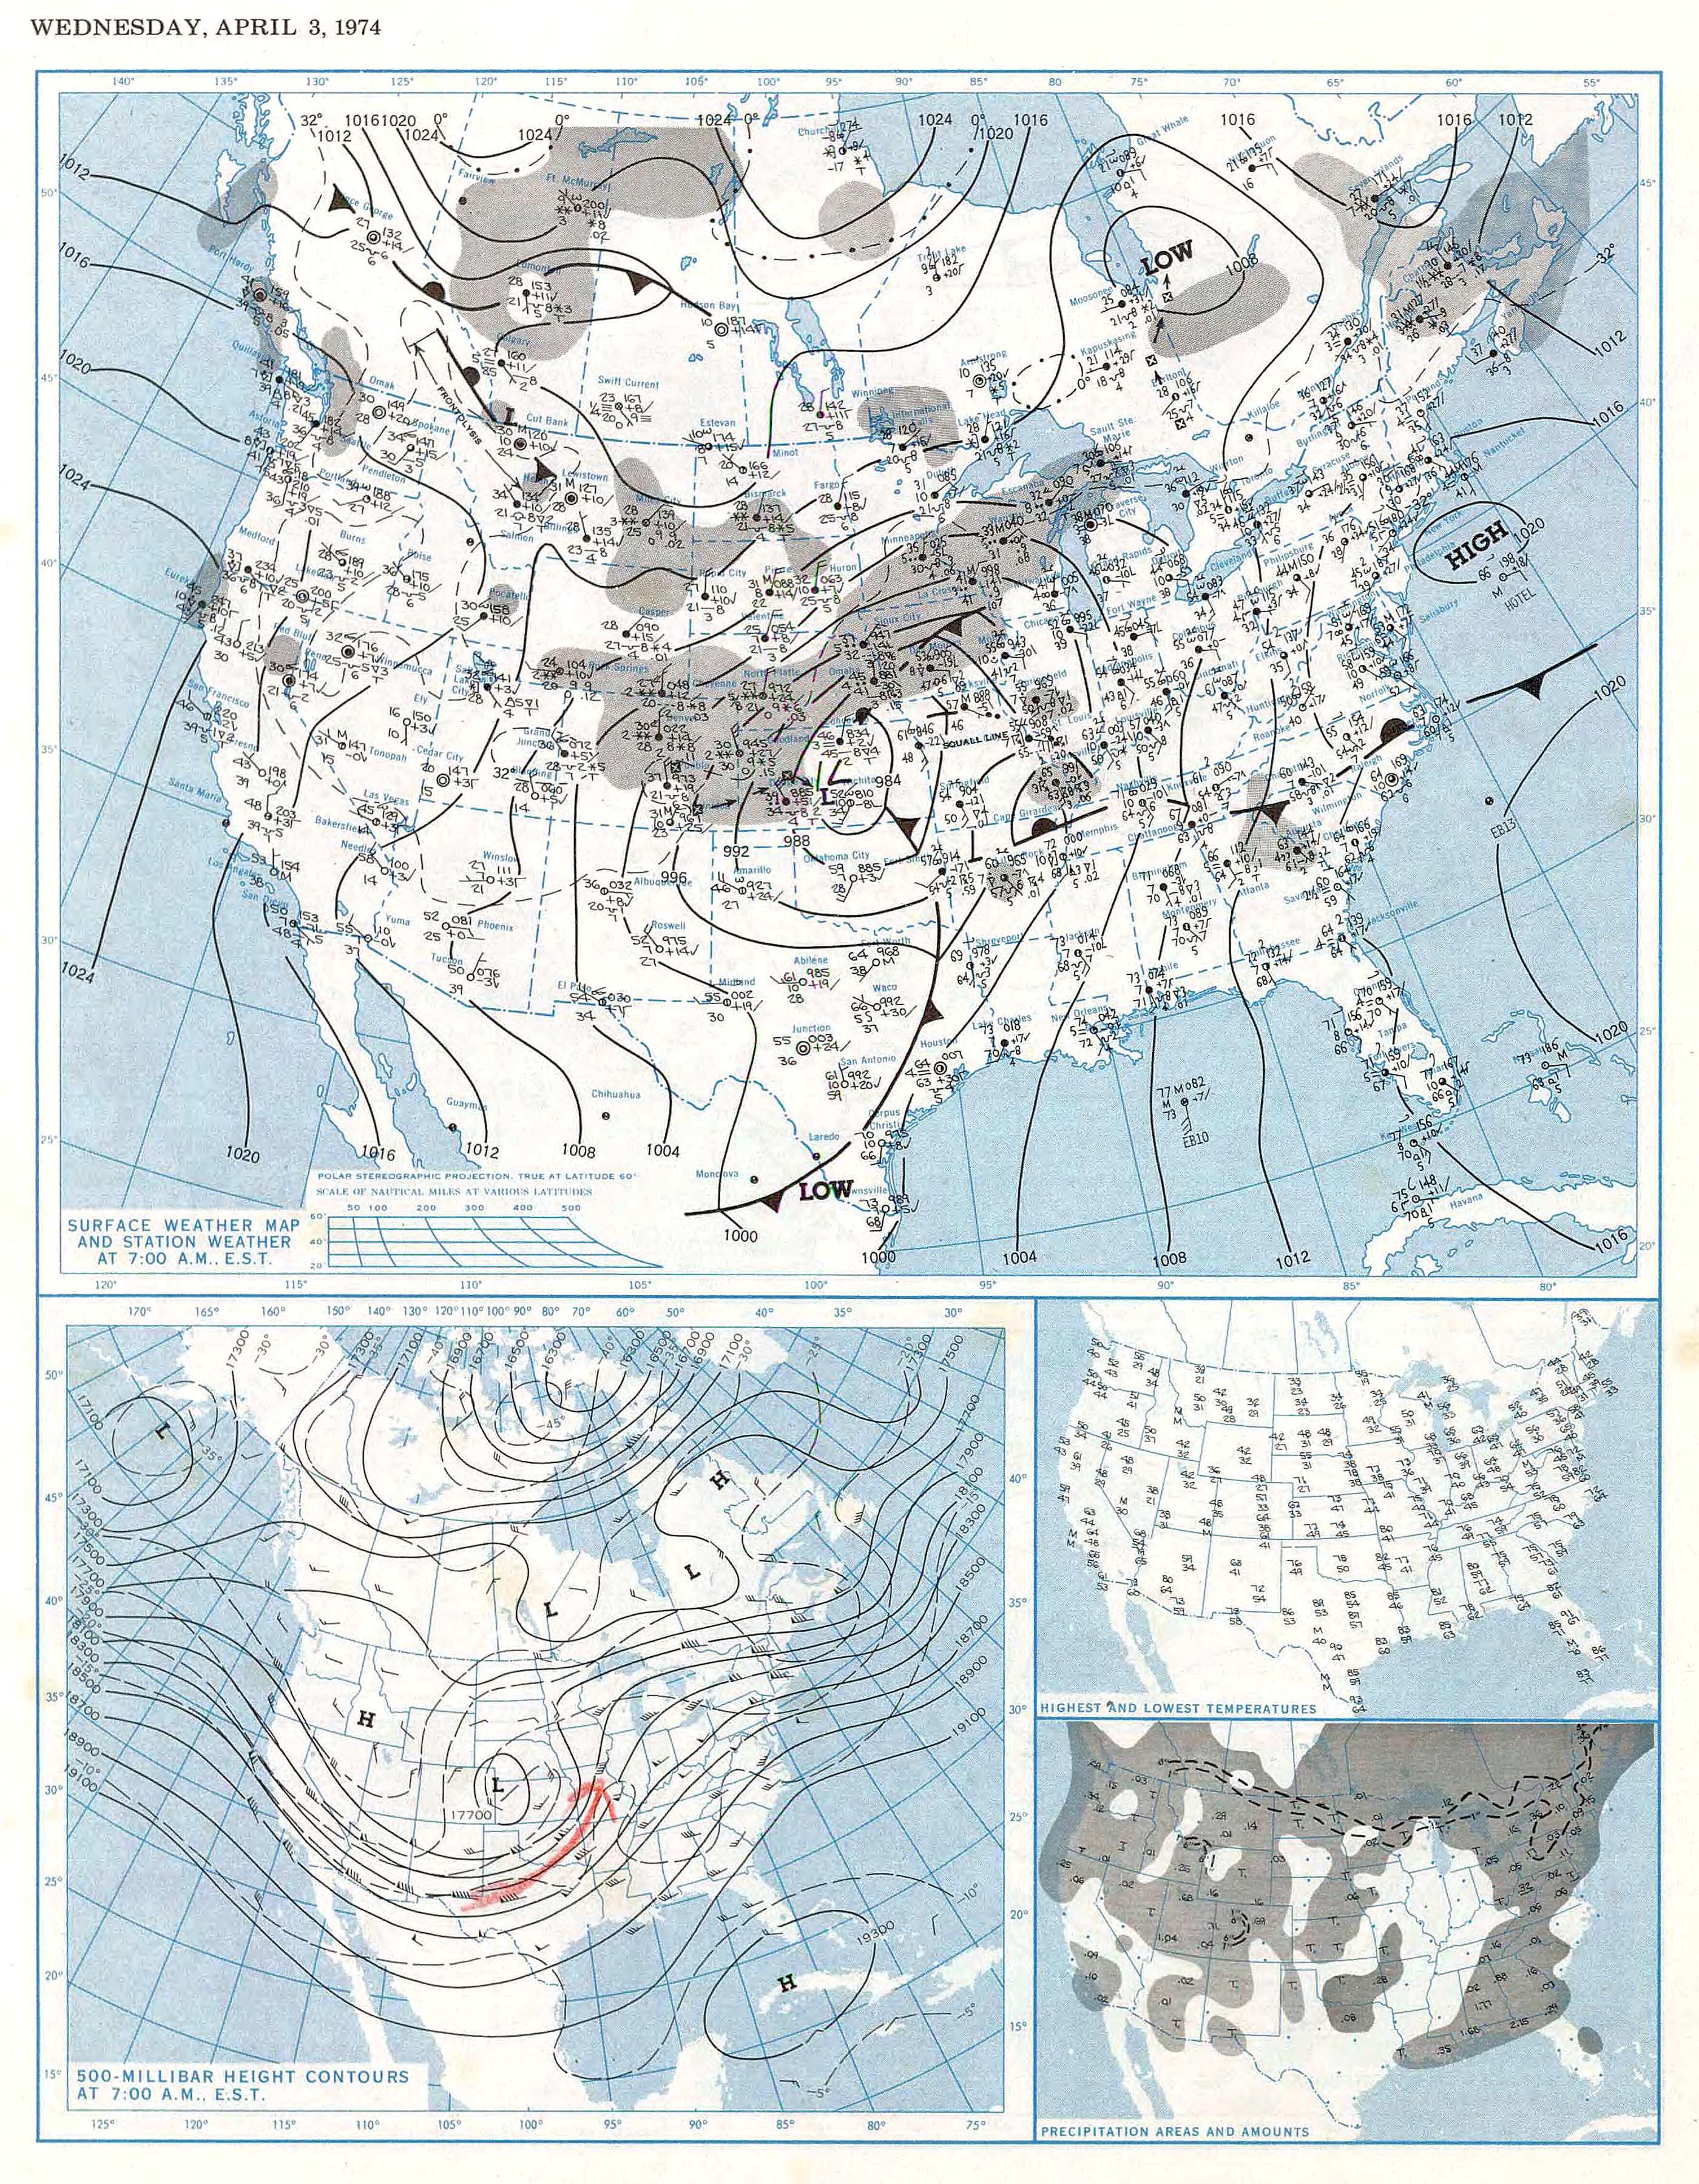
April 3, 1974 weather maps
|

April 4, 1974 weather maps
|
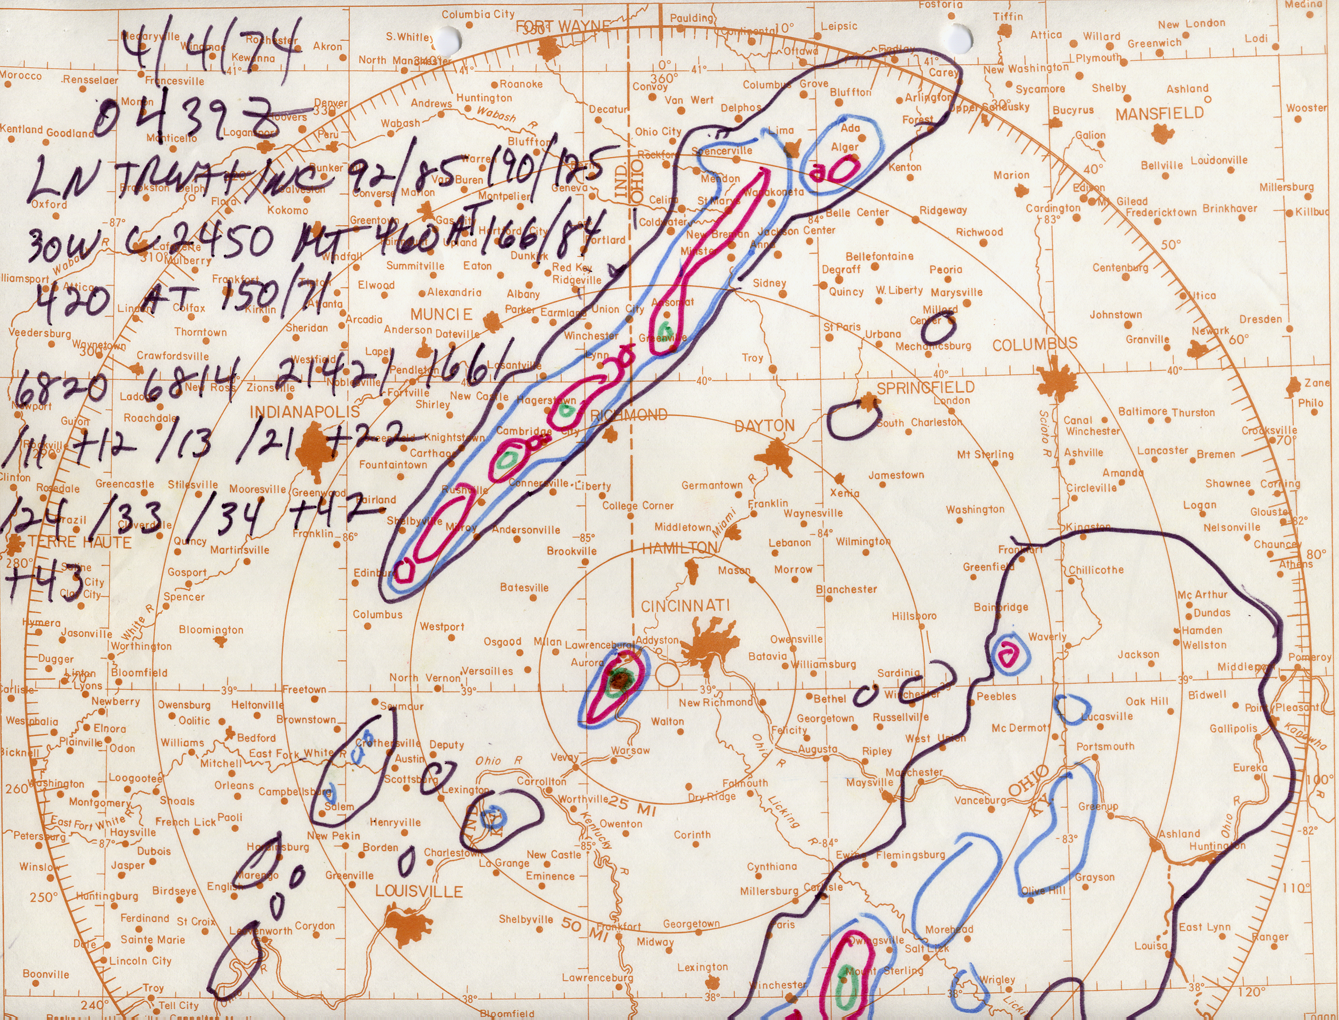
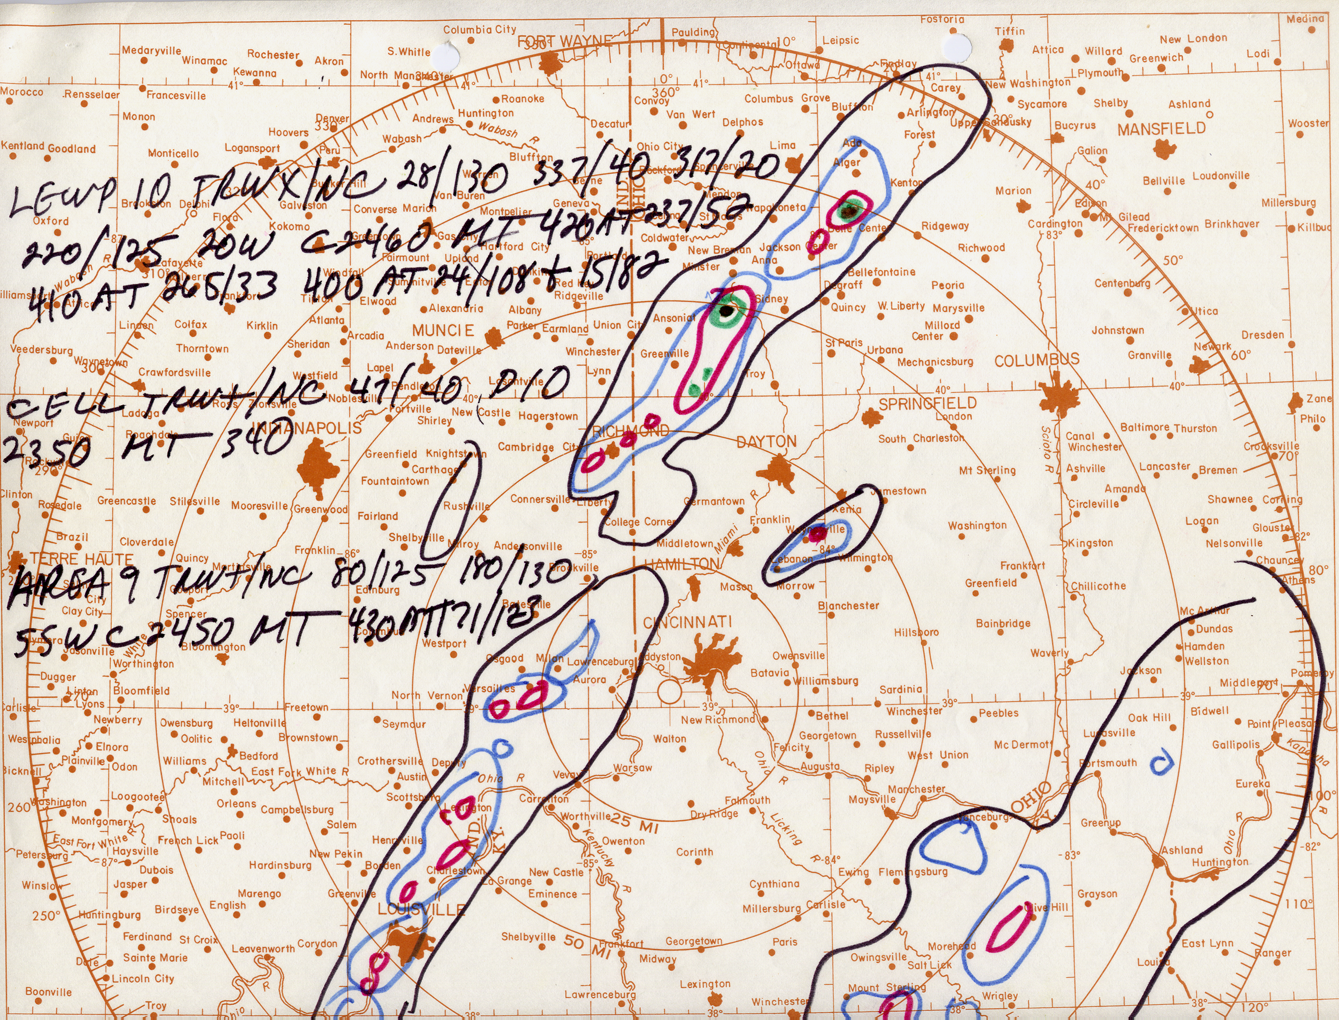
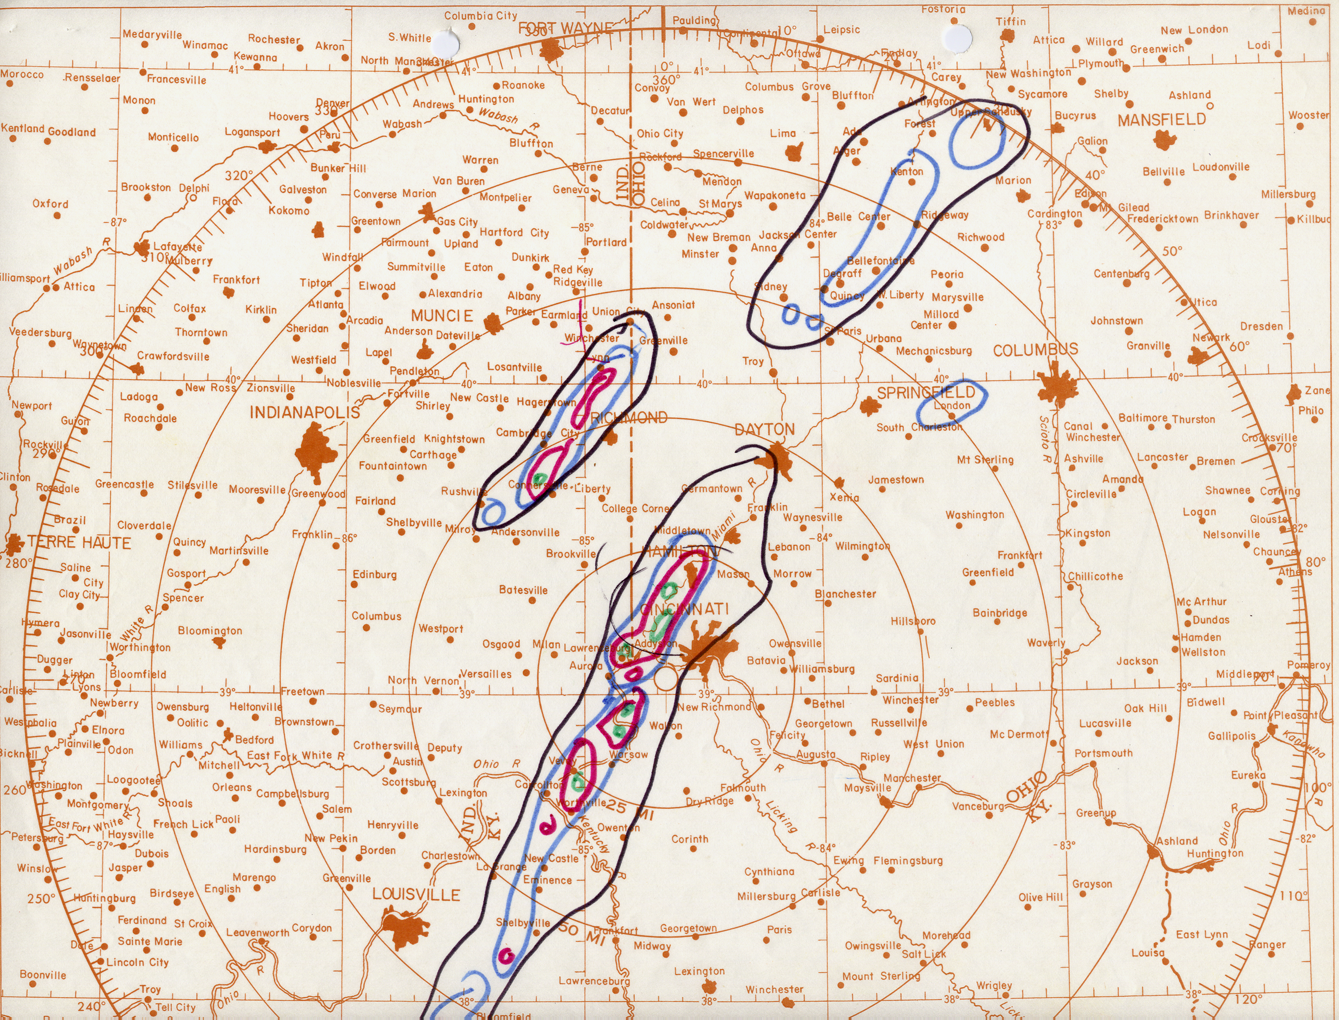
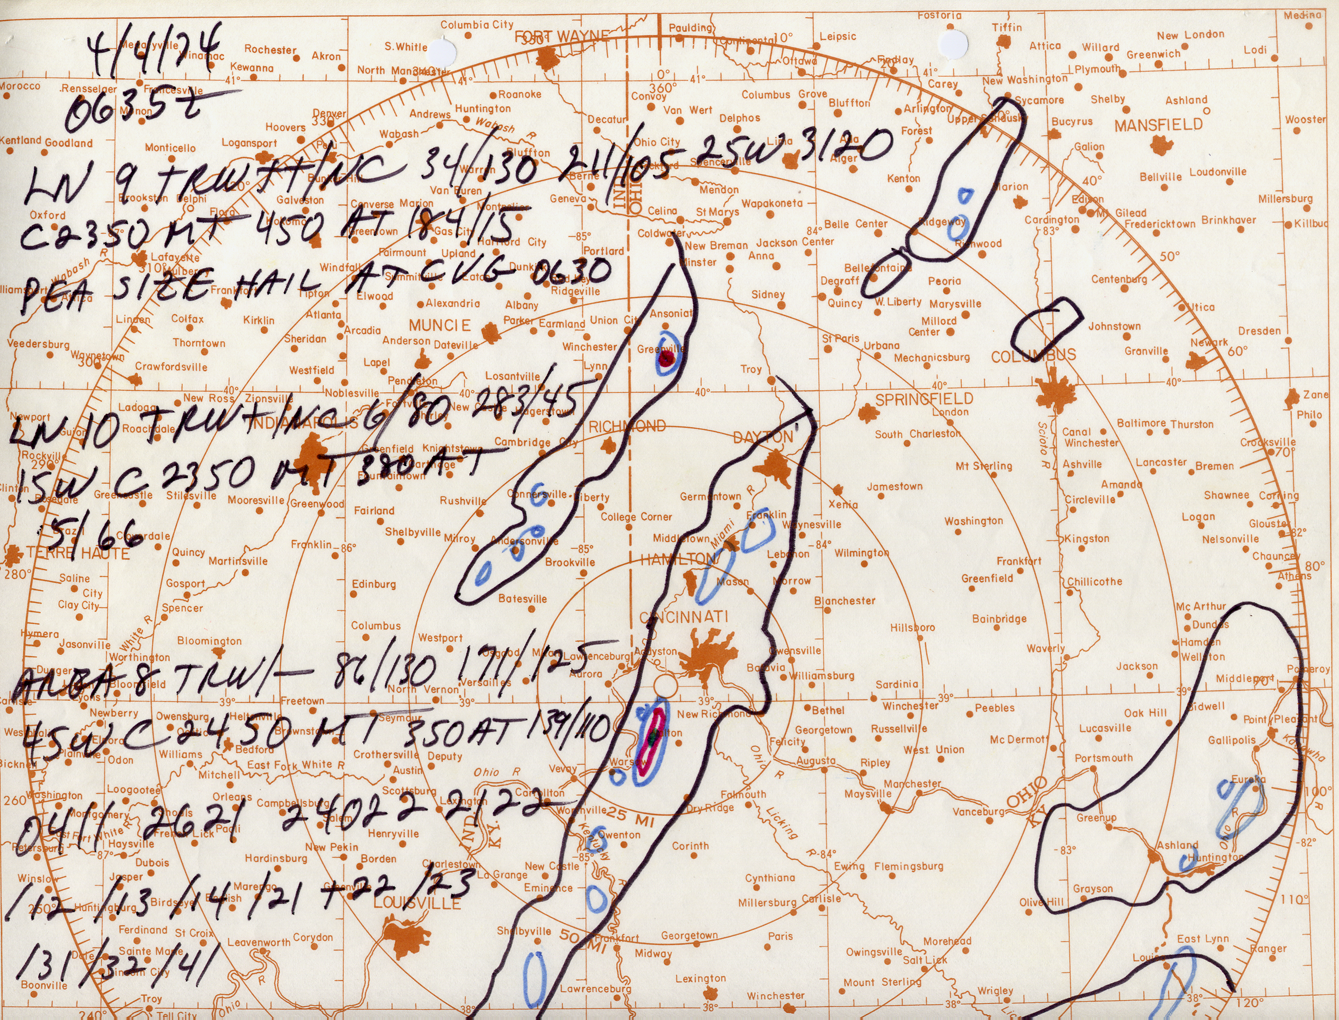
Below are CVG WSR-57 radar observation overlays from the Super Outbreak. The radar operator would place these thin paper maps over the radar scope and trace an outline around the echoes. It is unclear exactly what methodology was used to create these particular overlays, as one would imagine things were extremely hectic in the Cincinnati NWS office that afternoon, and these overlays were probably drawn as quickly as possible. Thus, some of the information is incomplete and at first glance some of the UTC times may appear to be inconsistent with the location and movement of the echoes. It is uncertain if the varying color outlines may perhaps indicate different intensity levels within the echoes.
 |
 |
 |
|
 |
 |
 |
|
 |
 |
 |
 |
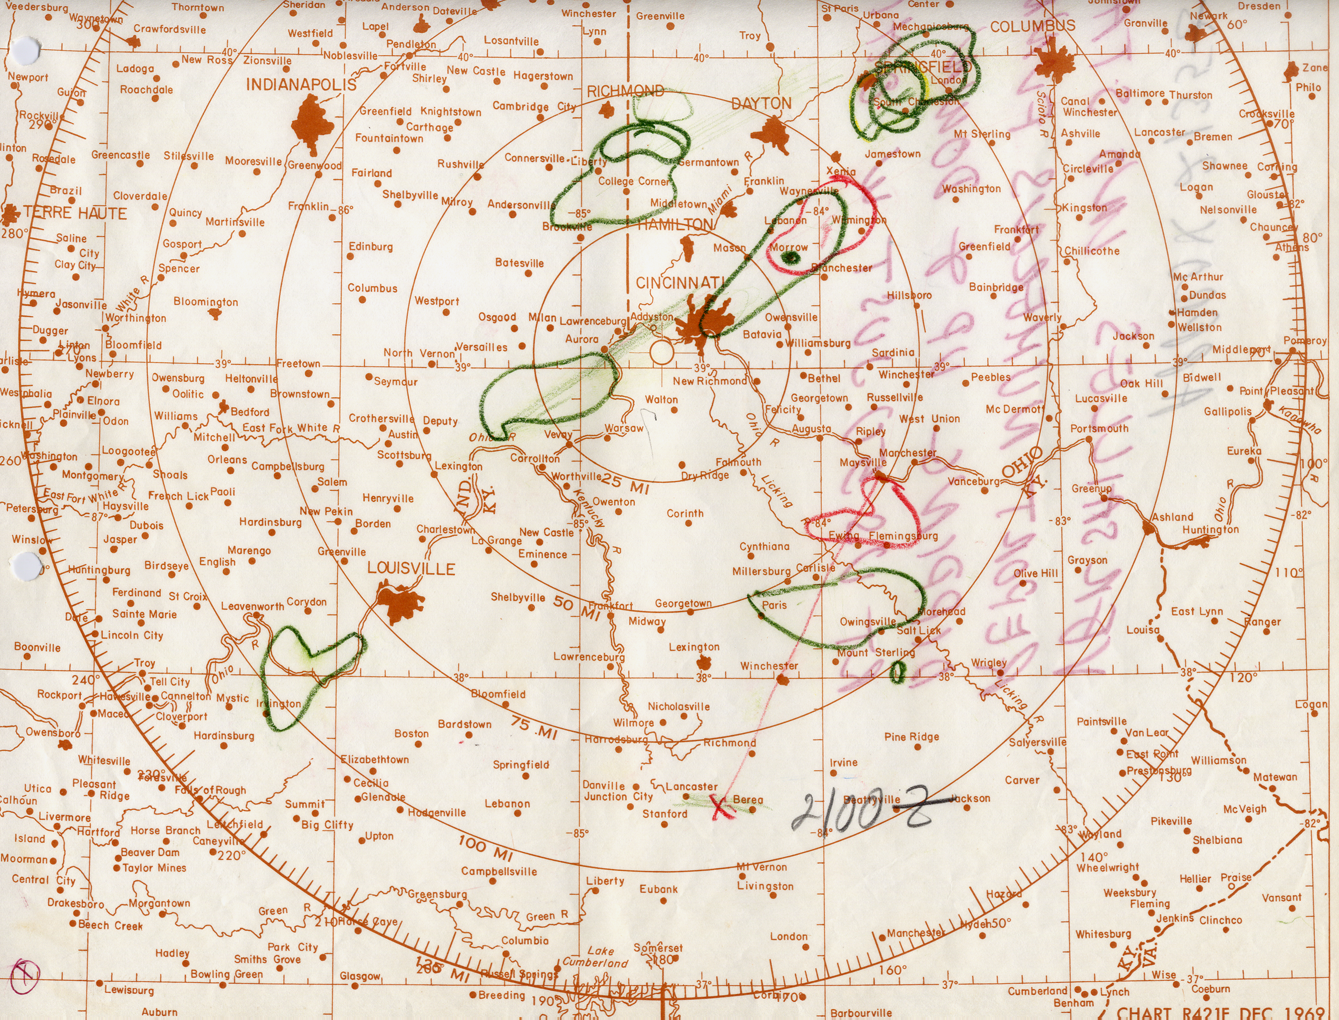
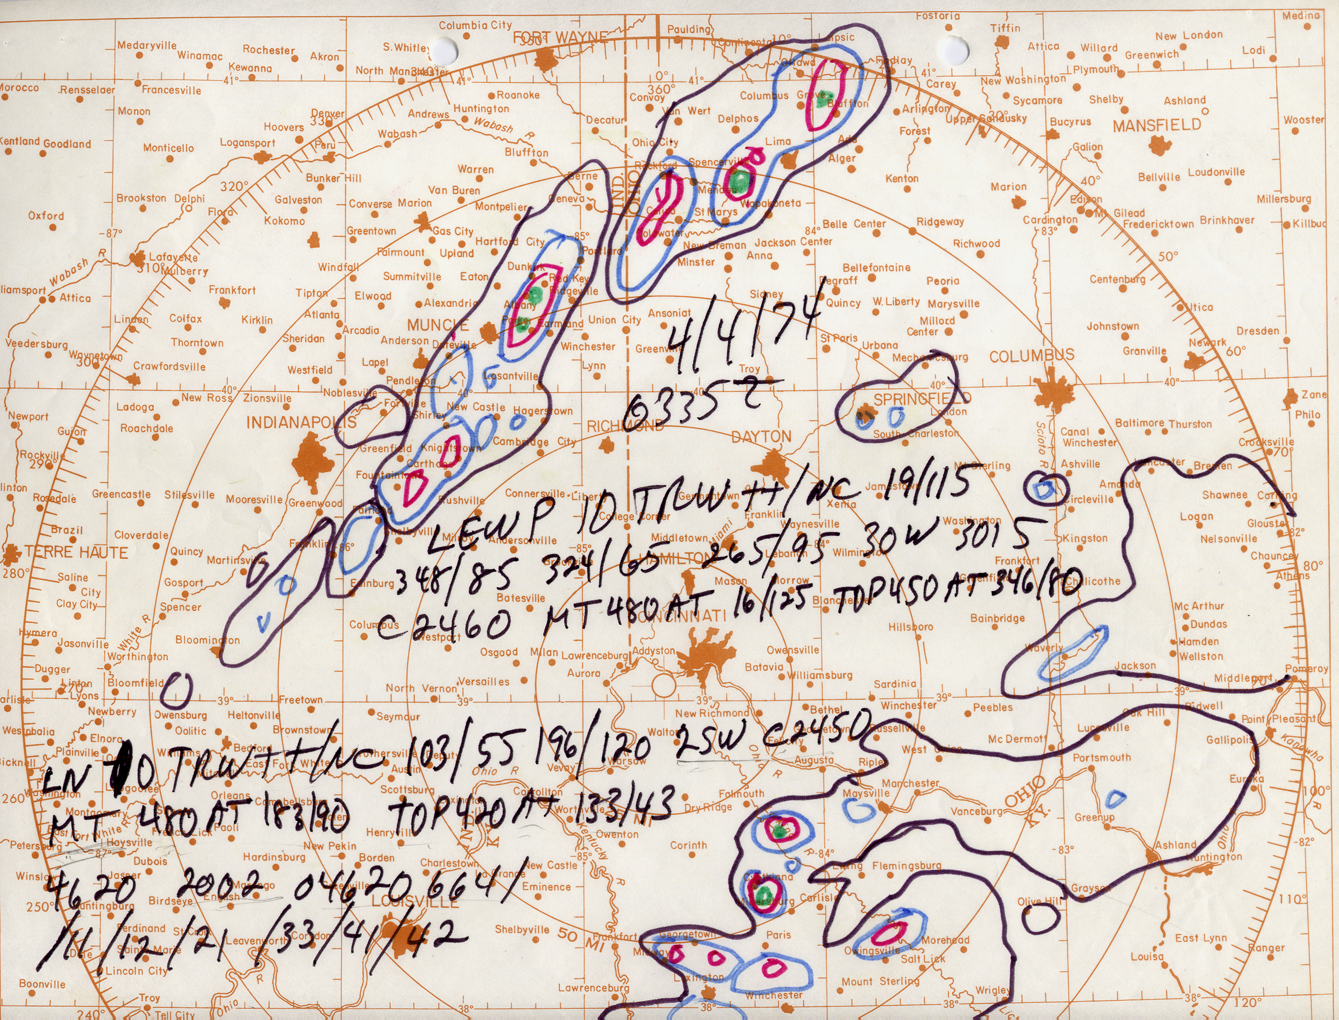
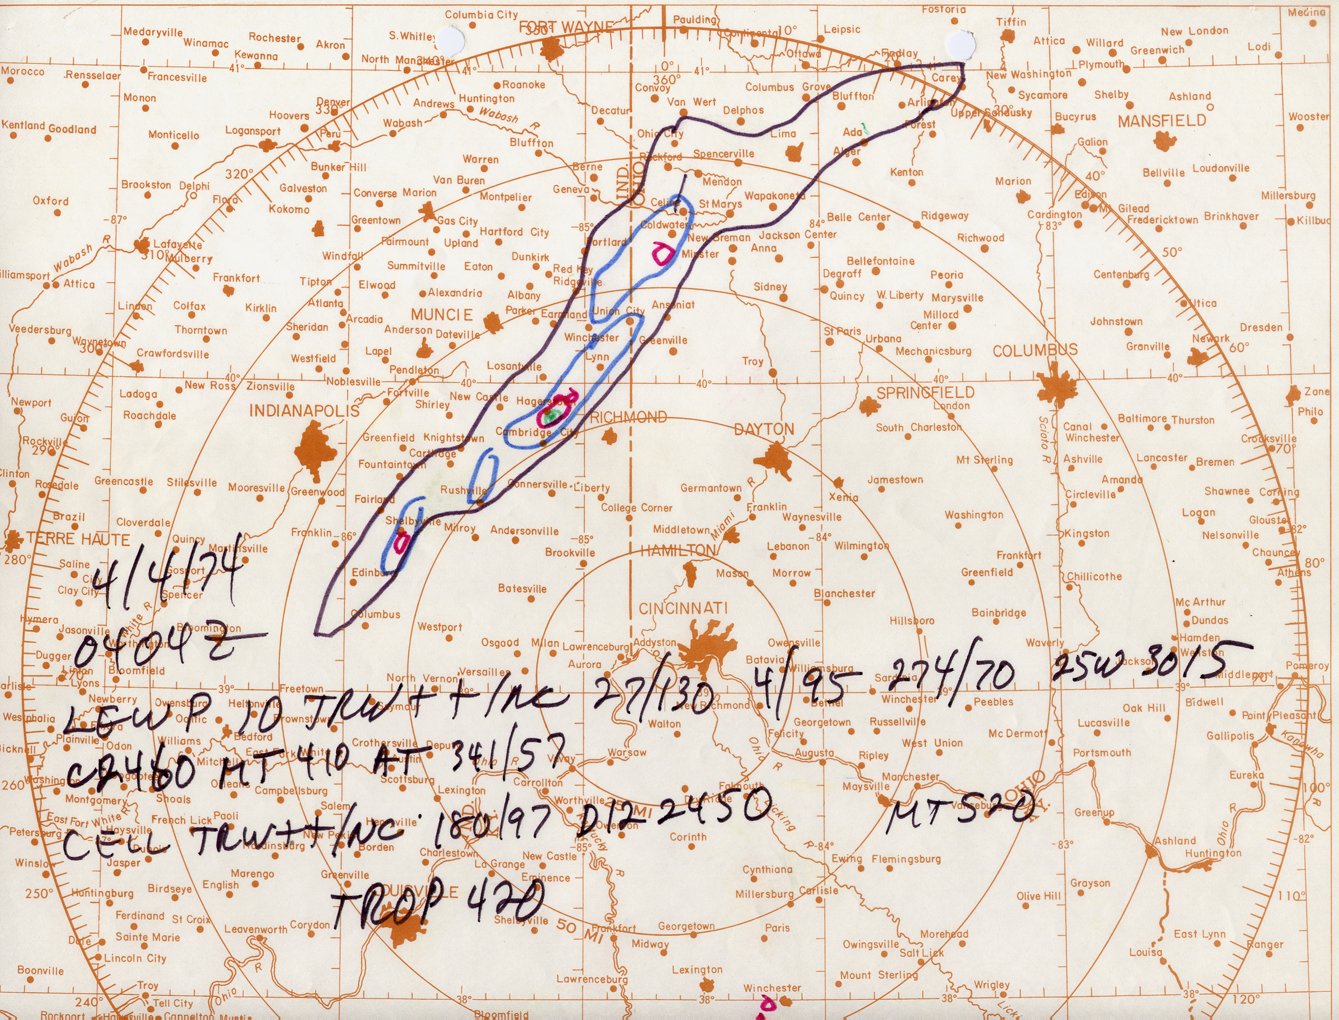
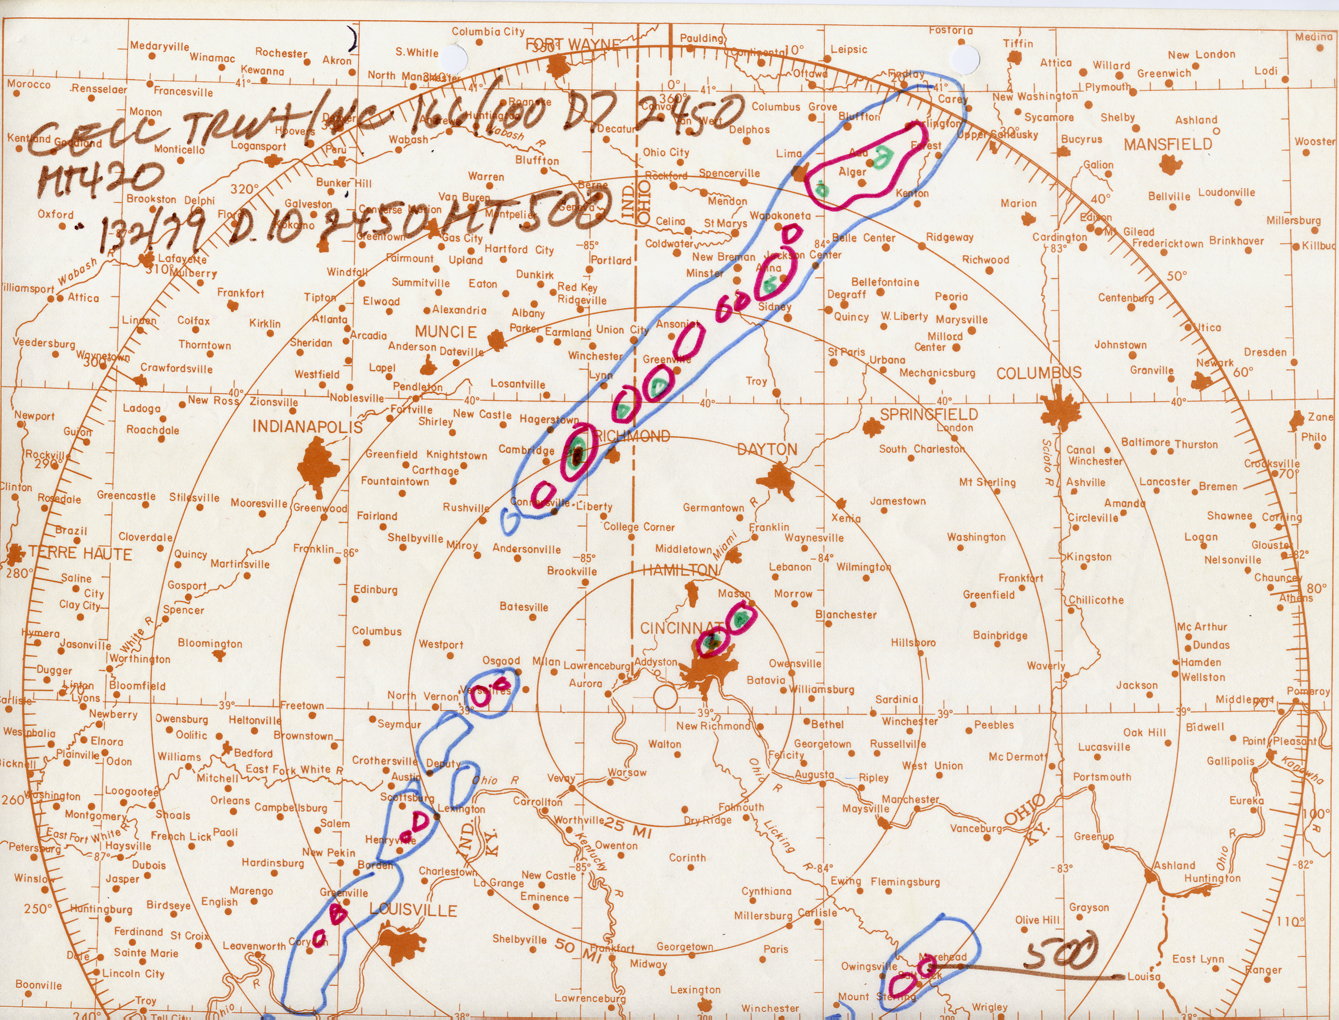
The following images reveal that after the outbreak of tornadic supercell thunderstorms the afternoon of April 3rd, another line of storms moved through the region late that evening into the early morning hours of April 4th. These images are more typical radar observation overlays, with different colors used to denote the varying intensity levels within the storm echoes.
 |
 |
 |
|
 |
 |
 |
 |

