| Previous Month | Next Month |
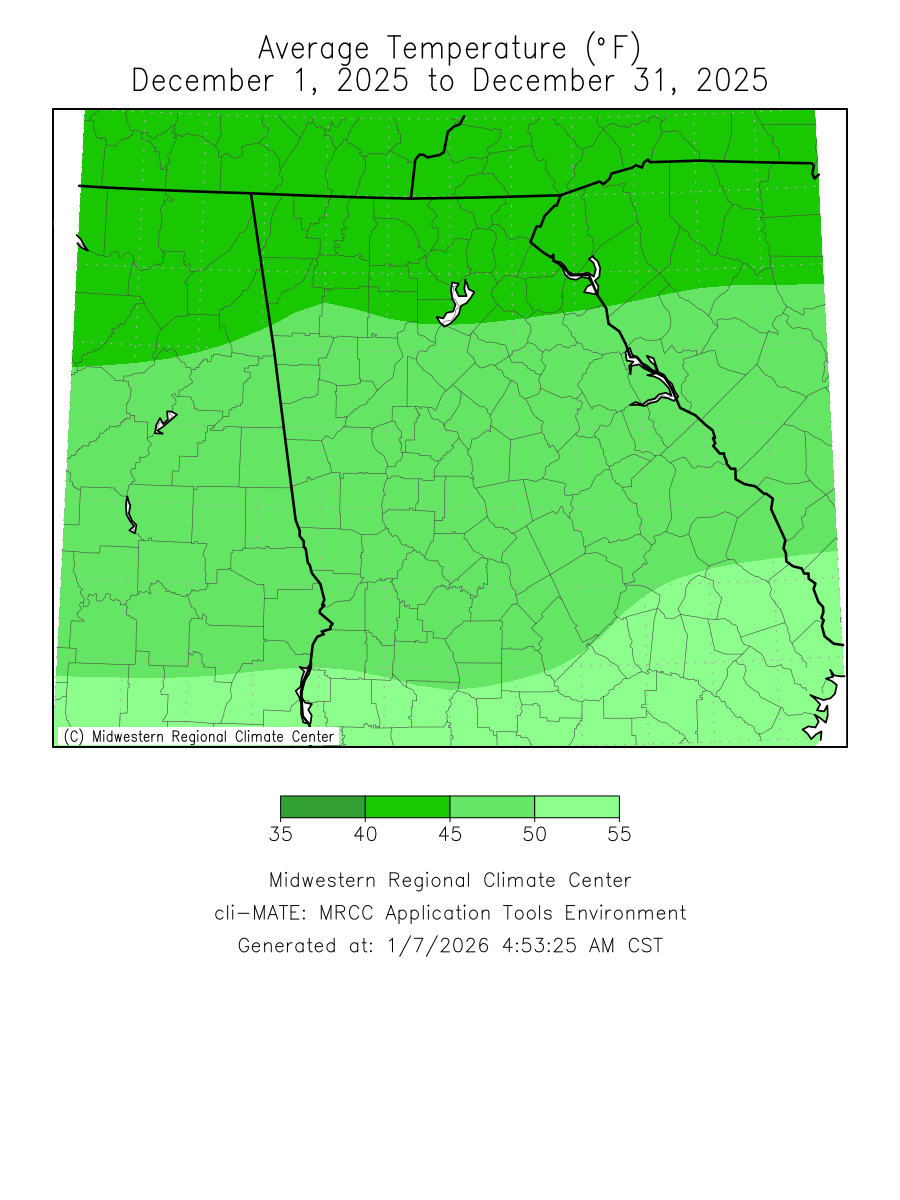
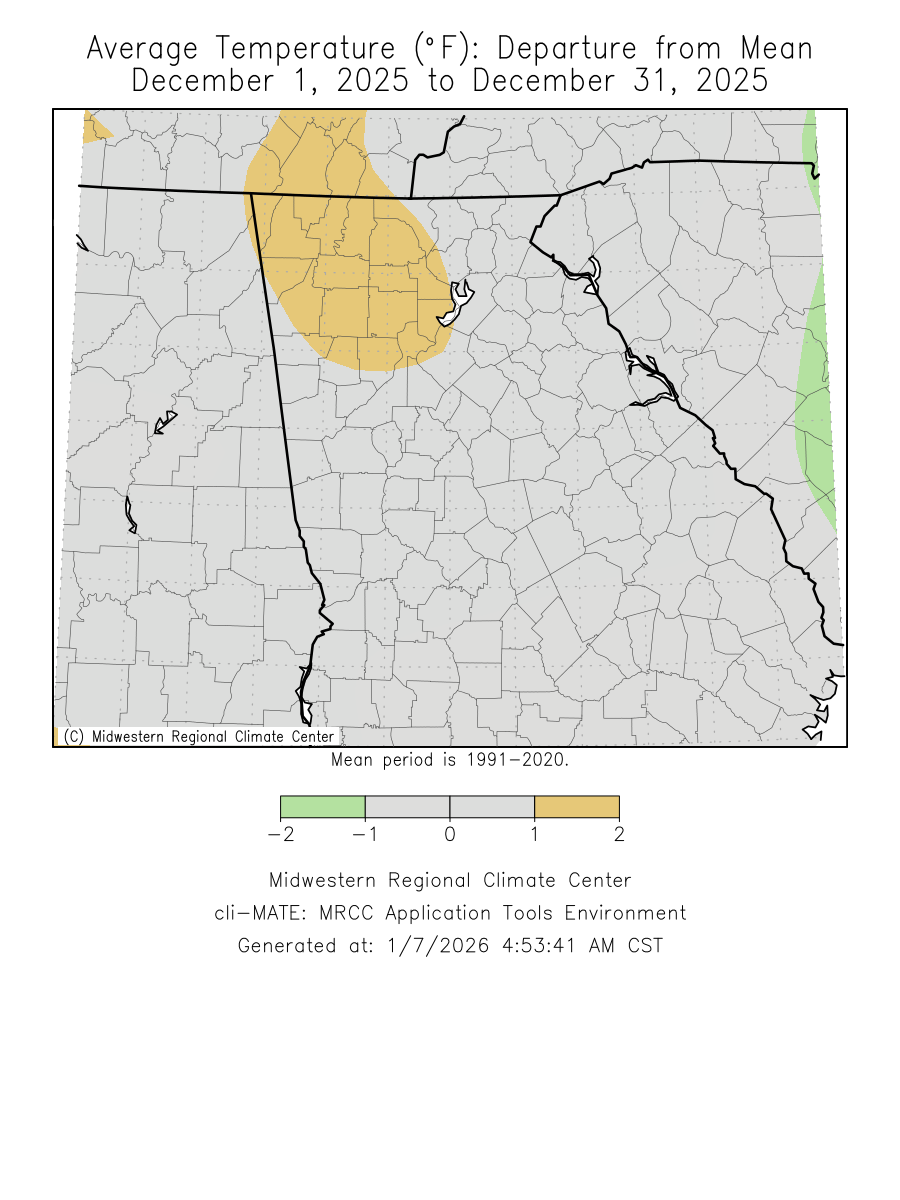
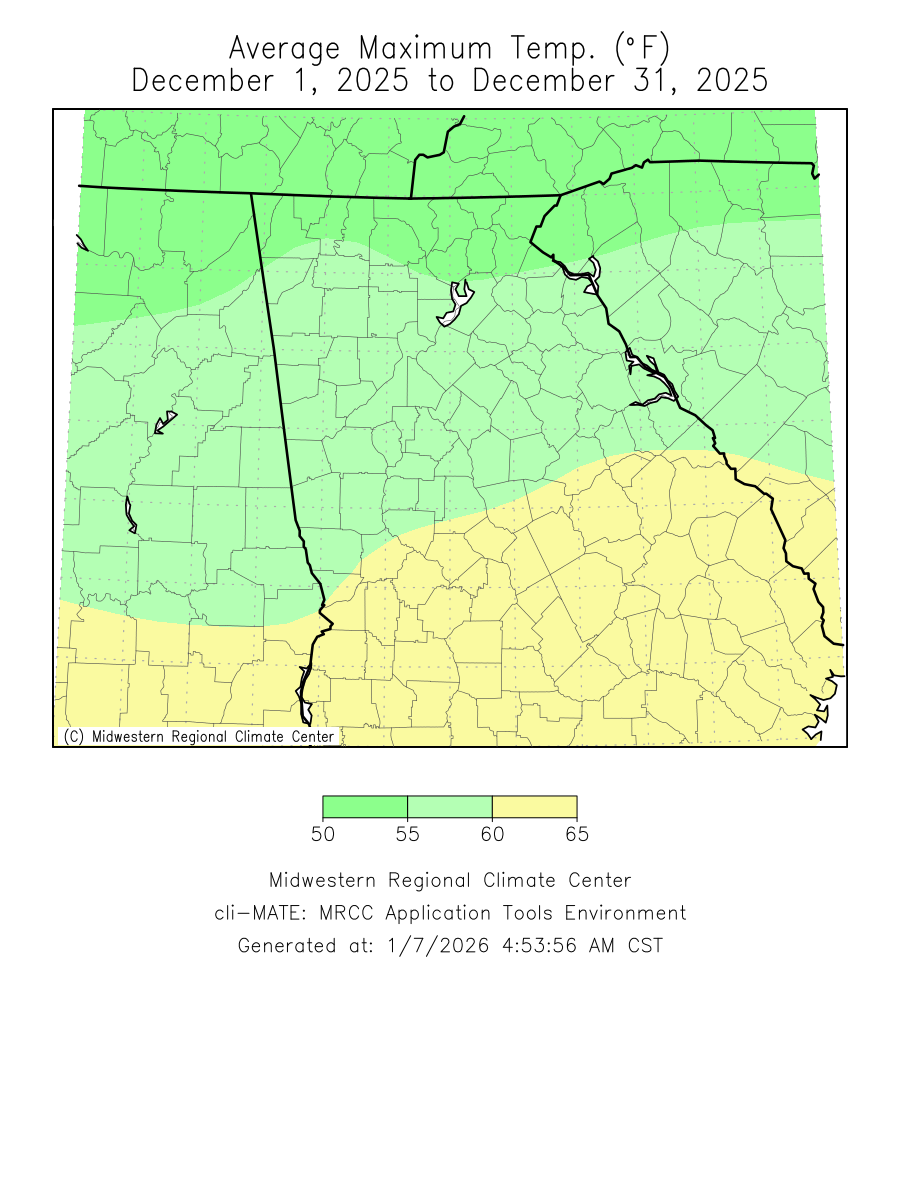
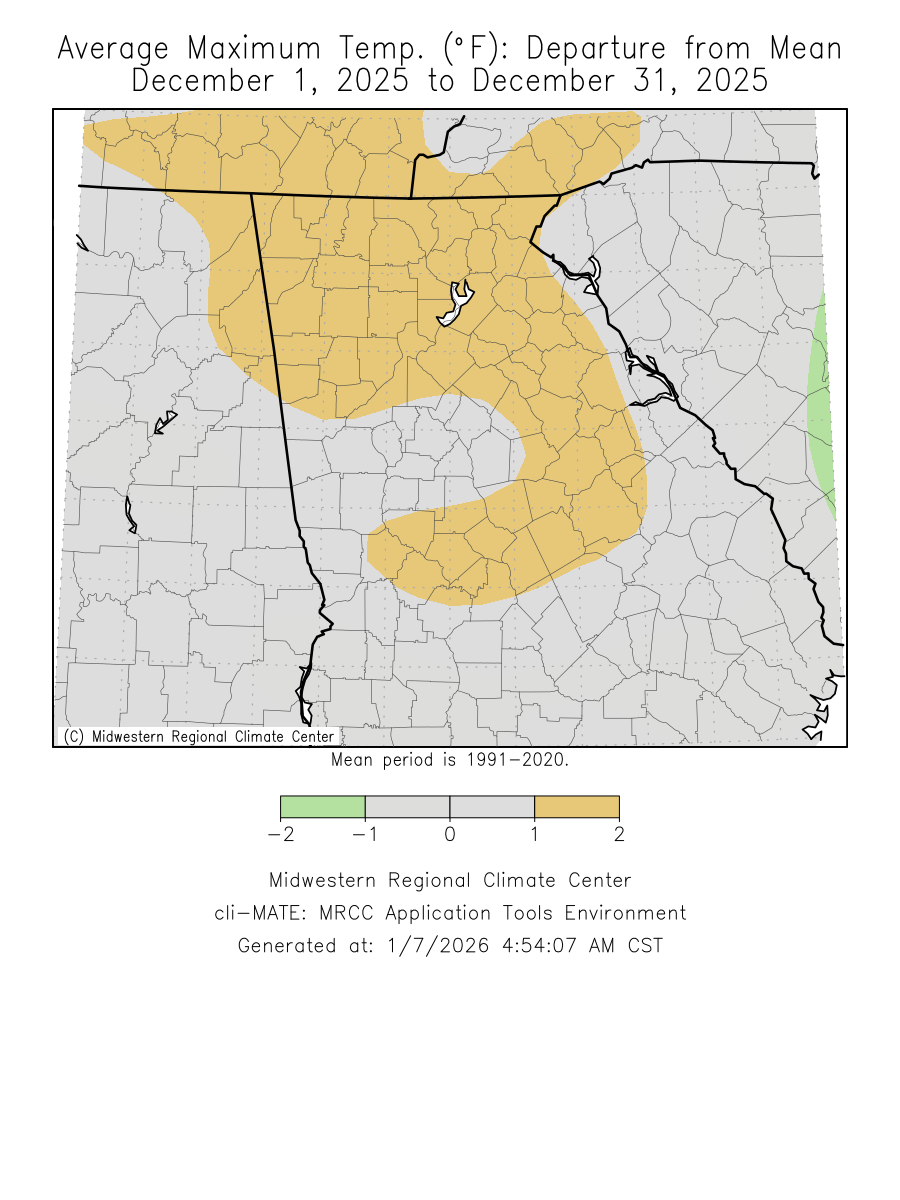
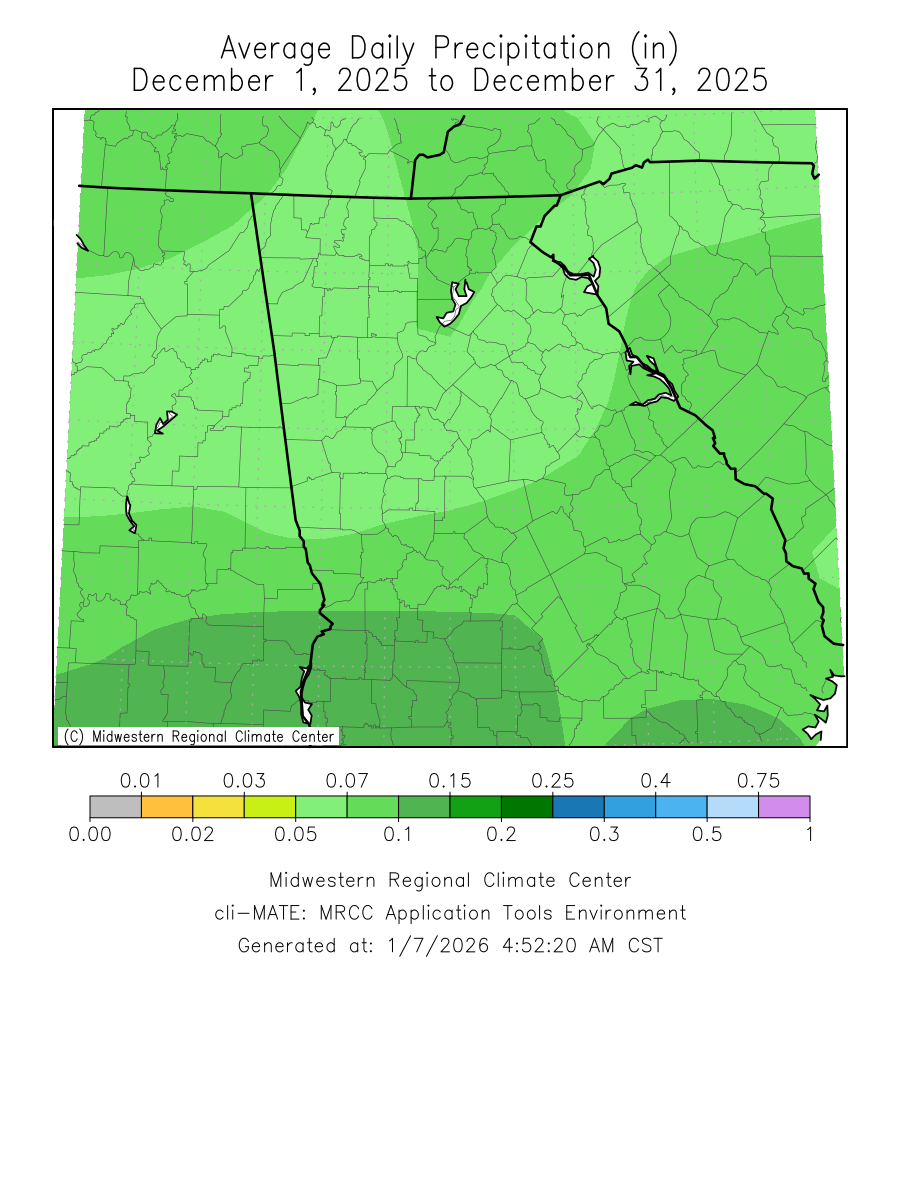
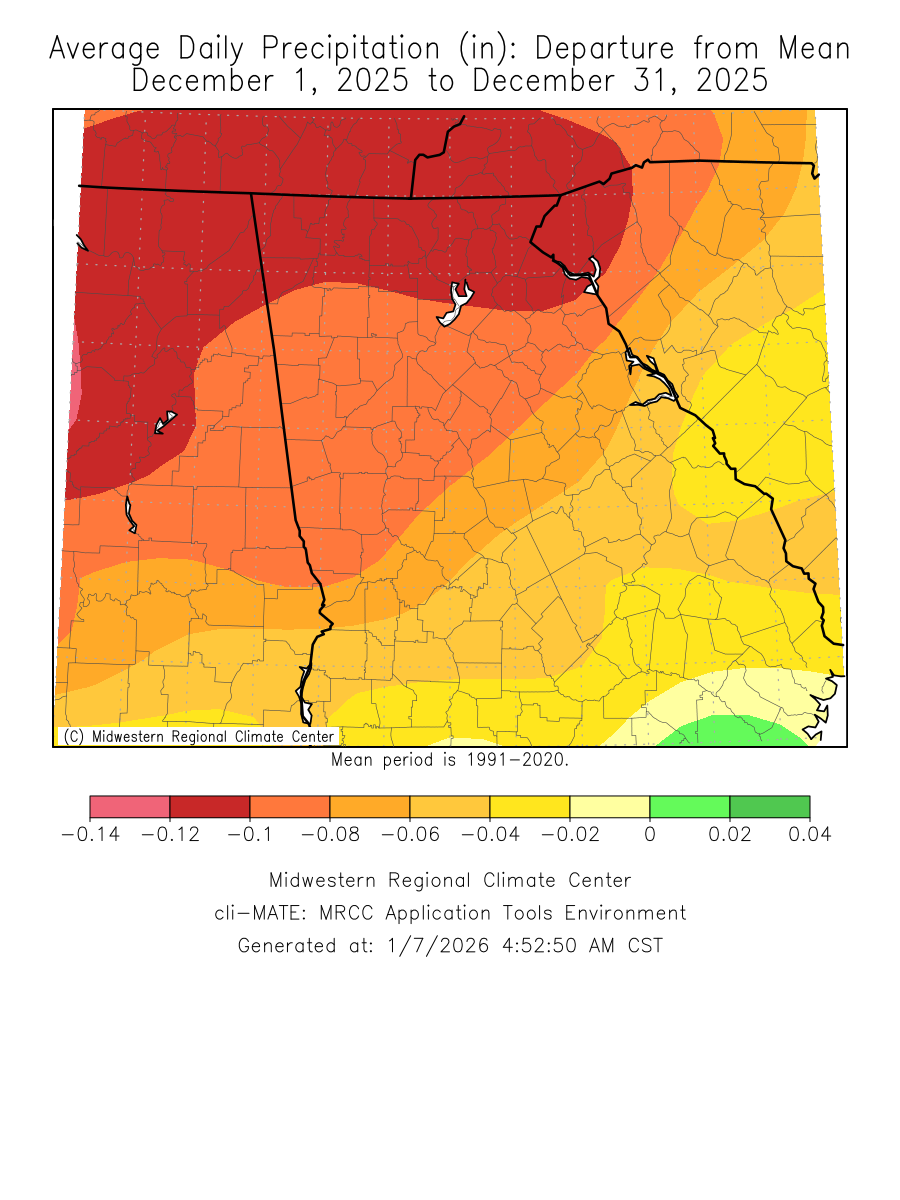
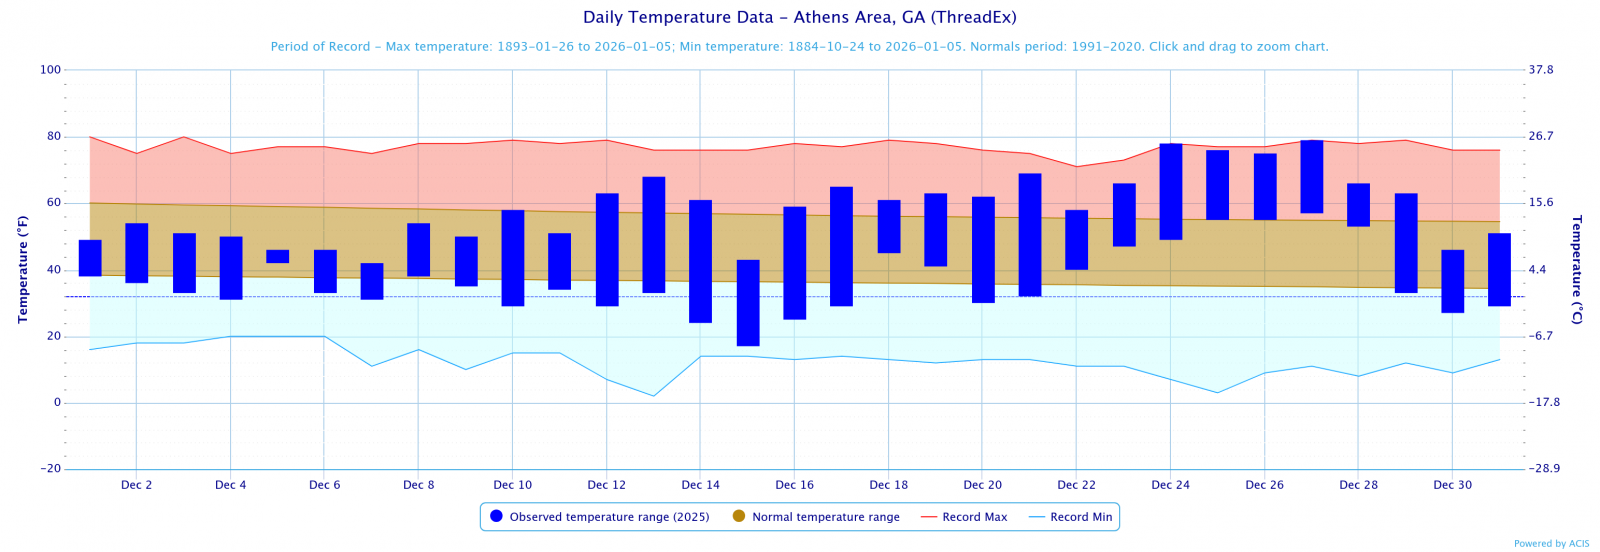
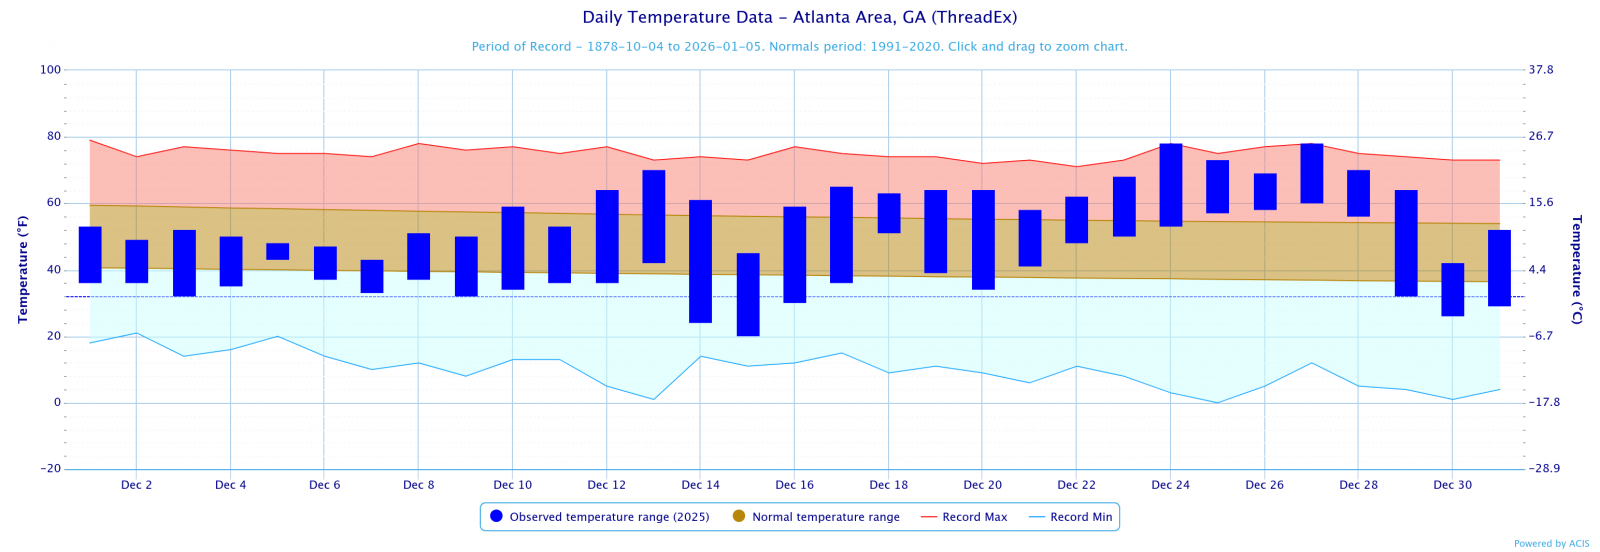
Temperatures through the month of December were one degree above normal. Precipitation through the month of December was around 2 and a half inches below normal.
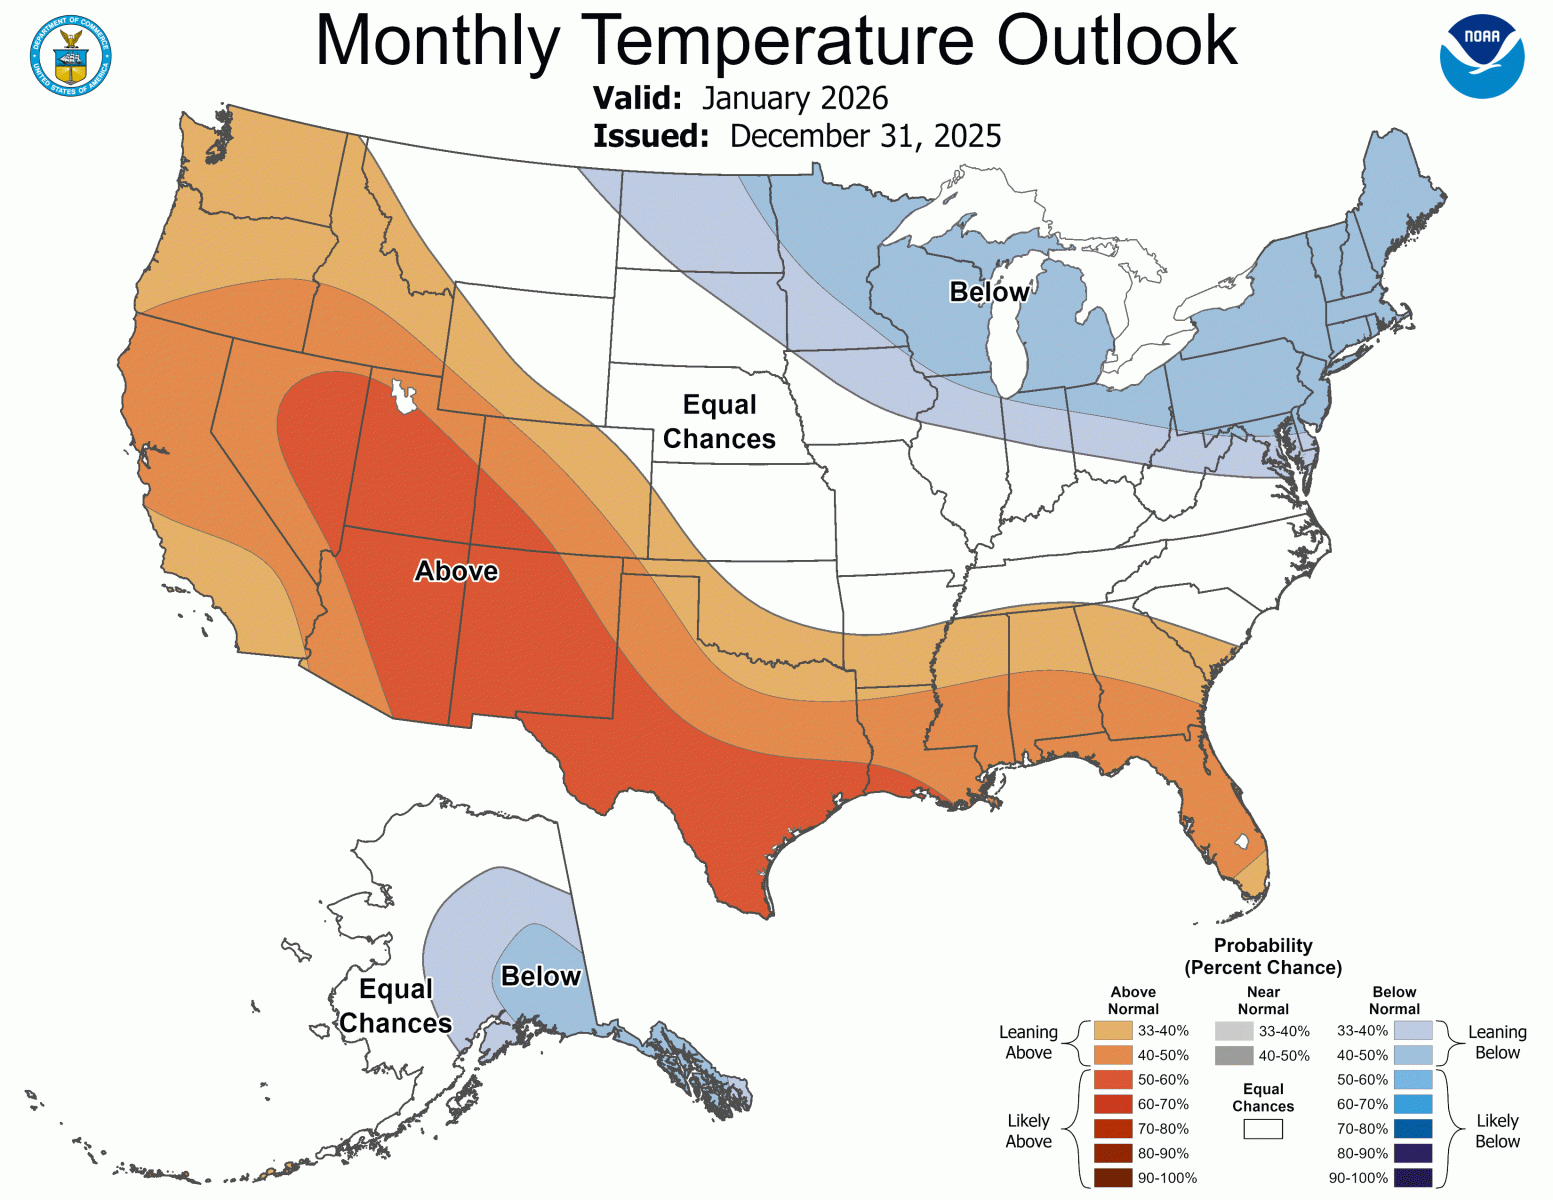
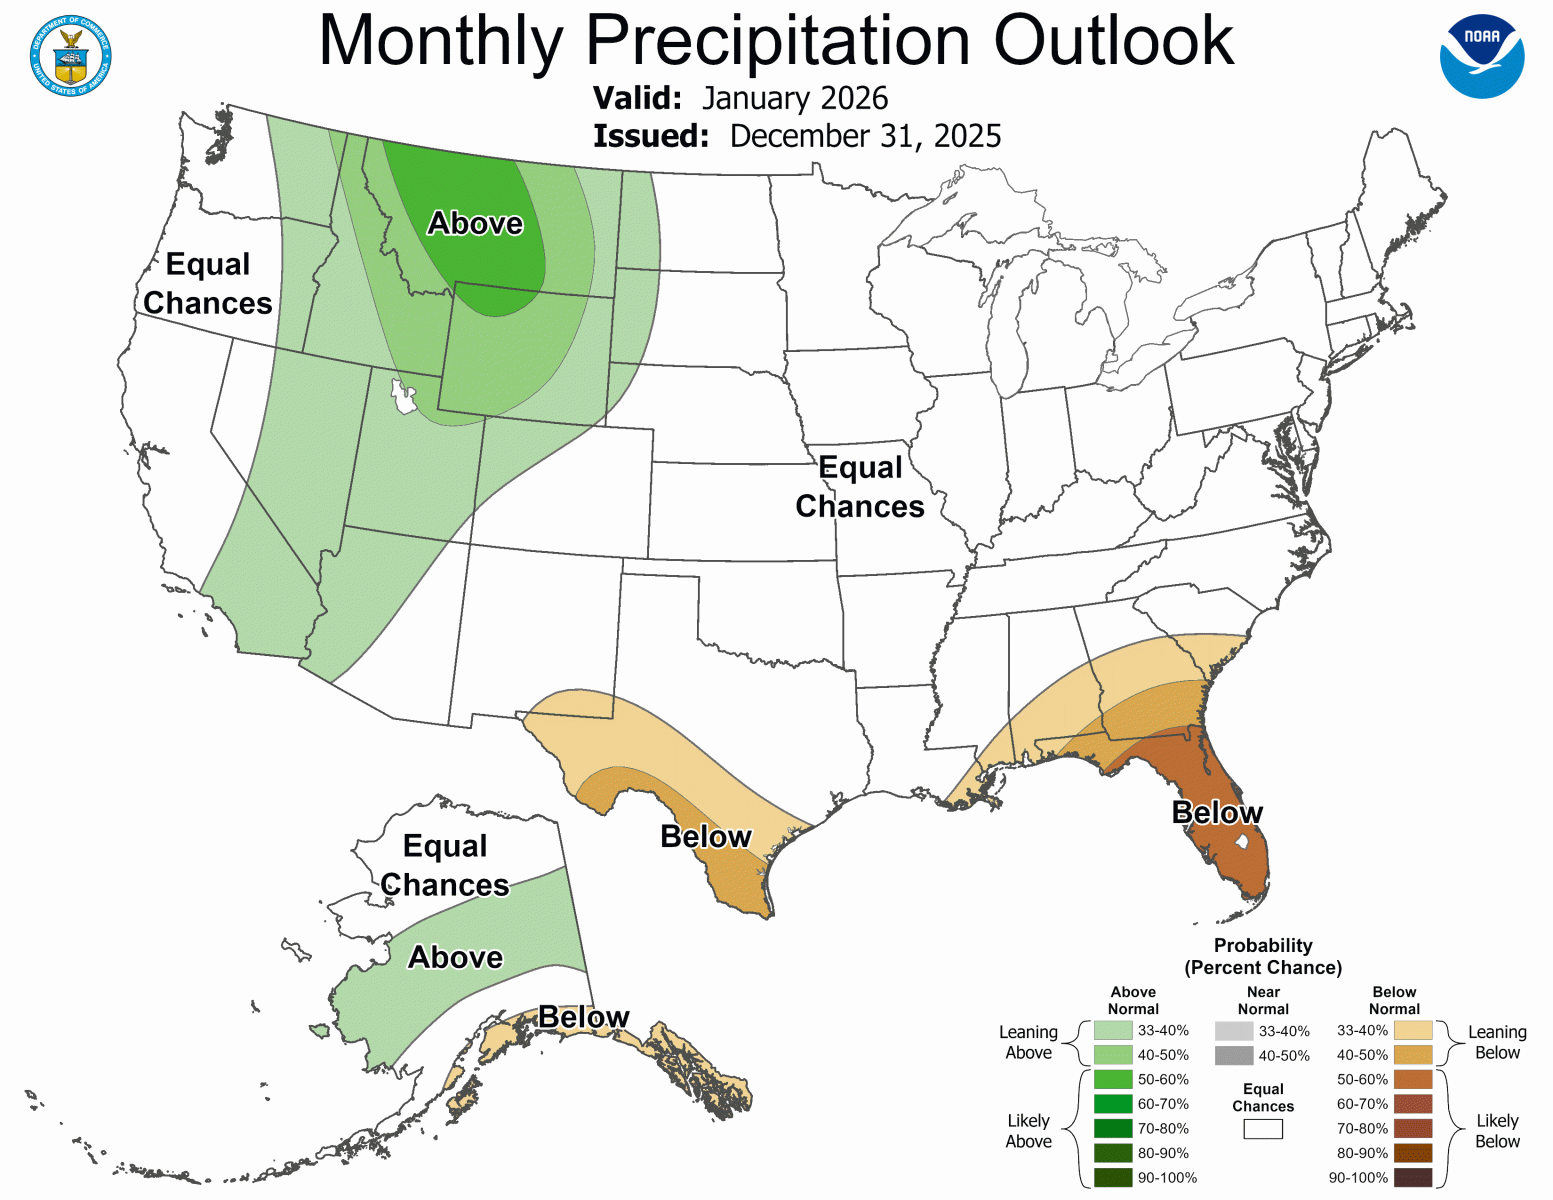
Climate Site Maximum Temperature Max T Date Climate Site Total Precipitation DFN (Departure Climate Site Maximum Daily Precip (in inches) Max P Date Data prepared by NWS Peachtree City/Atlanta Based on the Climate Prediction Center's outlook for January, Georgia has a 30-50% chance for above normal temperatures. For precipitation, most of Georgia has of south and central Georgia has a 40-60% chance of below normal precipitation while the remainder of Georgia has an equal chance of above or below normal precipitation.
Overview
Climate Graphs
Records
Events
January Outlook
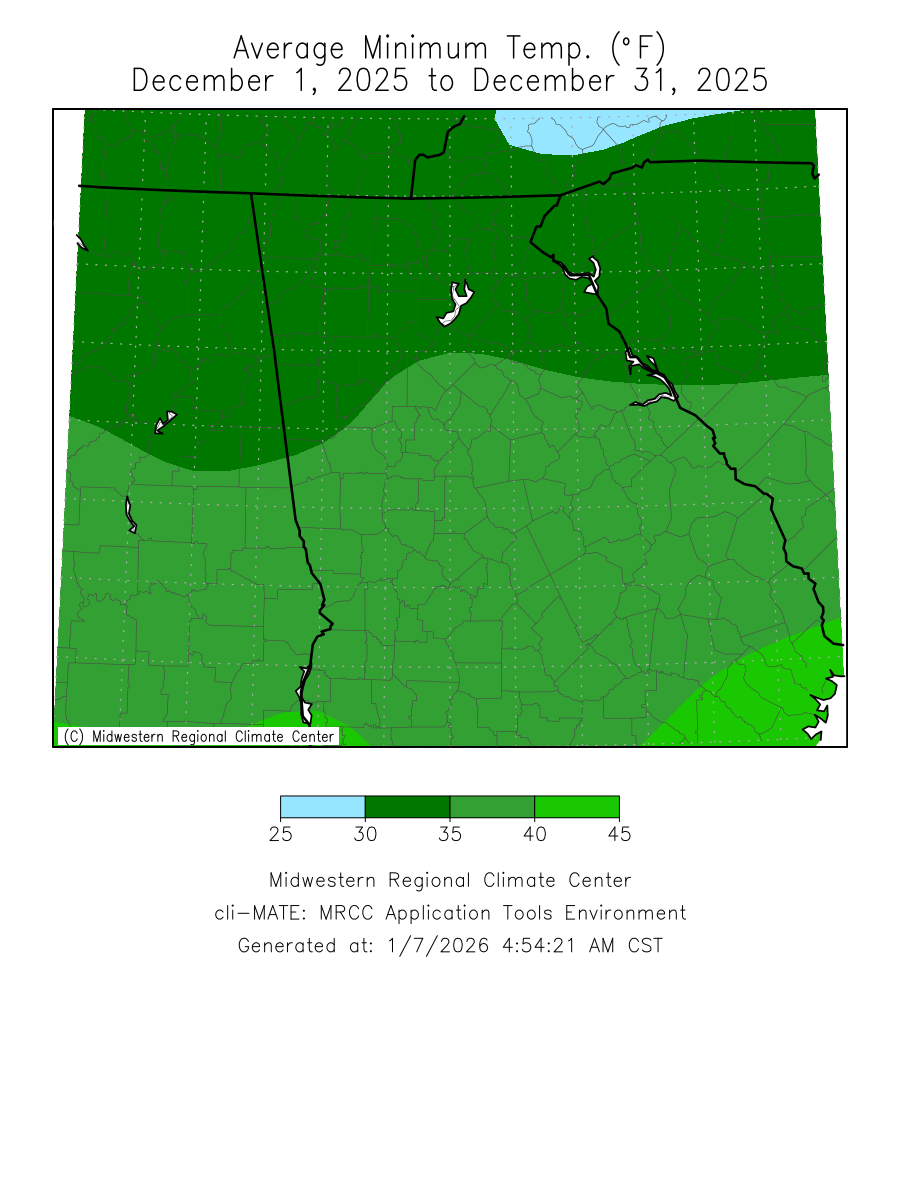
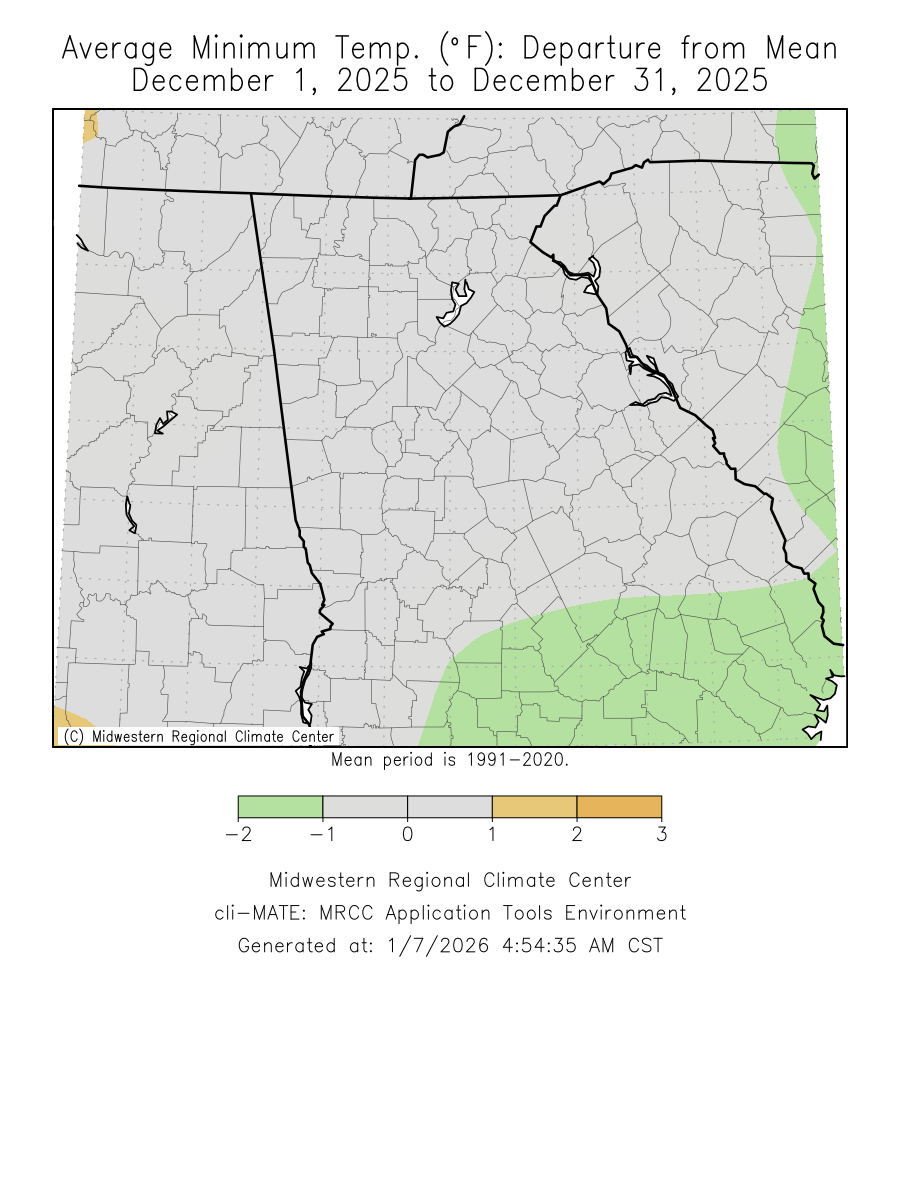
Below are the overview stats for December 2025 for our 9 climate sites.
December 2025 Climate Averages
Climate Site
December Temp (°F)
Average Temp
Departure from normal
Athens
47.6
46.5
1.1
Atlanta
49.0
47.3
1.7
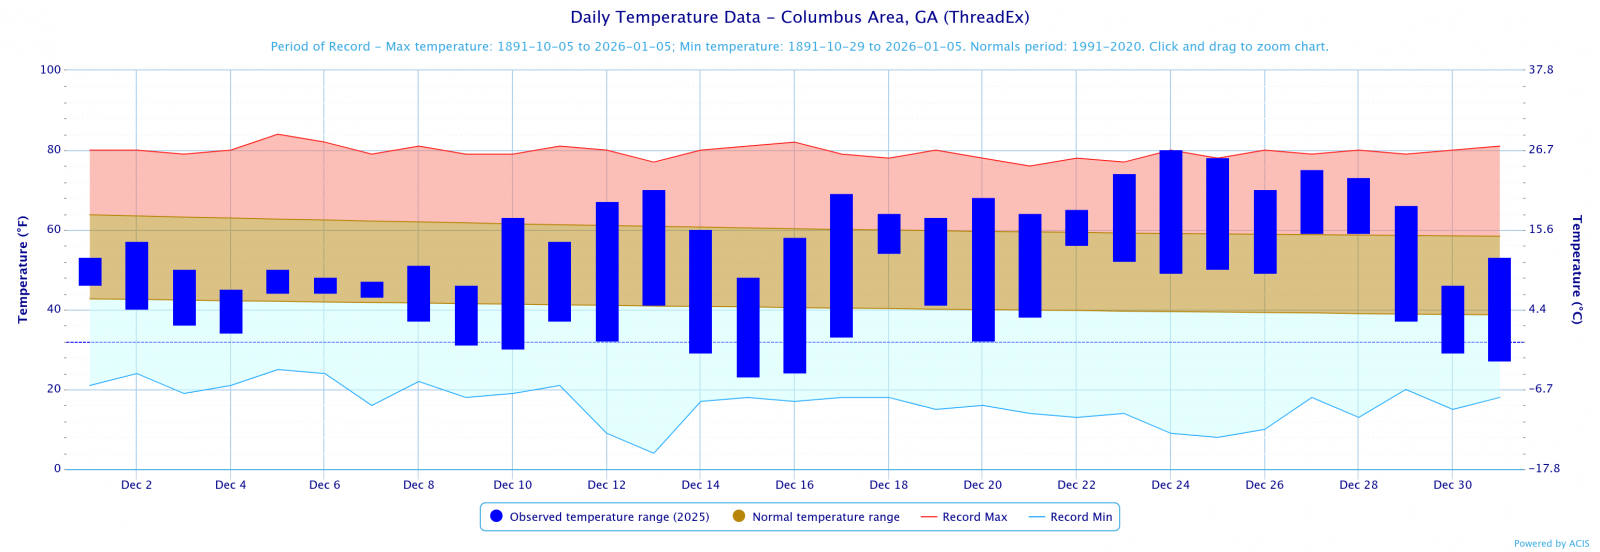
Columbus
50.2
50.6
-0.4
Macon
48.7
49.5
-0.8
Dekalb Peachtree Arpt
47.6
44.9
2.7
Fulton Co Arpt
46.3
46.0
0.3
Gainesville
45.8
44.9
0.9
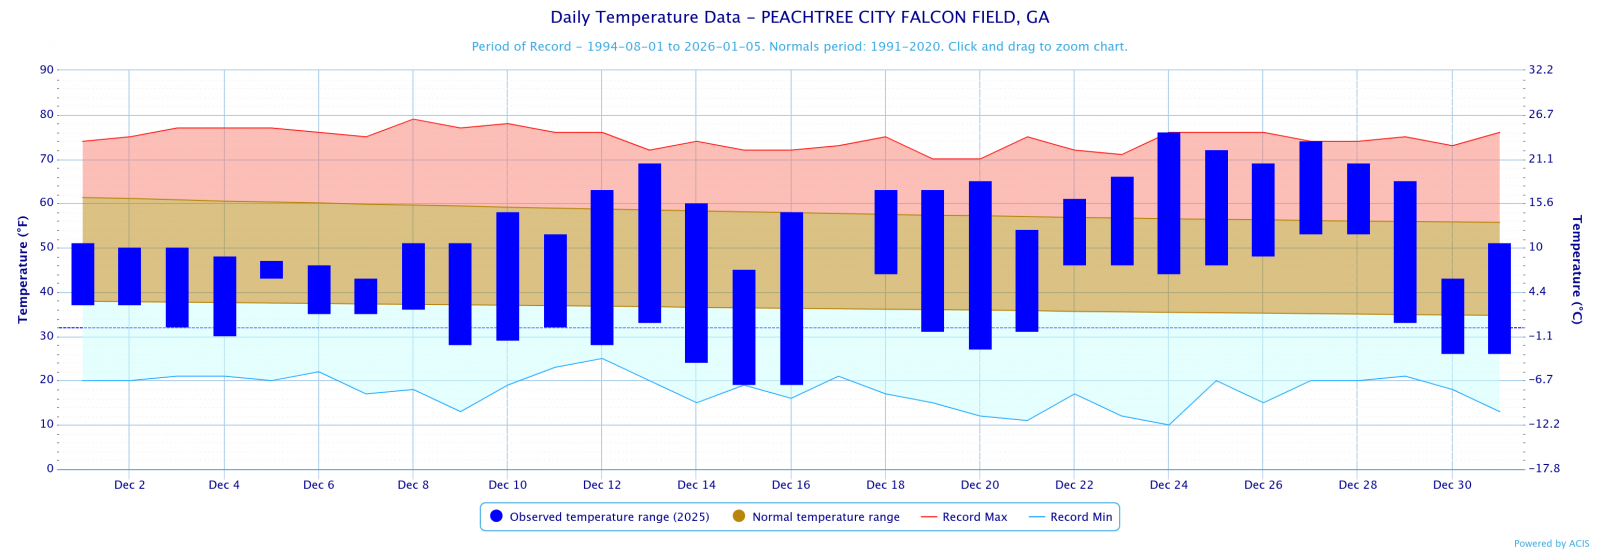
Peachtree City
46.4
47.2
-0.8
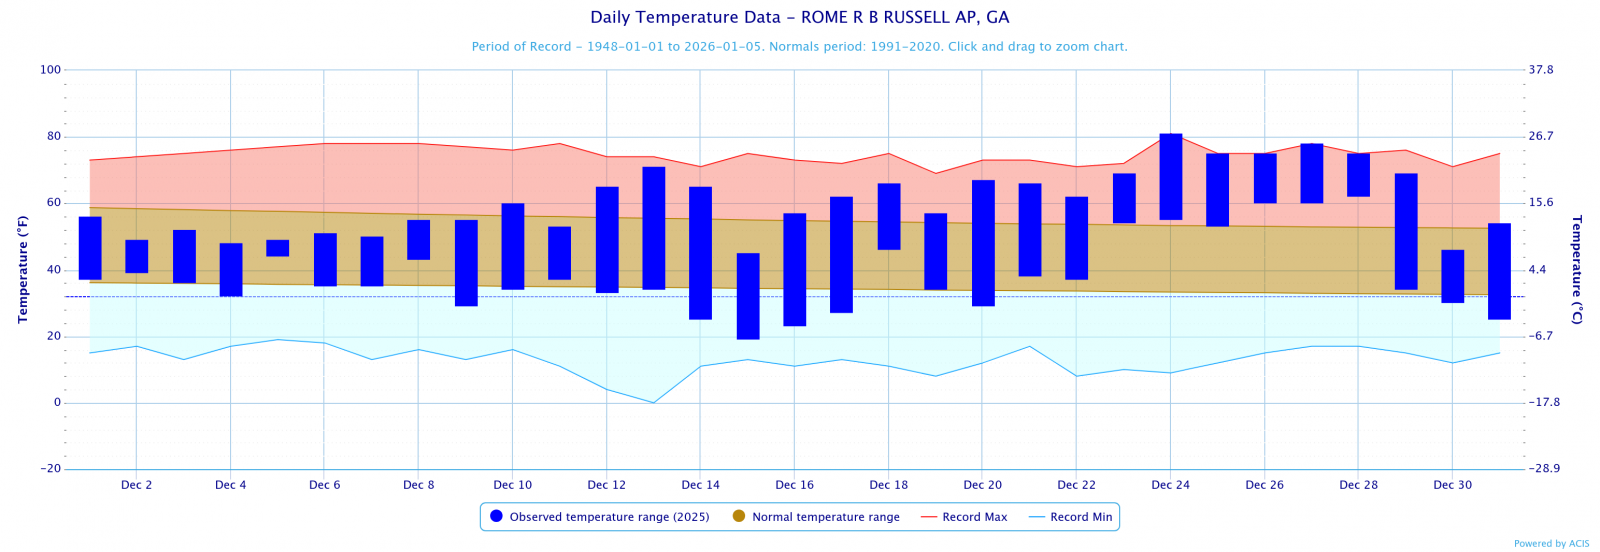
Rome
49.4
44.7
4.7
December 2025 Temperature Climate Statistics
Minimum Temperature
Min T Date
Athens
79
12/27
17
12/15
Atlanta
78
12/24,27
20
12/15
Columbus
80
12/24
23
12/15
Macon
81
12/24
18
12/16
Dekalb Peachtree Arpt
78
12/27
16
12/15
Fulton Co Arpt
77
12/27
16
12/15
Gainesville
73
12/24
20
12/15
Peachtree City
76
12/24
19
12/15, 16
Rome
81
12/24
19
12/15
December 2025 Precipitation Climate Statistics
Average Precipitation
From Normal)
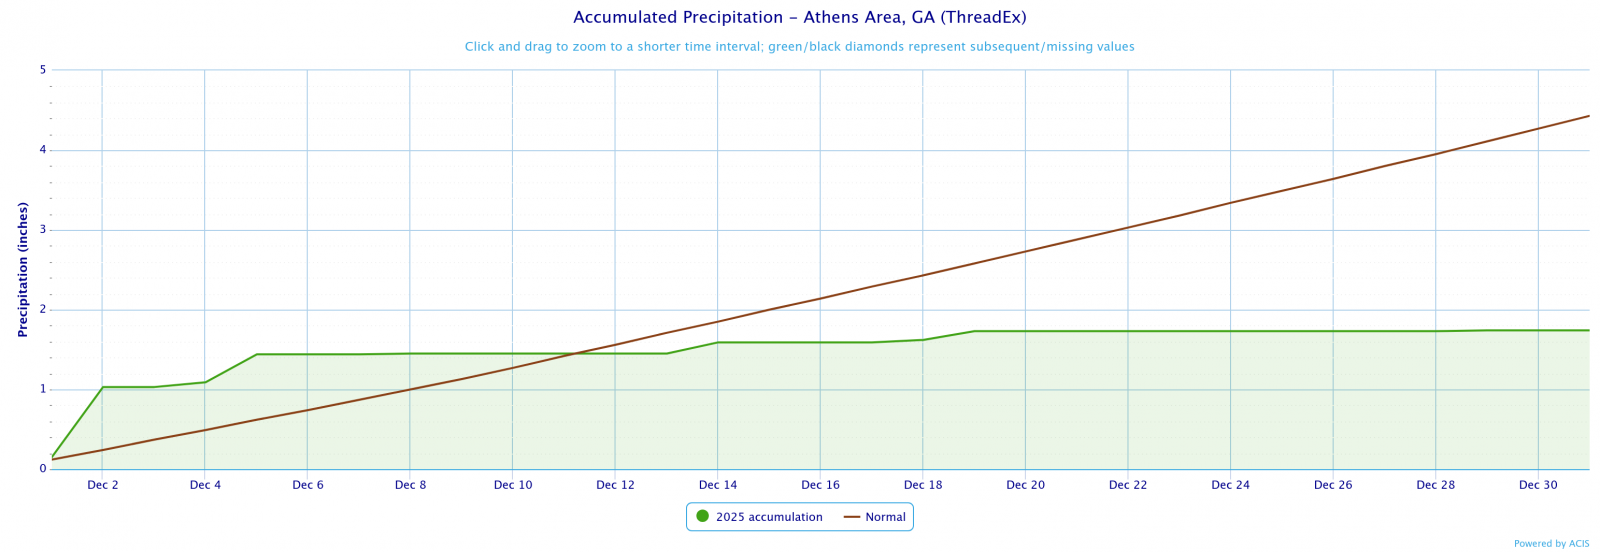
Athens
1.74
4.43
-2.69
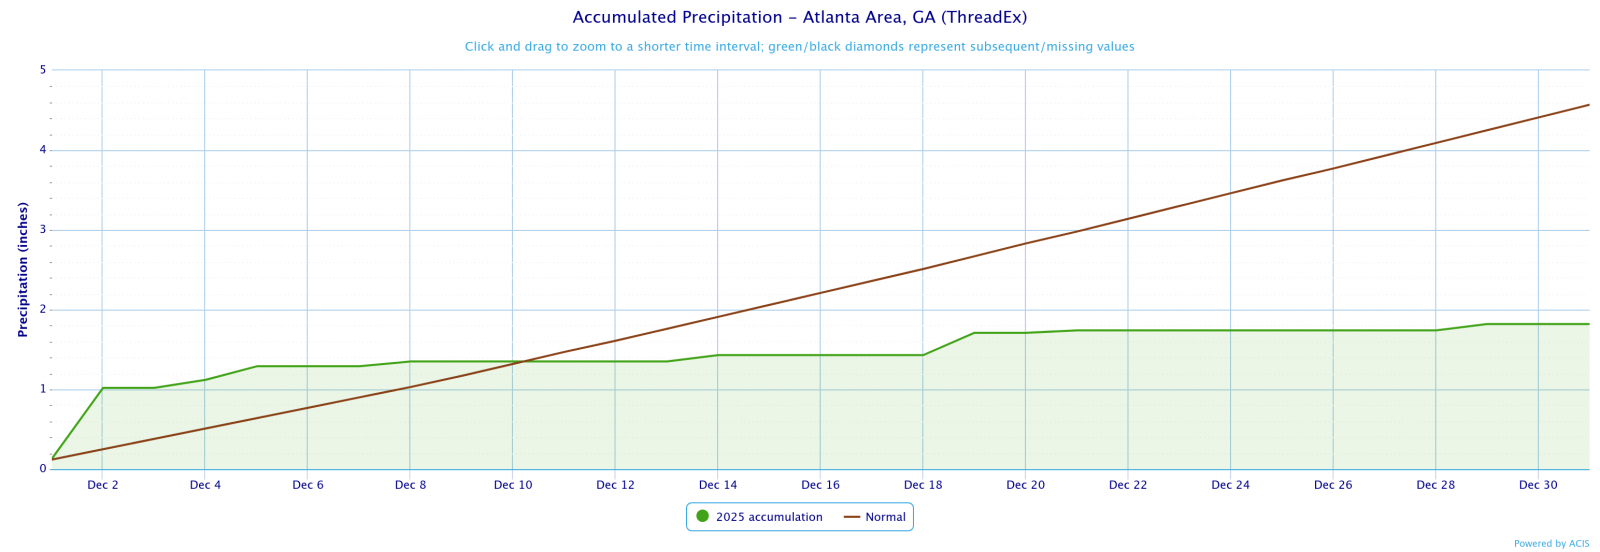
Atlanta
1.82
4.57
-2.75
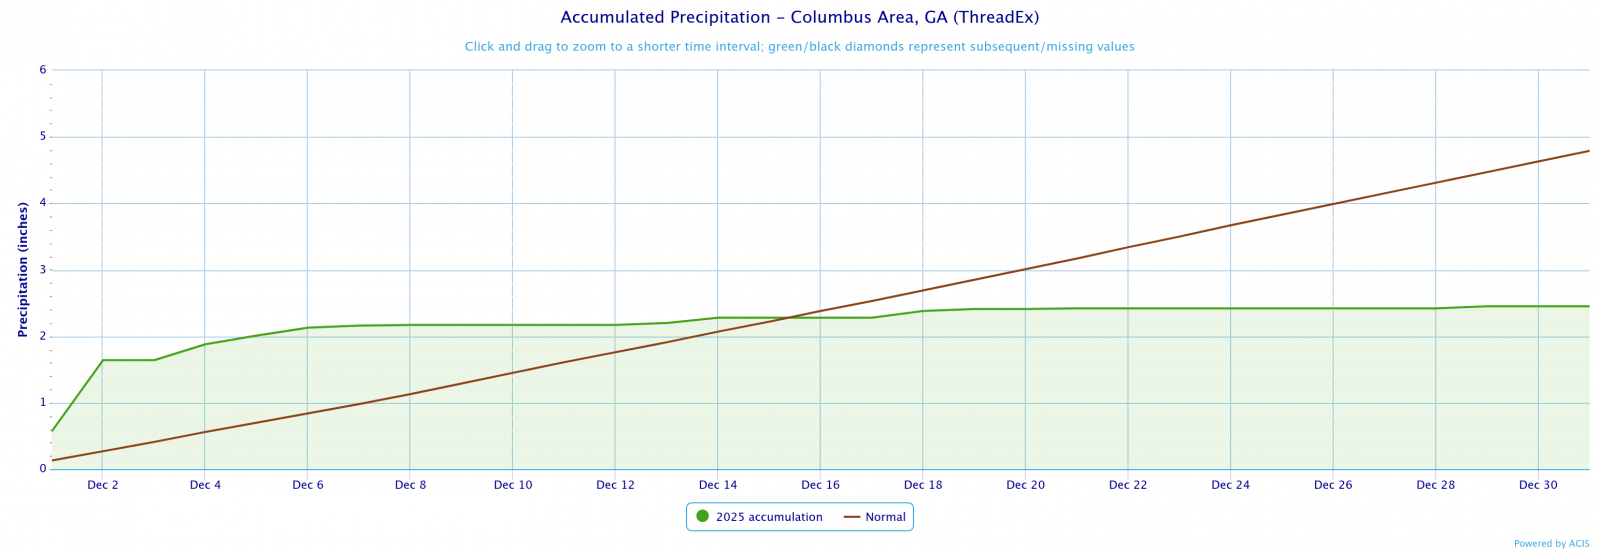
Columbus
2.45
4.79
-2.34
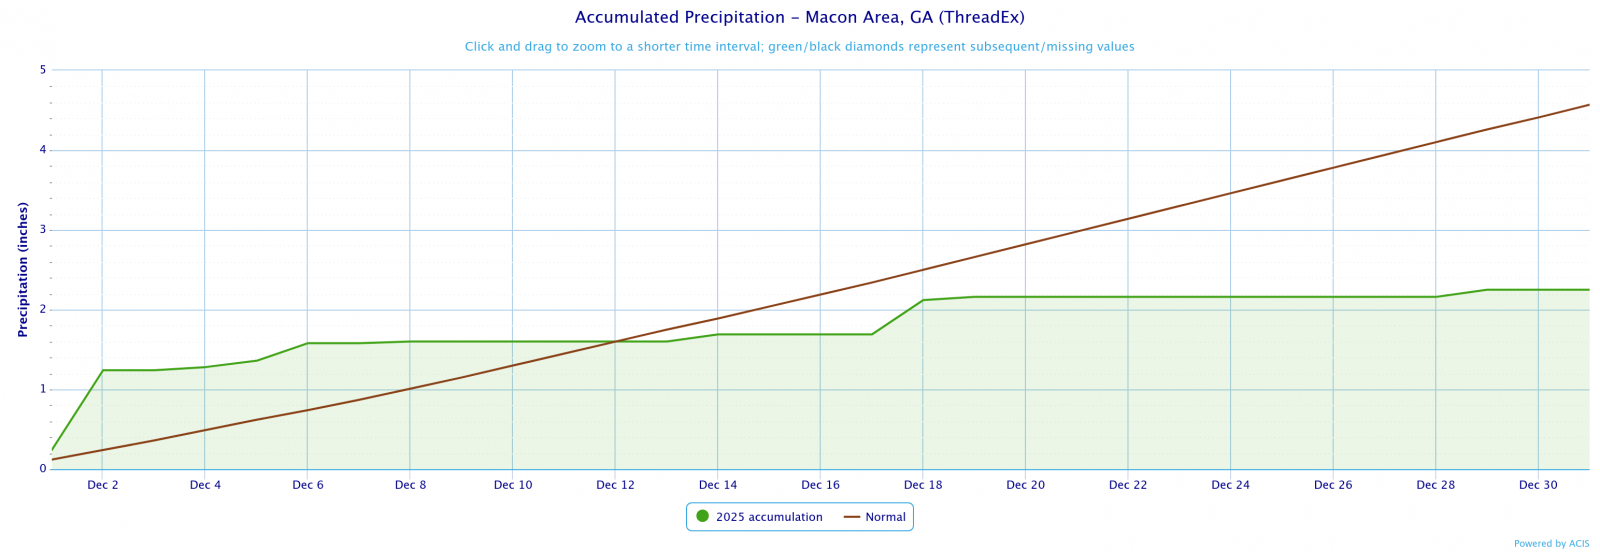
Macon
2.35
3.96
-2.32
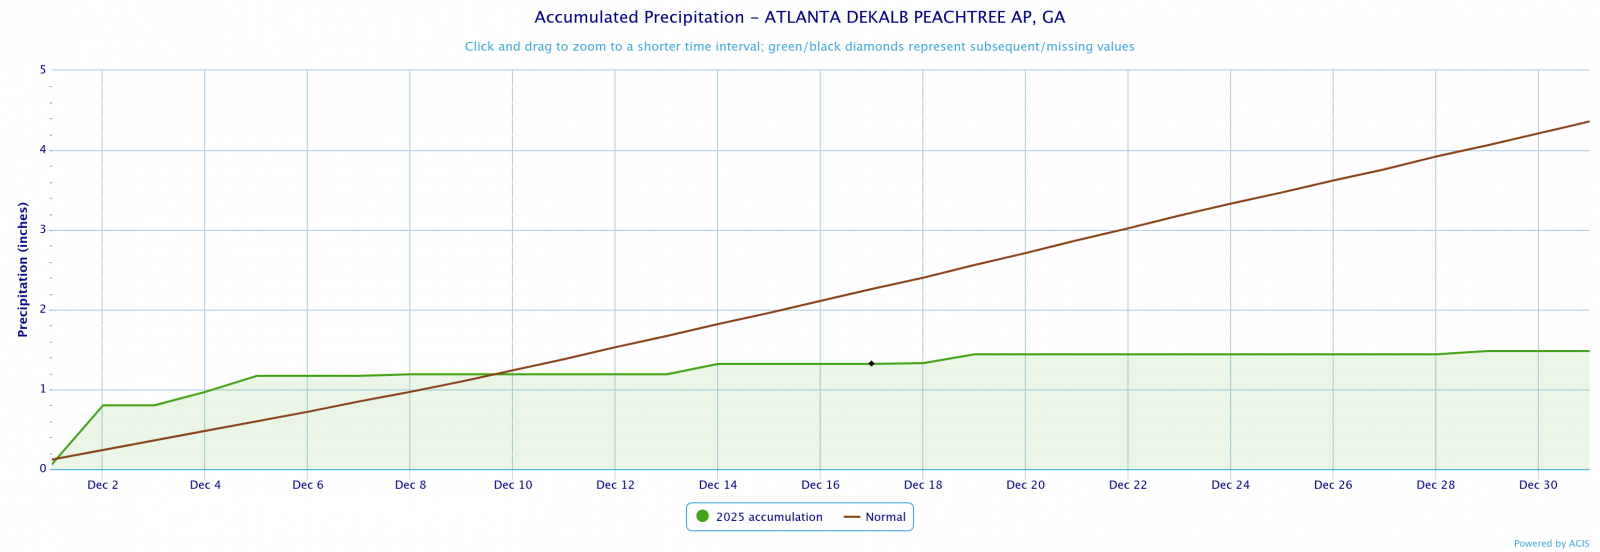
Dekalb Peachtree Arpt
1.48
4.36
-2.88
Fulton County Arpt
1.47
4.21
-2.74
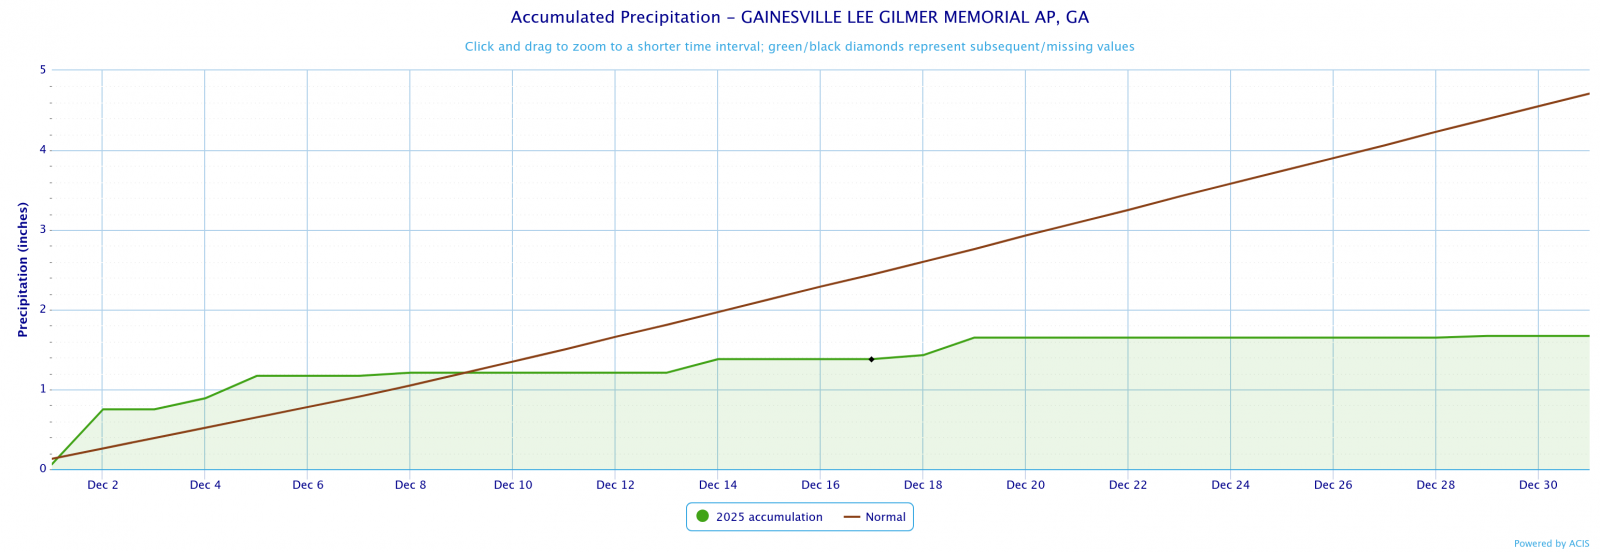
Gainesville
1.67
8.59
-3.04
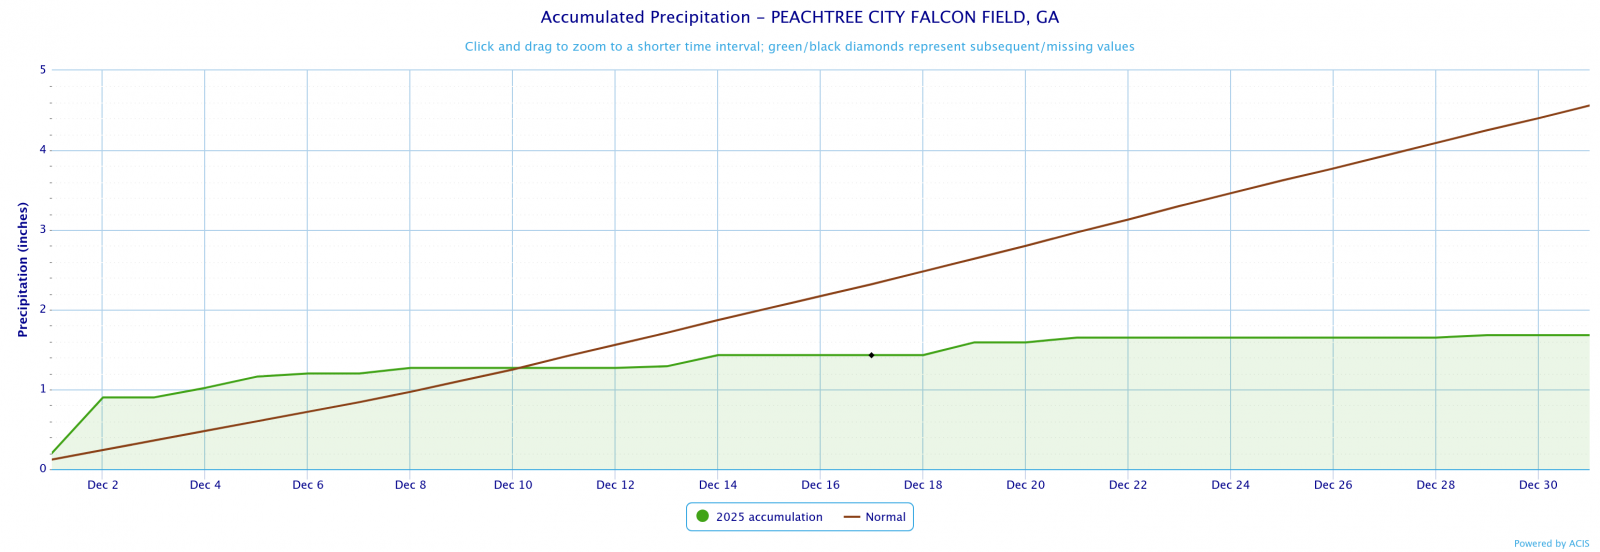
Peachtree City
1.68
4.56
-2.88
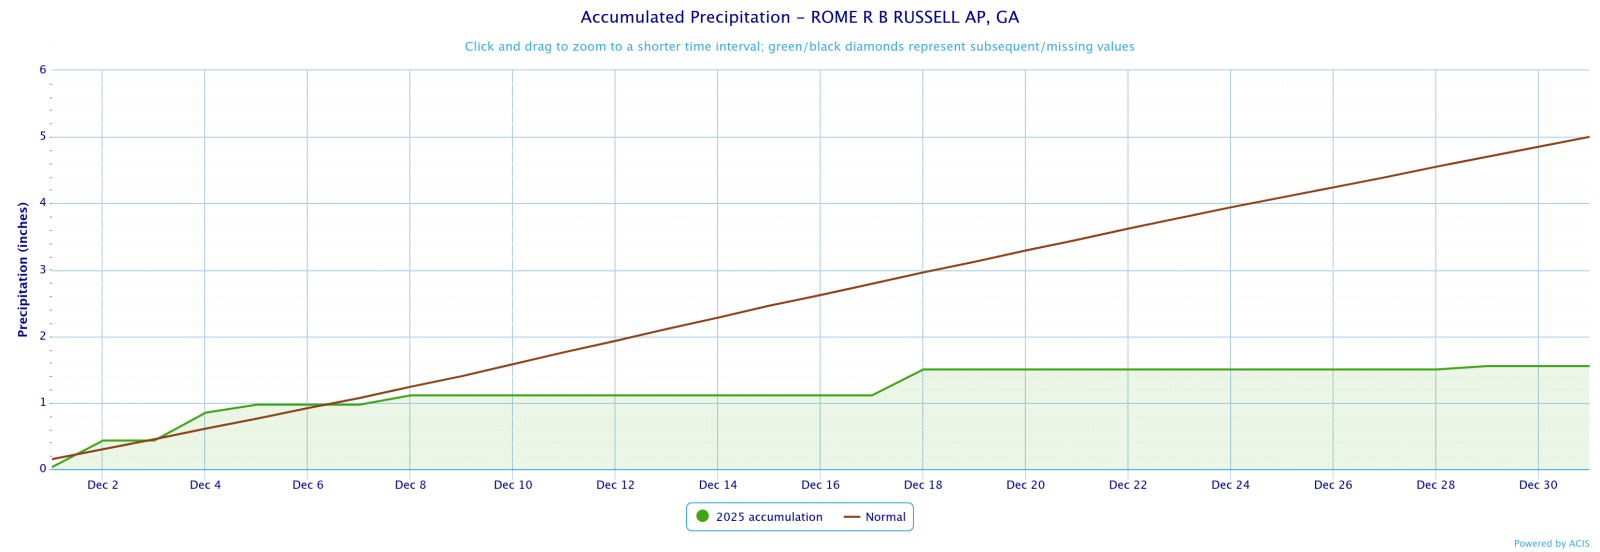
Rome
1.55
5.00
-3.45
December 2025 Precipitation Climate Statistics
Athens
1.03
12/1
Atlanta
1.02
12/1
Columbus
1.64
12/1
Macon
1.24
12/1
Dekalb Peachtree Arpt
0.8
12/1
Fulton Co Arpt
0.82
12/1
Gainesville
0.75
12/1
Peachtree City
0.9
12/1
Rome
0.54
12/9
Click the links below to explore the temperature and precipitation data across north and central Georgia for the month of December 2025.
Temperature Maps
Precipitation Maps
Temperature Graphs
Precipitation Graphs


Temperature and precipitation records at our 4 main climate sites are located below.
December 2025 Climate Records
Date
Type
Location
Records set over a 24 hour period
12/24
Max Temp
Athens
Athens rose to 78°F which breaks the record of 77 set in 1964.
12/27
Max Temp
Athens
Athens rose to 79°F which breaks the record of 74 set in 2016.
12/24
Max Temp
Atlanta
Atlanta rose to 78°F which breaks the record of 73 set in 2016.
12/27
Max Temp
Atlanta
Atlanta rose to 78°F which breaks the record of 75 set in 2015.
12/24
Max Temp
Columbus
Columbus rose to 80°F which breaks the record of 79 set in 1984.
12/24
Max Temp
Macon
Macon rose to 81°F which breaks the record of 77 set in 1964.
No significant weather events occurred across north and central Georgia this past November.
The January climate outlook is below.
December Outlook