Jackson, Mississippi
Weather Forecast Office
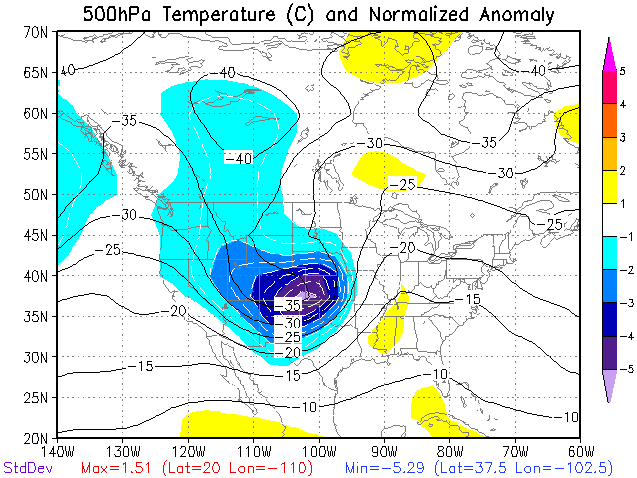
Across the region of interest, the mid-level temperatures were only a tad above what we typically see for early March. However, the core of the system had extremely cold air associated with it. The "cold core" was about -35 C which was >5 standard deviations below normal! This indicates what type of mid-level air was moving east and gives a general idea of the "strong" forcing this large system had. Click on thumbnails for a larger image.
 |
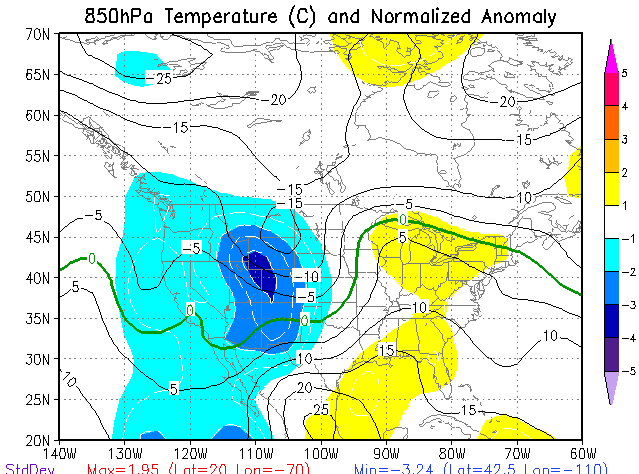
The low-level temperatures (850mb) were quite warm with 13-14 C noted across the region. This was supported by 1-2 standard deviations above normal. One would think that the warmer the better, but for early March, this would not be the case. The reason is, the warmer you are around 850mb, the more potential you have of being "capped". Areas that were too warm at 850mb, likely did not see any thunderstorms. It was the area that had the "balance" which offered just enough warm air to "hold" the storms at bay for a small amount of time. This offered the potential for storms to "explode" where the cap was just weak enough. This will be more evident in the 00z upper air sounding.
 |
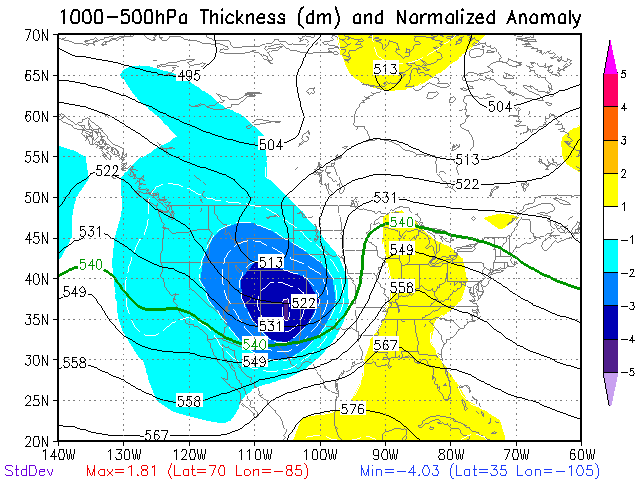
The image below shows the 1000-500 mb thickness. This is a measure of the distance between those 2 levels and is expressed in dm. Traditionally; a 1000-500 mb thickness between 561 and 567 is sort of the "sweet spot" for tornadoes. As you can see in the below image, the tornado occurred very near the 566 and 567 dm contour.
 |
US Dept of Commerce
National Oceanic and Atmospheric Administration
National Weather Service
Jackson, Mississippi
234 Weather Service Dr.
Flowood, MS 39232
601-936-2189
Comments? Questions? Please Contact Us.

