With 2016 now in the books, here's a quick, preliminary look at how the weather numbers stacked up.
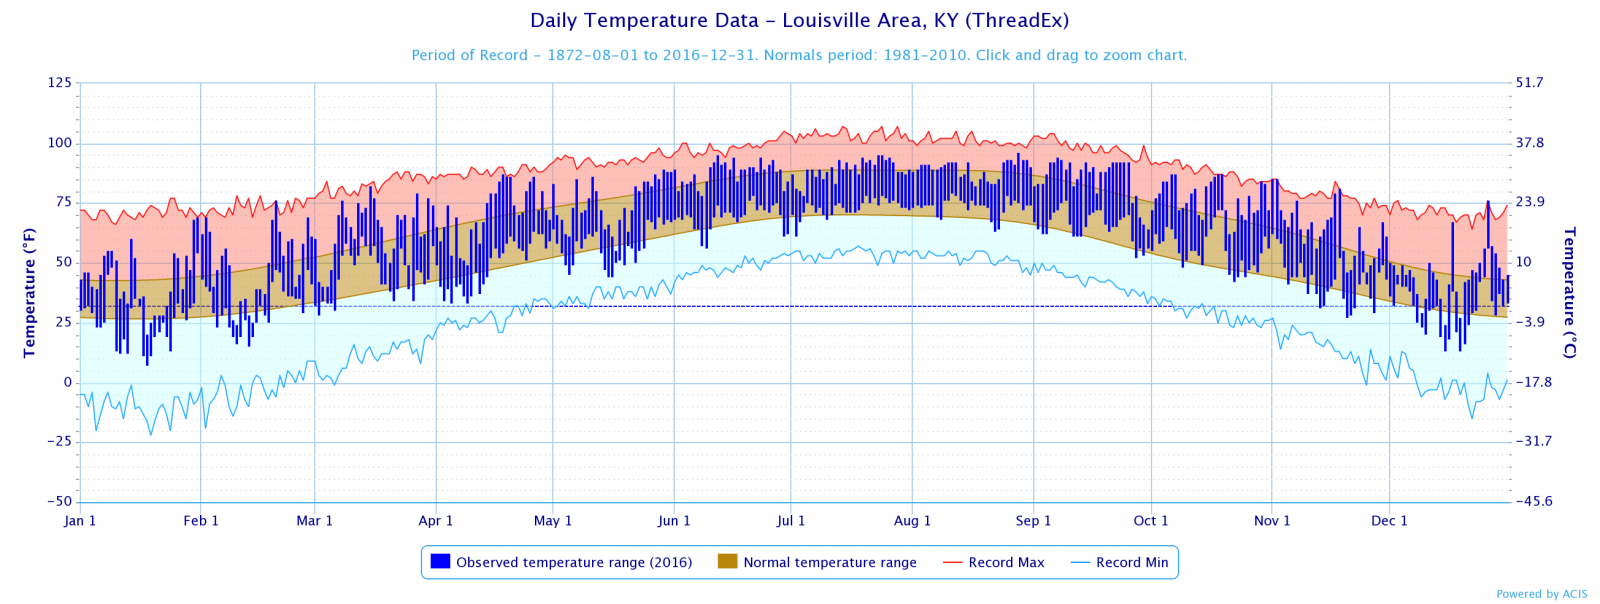
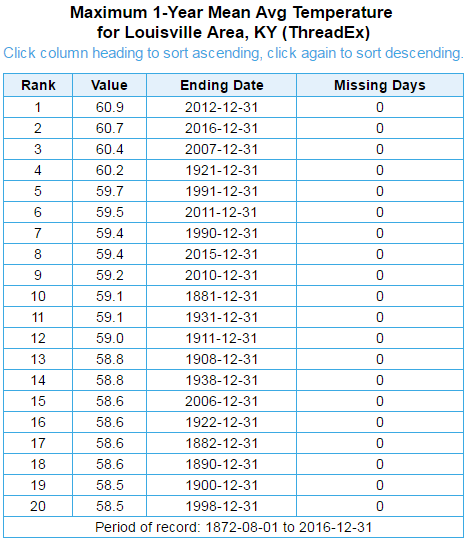
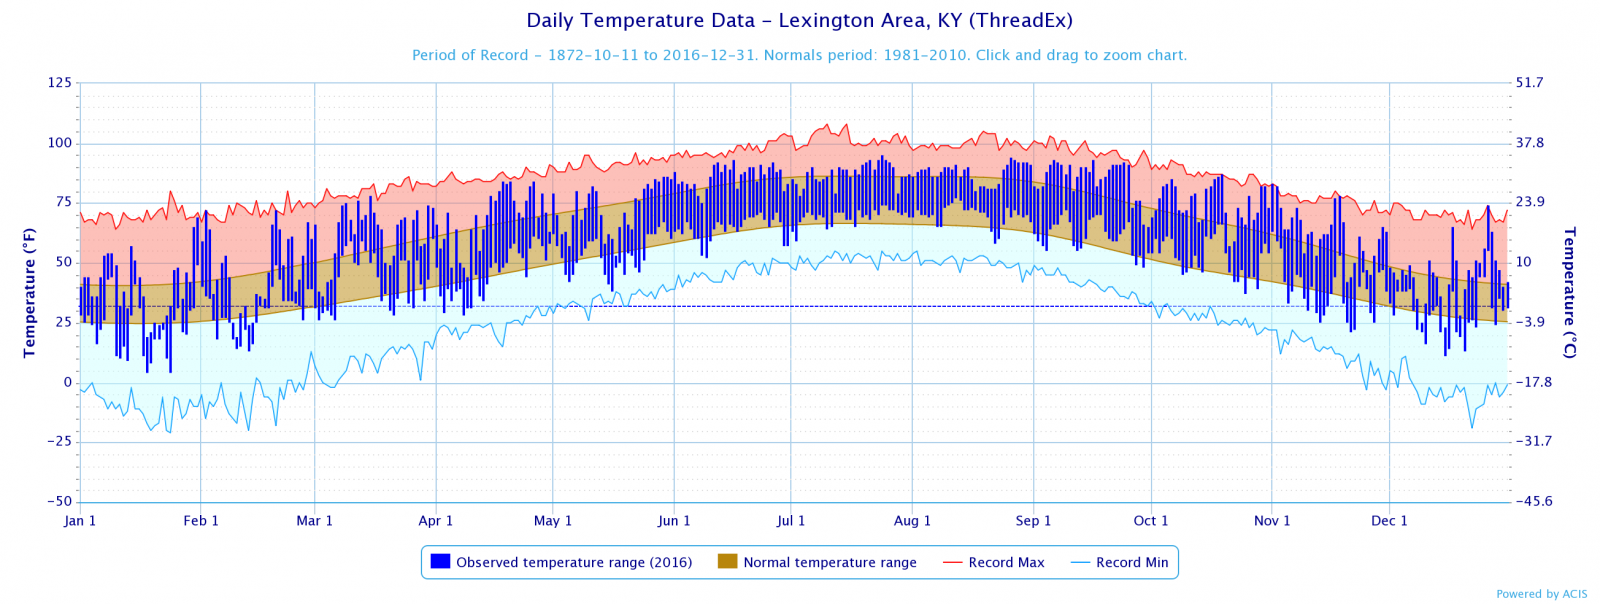
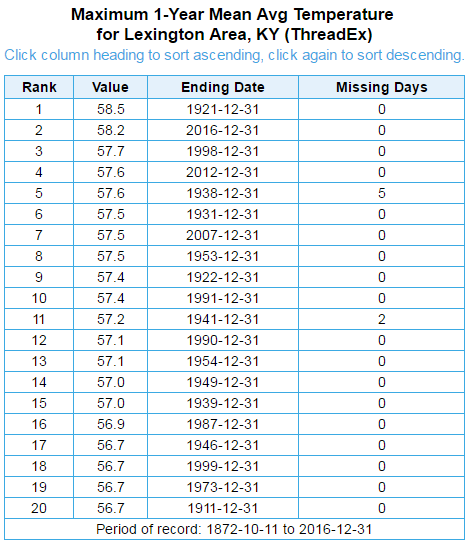
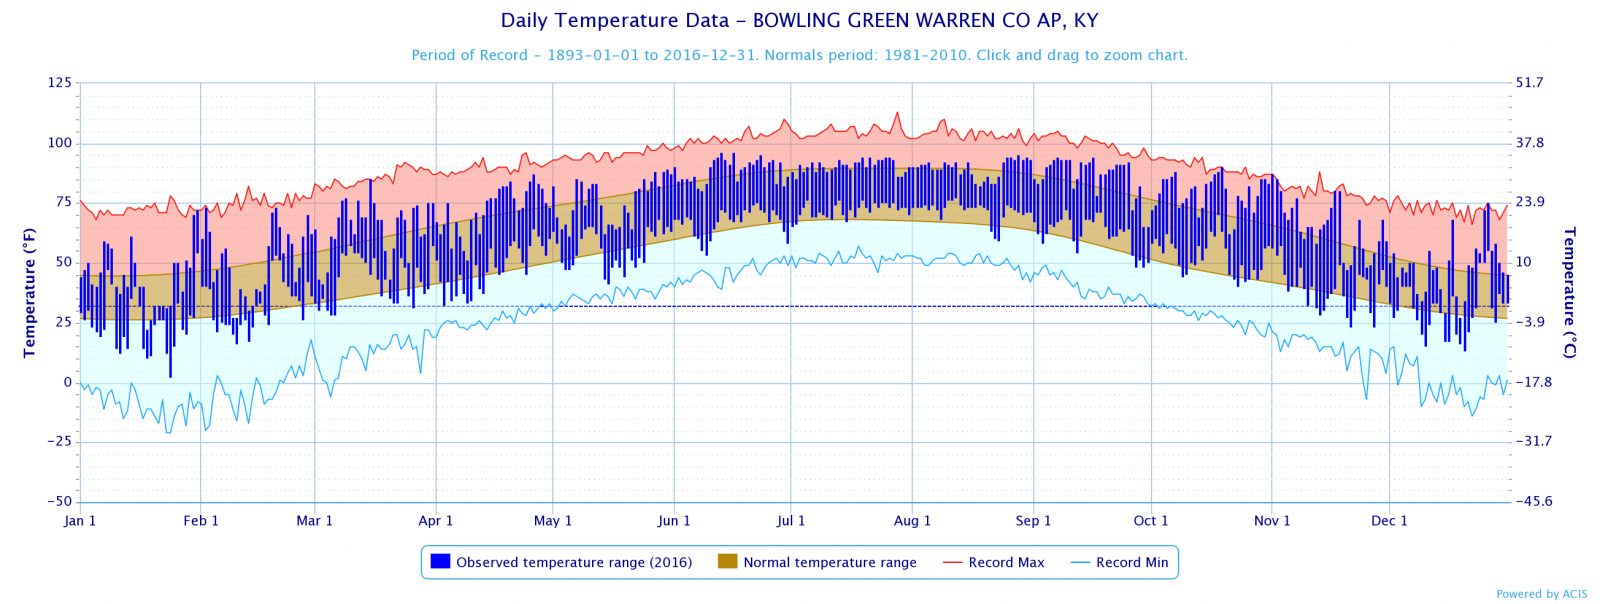
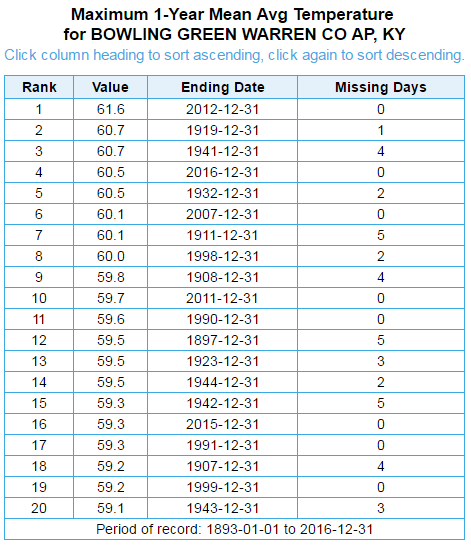
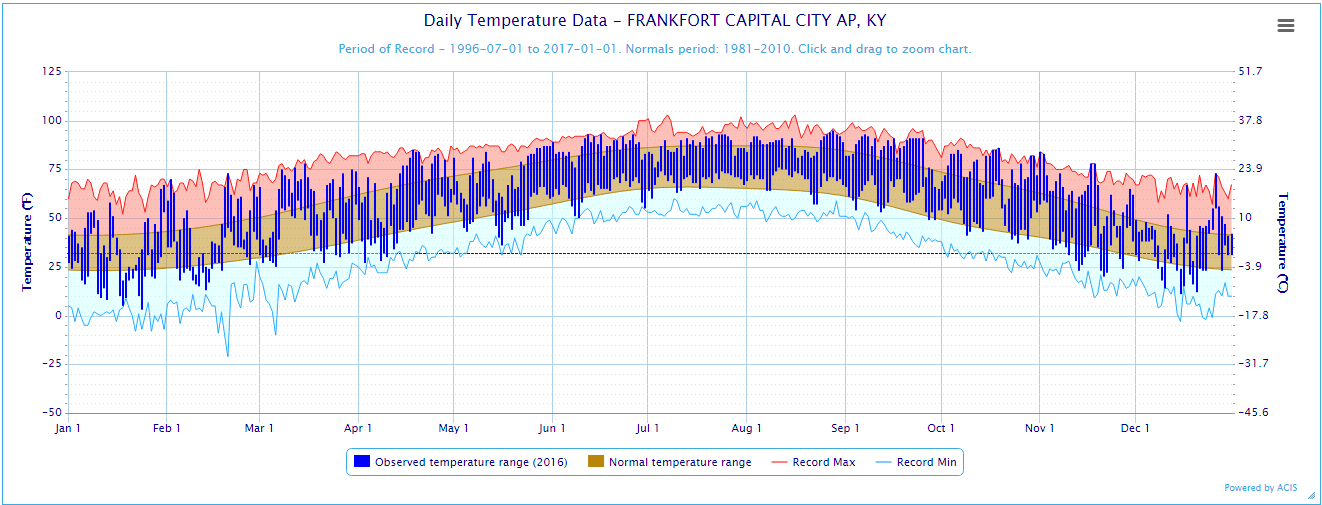
Despite no extreme heat issues during the summer, the year finished in the Top 4 warmest. There were numerous record high temperatures set: 10 at Louisville, 8 at Lexington, 7 at Bowling Green, and 5 at Frankfort - but other than the record high of 86° on April 19 in Louisville, all of the new records occurred in the cool seasons - before March 15 or after October 15.
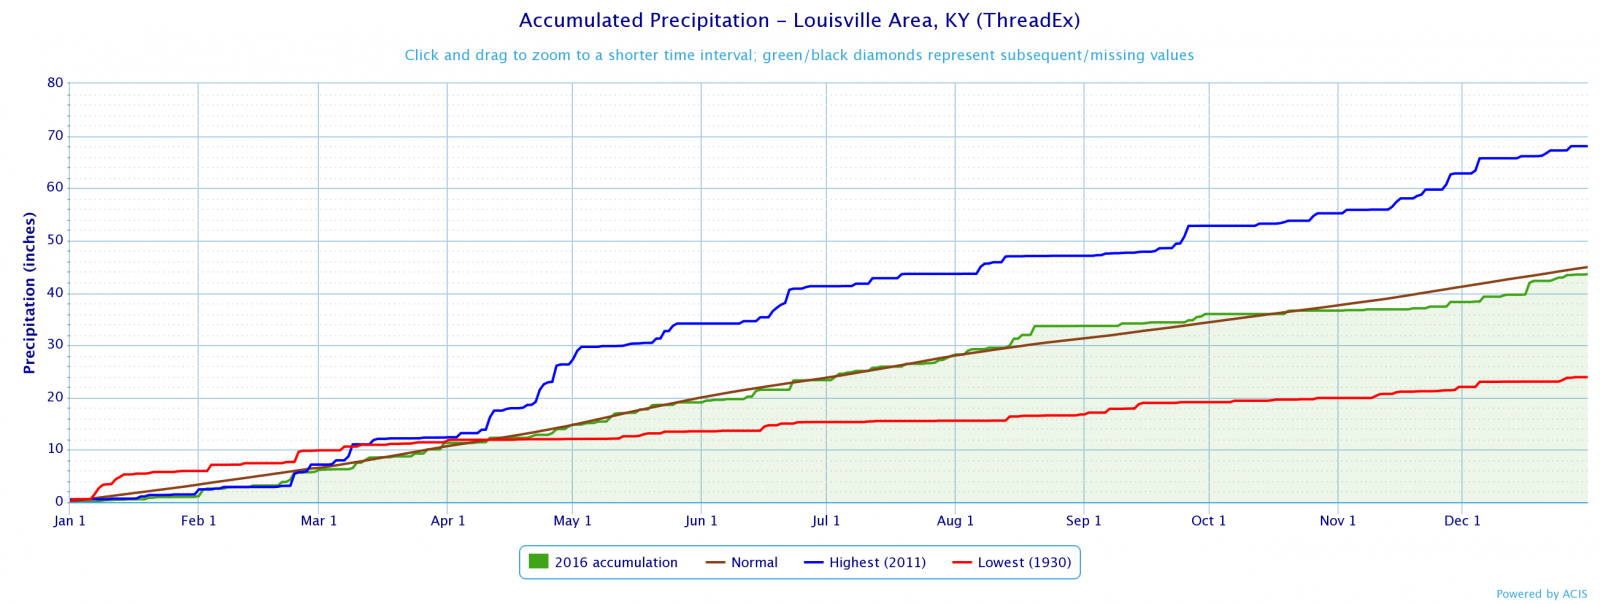
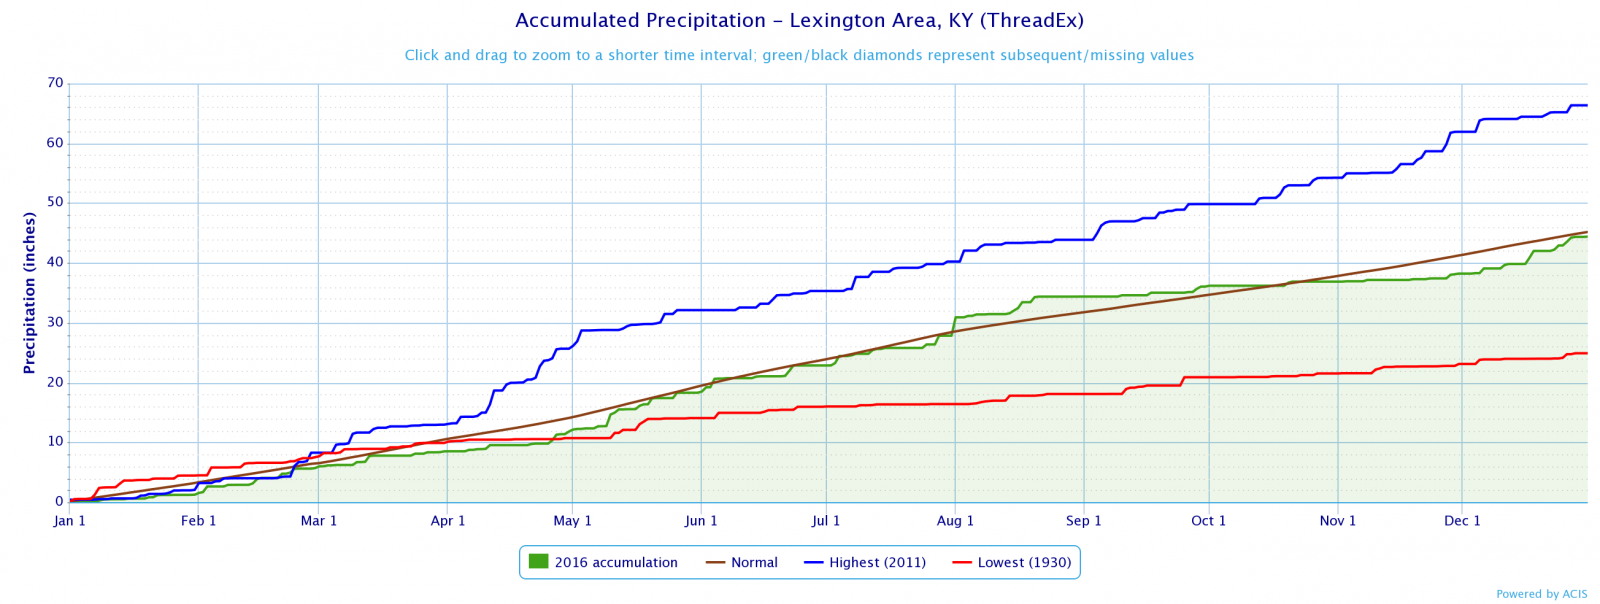
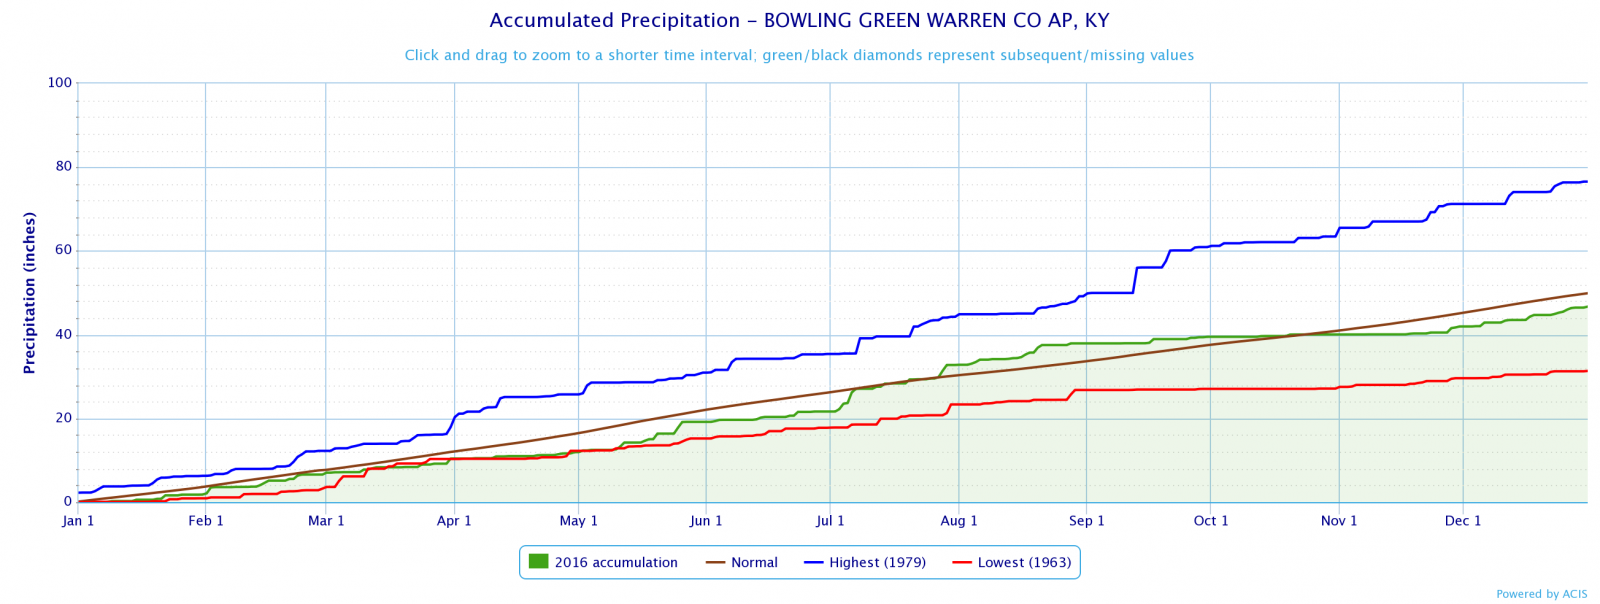
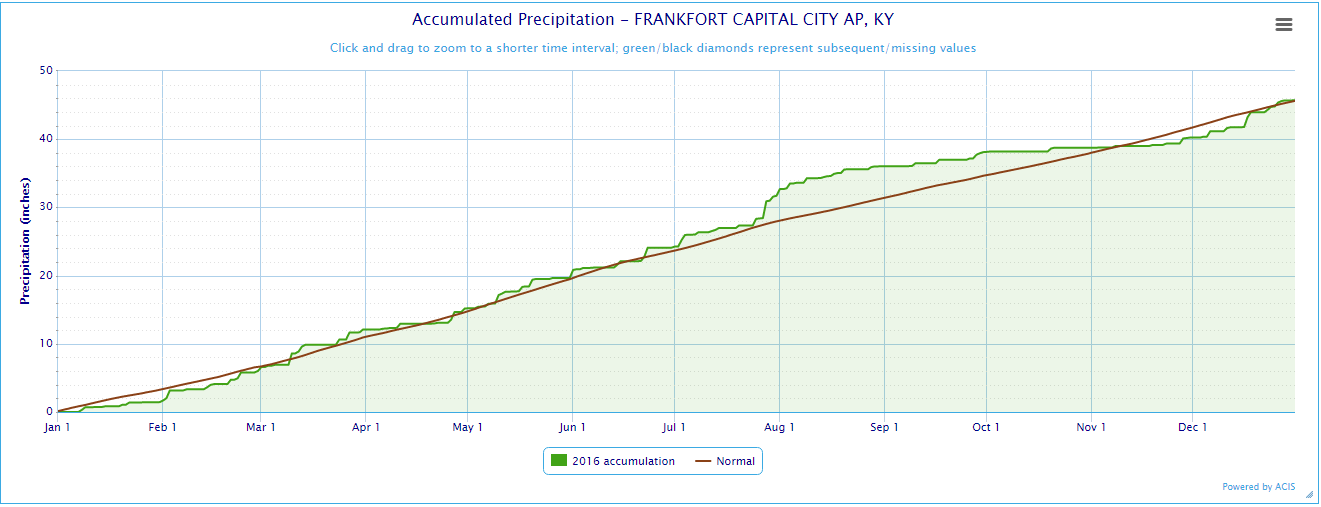
Precipitation-wise, despite an autumn drought, the year finished up very close to normal at both Louisville (-1.36" for the year) and Lexington (-0.78" for 2016), thanks to the soaking rains the last two weeks of December. Bowling Green, which didn't see as much rain to end the year, still managed to get within -3.04" of normal before the calendar changed. The late December rains resulted in all of Kentucky and southern Indiana being officially removed from drought status on December 27, as designated on the U.S. Drought Monitor.
LOUISVILLE INTERNATIONAL |
LOUISVILLE BOWMAN |
 *
*
| Month | Average Temperature | Precipitation | Snowfall |
| JAN | 31.8° | 1.24" | 9.6" |
| FEB | 38.2° | 4.46" | 5.0" |
| MAR | 52.1° | 2.79" | 0.7" |
| APR | 56.9° | 3.31" | T |
| MAY | 63.0° | 6.49" | 0 |
| JUN | 75.2° | 4.56" | 0 |
| JUL | 78.3° | 4.98" | 0 |
| AUG | 78.7° | 6.54" | 0 |
| SEP | 73.2° | 1.67" | 0 |
| OCT | 63.5° | 0.83" | 0 |
| NOV | 50.2° | 1.34" | 0 |
| DEC | 37.1° | 6.18" | 0.1" |
| AVG/TTL, Departure from Normal | 58.2°, +2.6° | 44.39", -0.78" | 15.4", +2.4" |
| Month | Average Temperature | Precipitation | Snowfall |
| JAN | 34.3° | 1.81" | 14.8" |
| FEB | 41.4° | 4.77" | 9.2" |
| MAR | 53.6° | 3.82" | T |
| APR | 60.0° | 1.53" | 0 |
| MAY | 65.7° | 7.24" | 0 |
| JUN | 77.8° | 2.47" | 0 |
| JUL | 81.1° | 11.12" | 0 |
| AUG | 80.5° | 5.16" | 0 |
| SEP | 74.2° | 1.57" | 0 |
| OCT | 65.8° | 0.56" | 0 |
| NOV | 51.9° | 1.91" | 0 |
| DEC | 39.1° | 5.64" | T |
| AVG/TTL, Departure from Normal | 60.5°, +2.5° | 47.60", -2.14" | 24.0", +15.1" |
| Month | Average Temperature | Precipitation |
| JAN | 31.5° | 1.45" |
| FEB | 38.0° | 4.57" |
| MAR | 51.6° | 6.08" |
| APR | 57.0° | 3.07" |
| MAY | 63.2° | 4.49" |
| JUN | 75.3° | 4.43" |
| JUL | 78.3° | 7.61" |
| AUG | 79.0° | 4.35" |
| SEP | 72.9° | 2.05" |
| OCT | 63.0° | 0.65" |
| NOV | 49.4° | 1.49" |
| DEC | 36.6° | 5.47" |
| AVG/TTL, Departure from Normal | 58.0°, +2.7° | 45.71", +0.09" |
*At Louisville International the value in the top ten list varies slightly from the value in the table above it due to a slight difference in the way the software that was used for the top ten list makes its calculations.


 Weather Story
 Weather Map
 Local Radar