Overview
|
On the evening of May 16th, 2025, supercells developed over central Missouri and tracked through Kentucky. These storms eventually grew upscale into a QLCS. Both supercells and the QLCS brought tornadoes, wind damage including a maximum wind speed of 82 mph at the Louisville Airport and very large hail. |
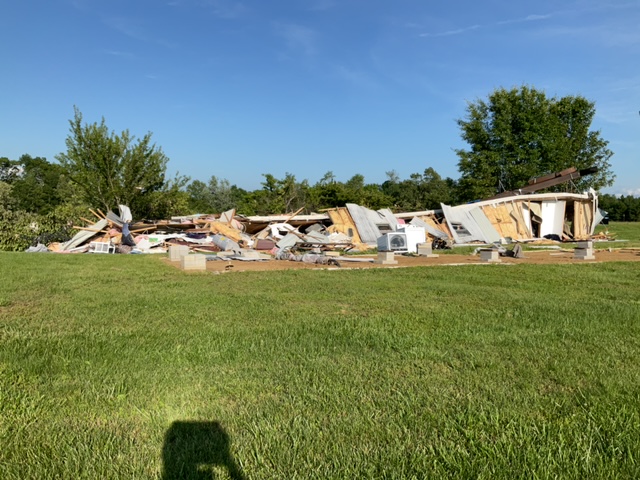 EF3 Tornado Damage in Russell County |
Tornadoes
Select a tornado from the table to zoom into the track and view more information. The default table view is limited to 8 tracks, but can be scrolled by a mouse wheel or dynamically expanded. Additionally, the table can fill the entire window by clicking the small circular expanding arrow icon at the very top right of the table and returned to its original size by clicking the button again. The side information panel that opens over the map can be closed using the "X" on the upper right corner of the pop-up. Zoom into the map and click damage points to see detailed information and pictures from the surveys.
|
NOTE: times shown below are local to your device's time zone. |

The Enhanced Fujita (EF) Scale classifies tornadoes into the following categories:
| EF0 Weak 65-85 mph |
EF1 Moderate 86-110 mph |
EF2 Significant 111-135 mph |
EF3 Severe 136-165 mph |
EF4 Extreme 166-200 mph |
EF5 Catastrophic 200+ mph |
 |
|||||
| Tornadoes that fail to impact any ratable structures on the EF-Scale are rated EF-Unknown (EF-U) | |||||
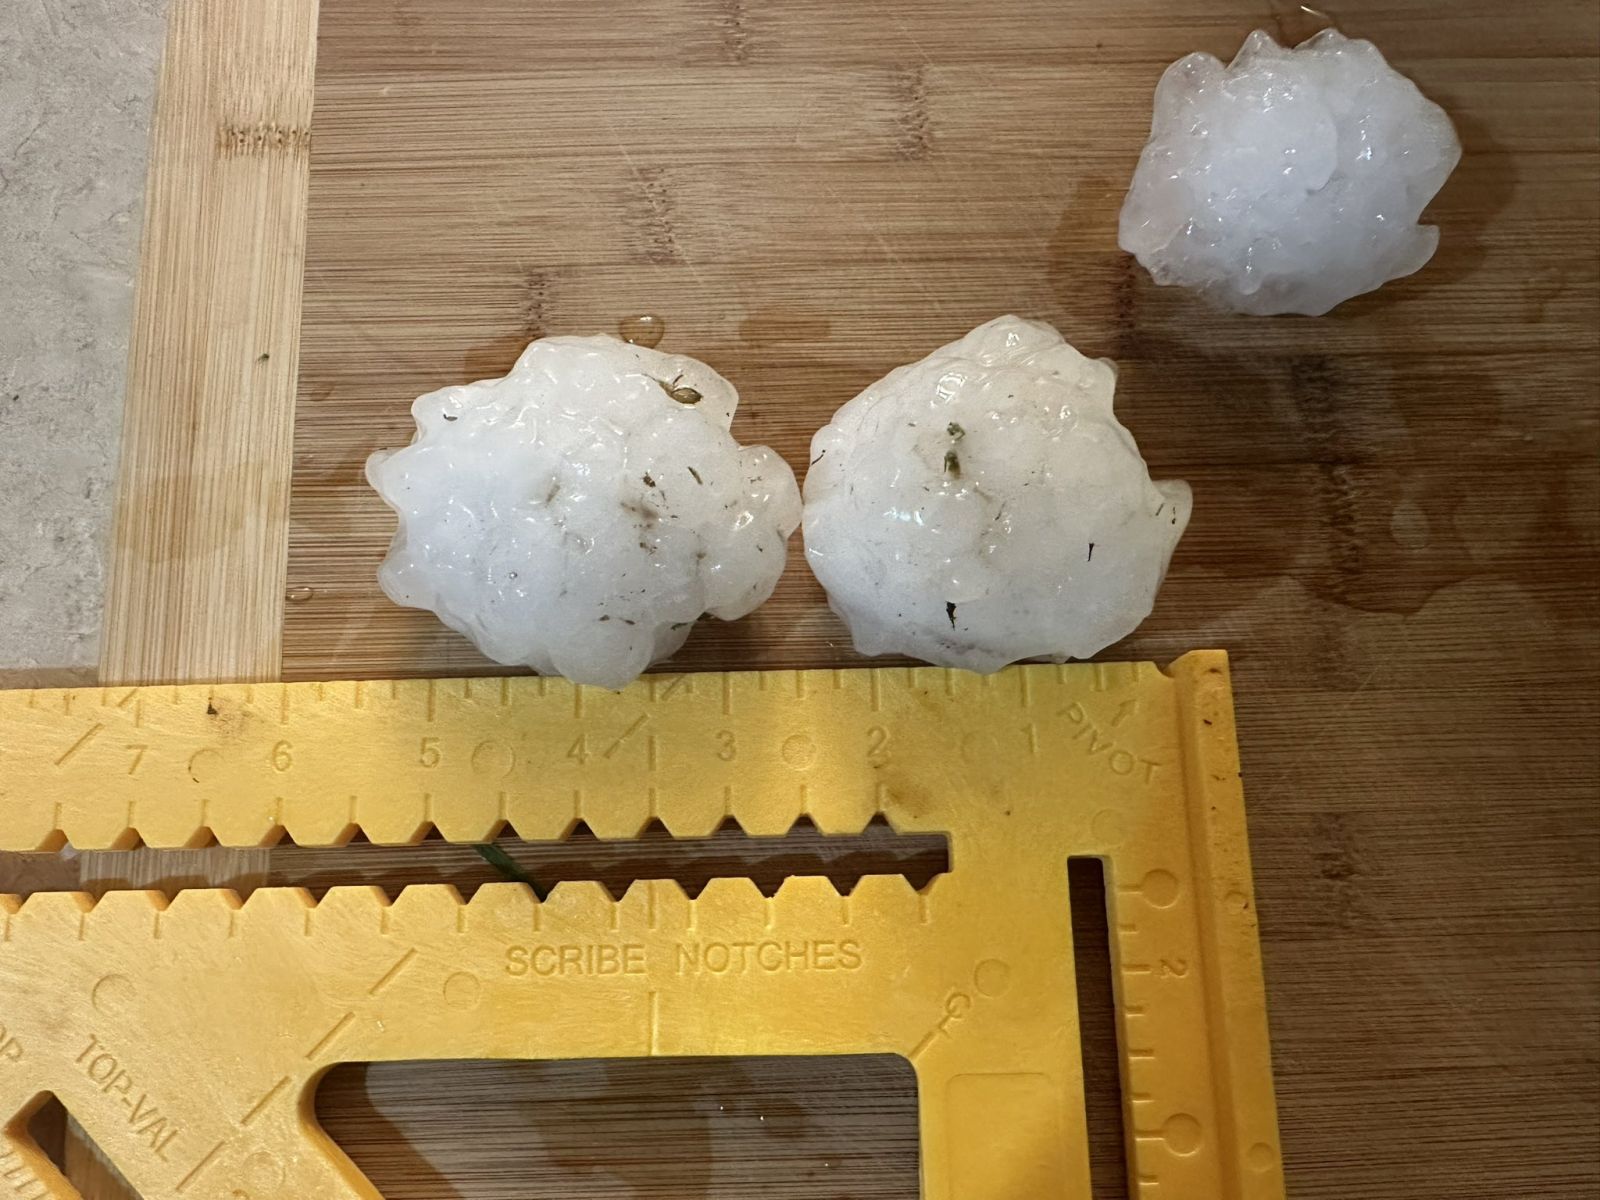
Hail
A supercell moving across the entire state of Kentucky brought up to 3 inch hail.
 |
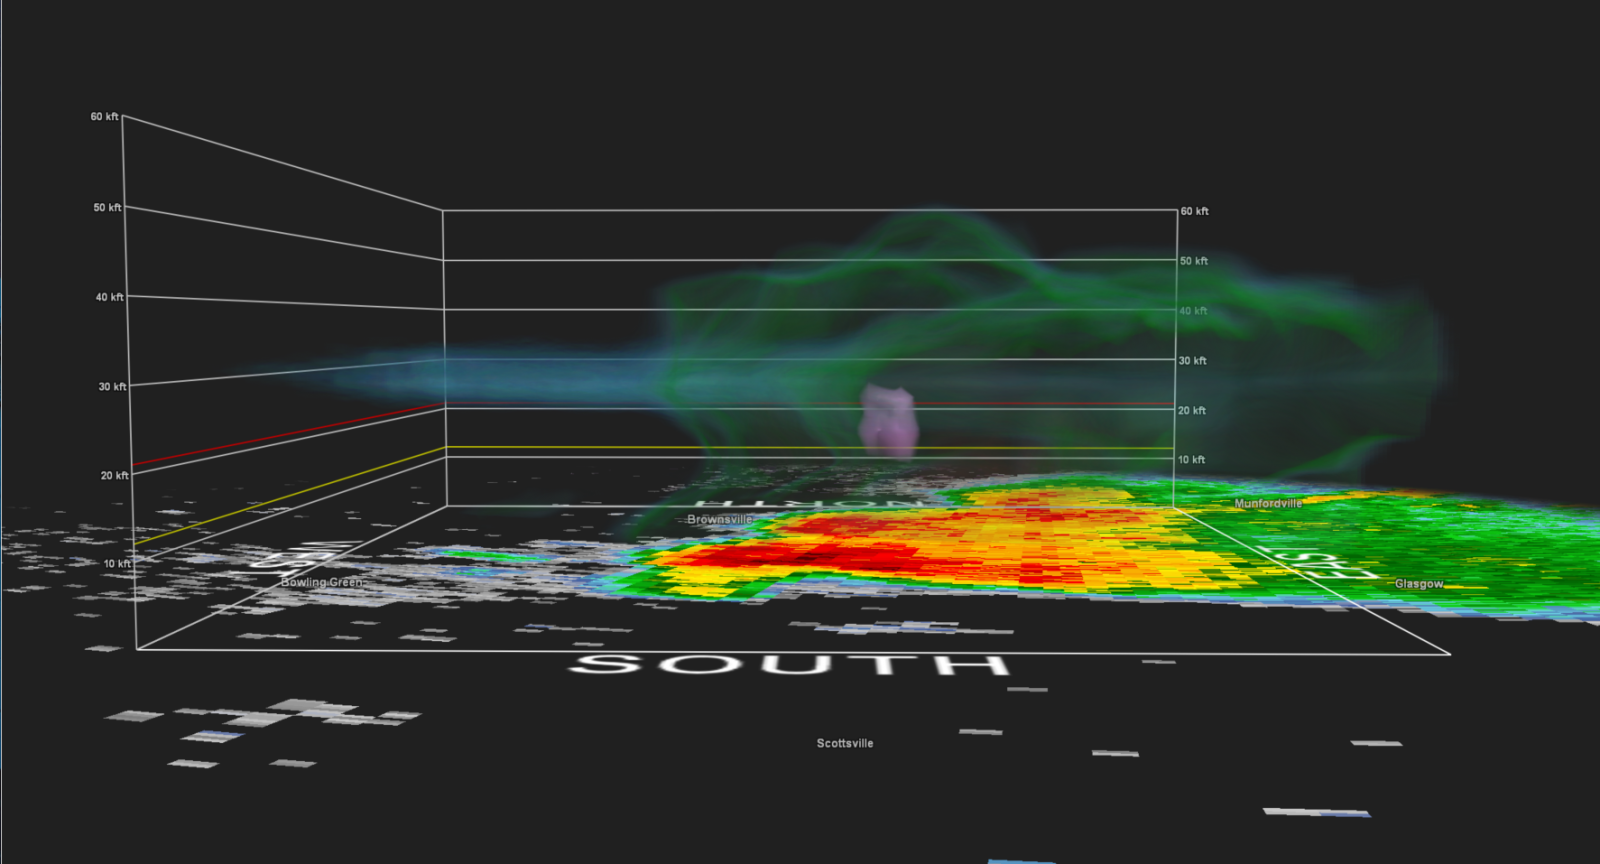 |
| 2-3 inch hail in Plum Springs, KY (Photo by Jacob Wilkins) | 3-D view of the storm in Warren county with the very large hail core suspended aloft |
Storm Reports
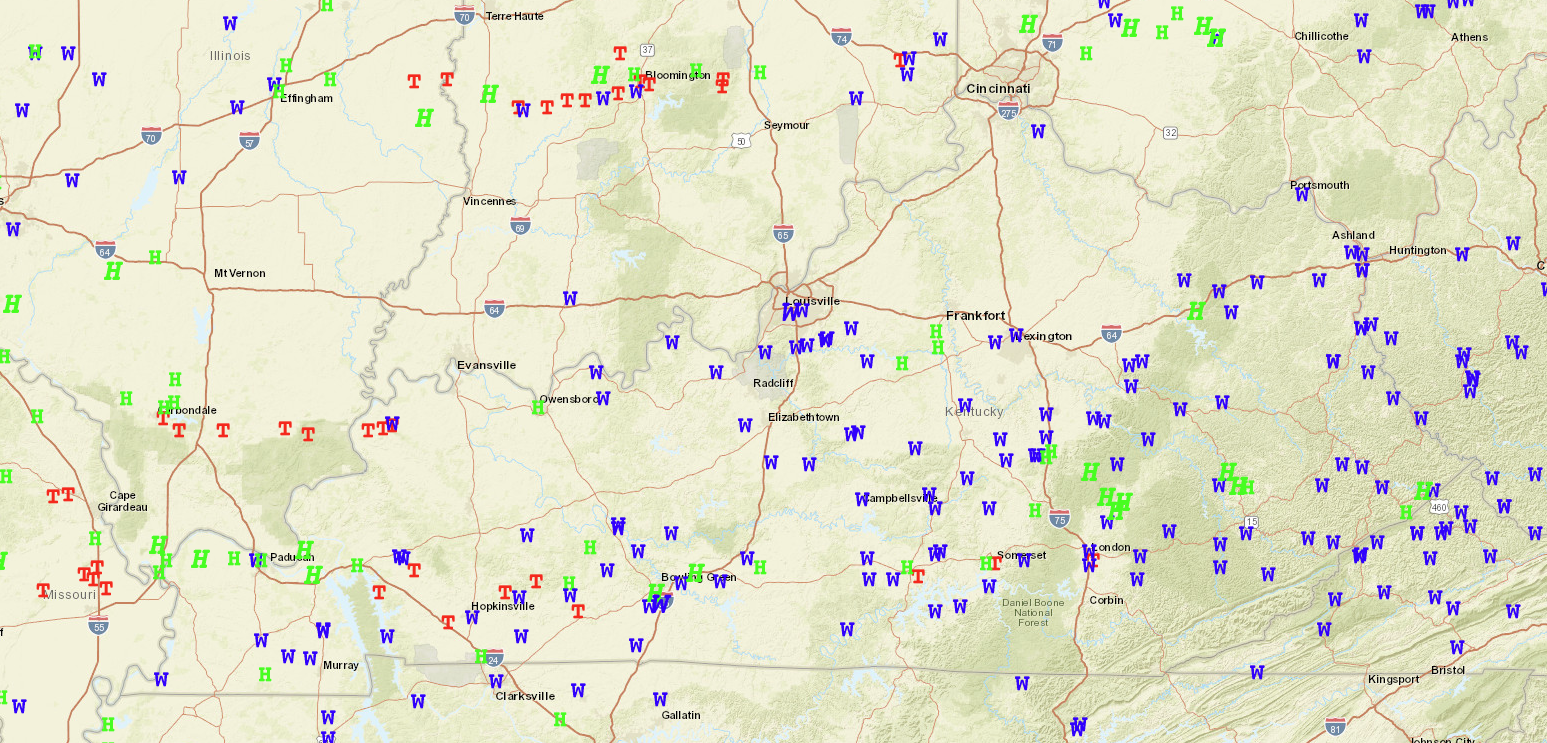 |
| Note: Wind Reports are indicated by a blue W (70+ mph wind - italicized), Hail Reports are indicated by a green H (2+ inch diameter hail - italicized), Tornado Reports are indicated by a red T |
Rain Reports
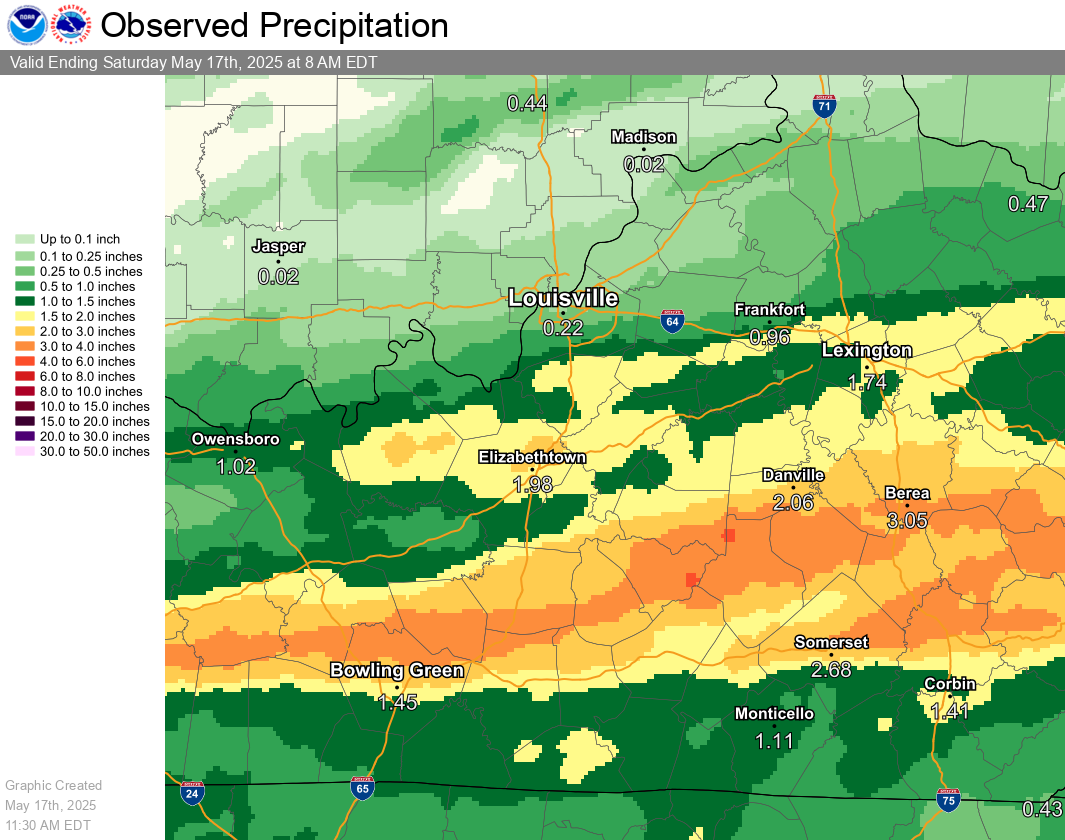
Southern Kentucky measured 3 to 4 inches of rainfall from this event which lead to minor flooding along the Green River.
 |
Radar
 |
 |
 |
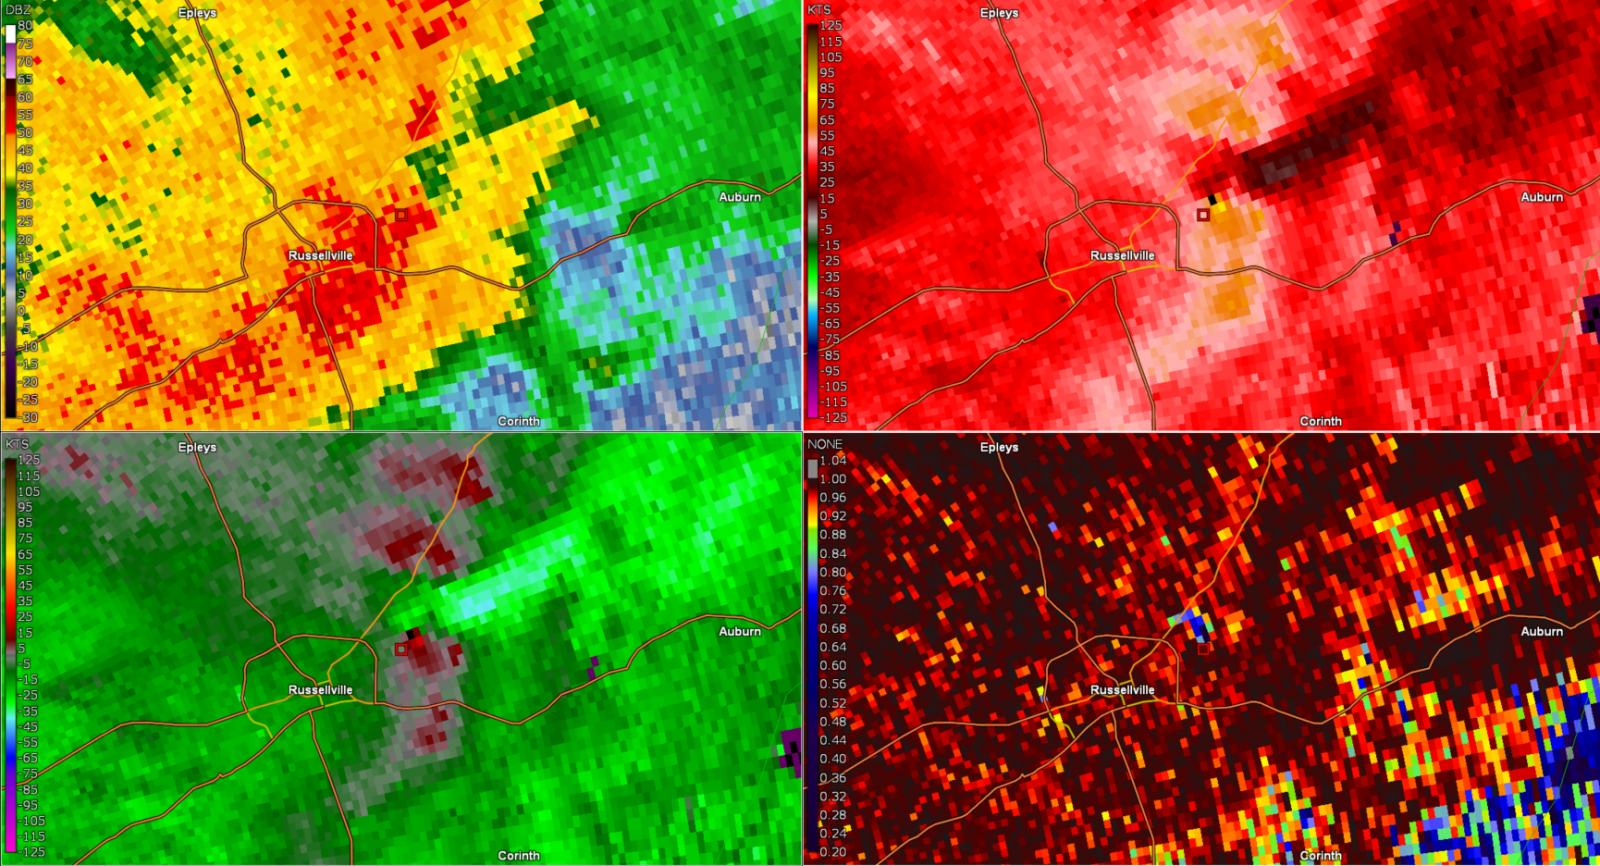 |
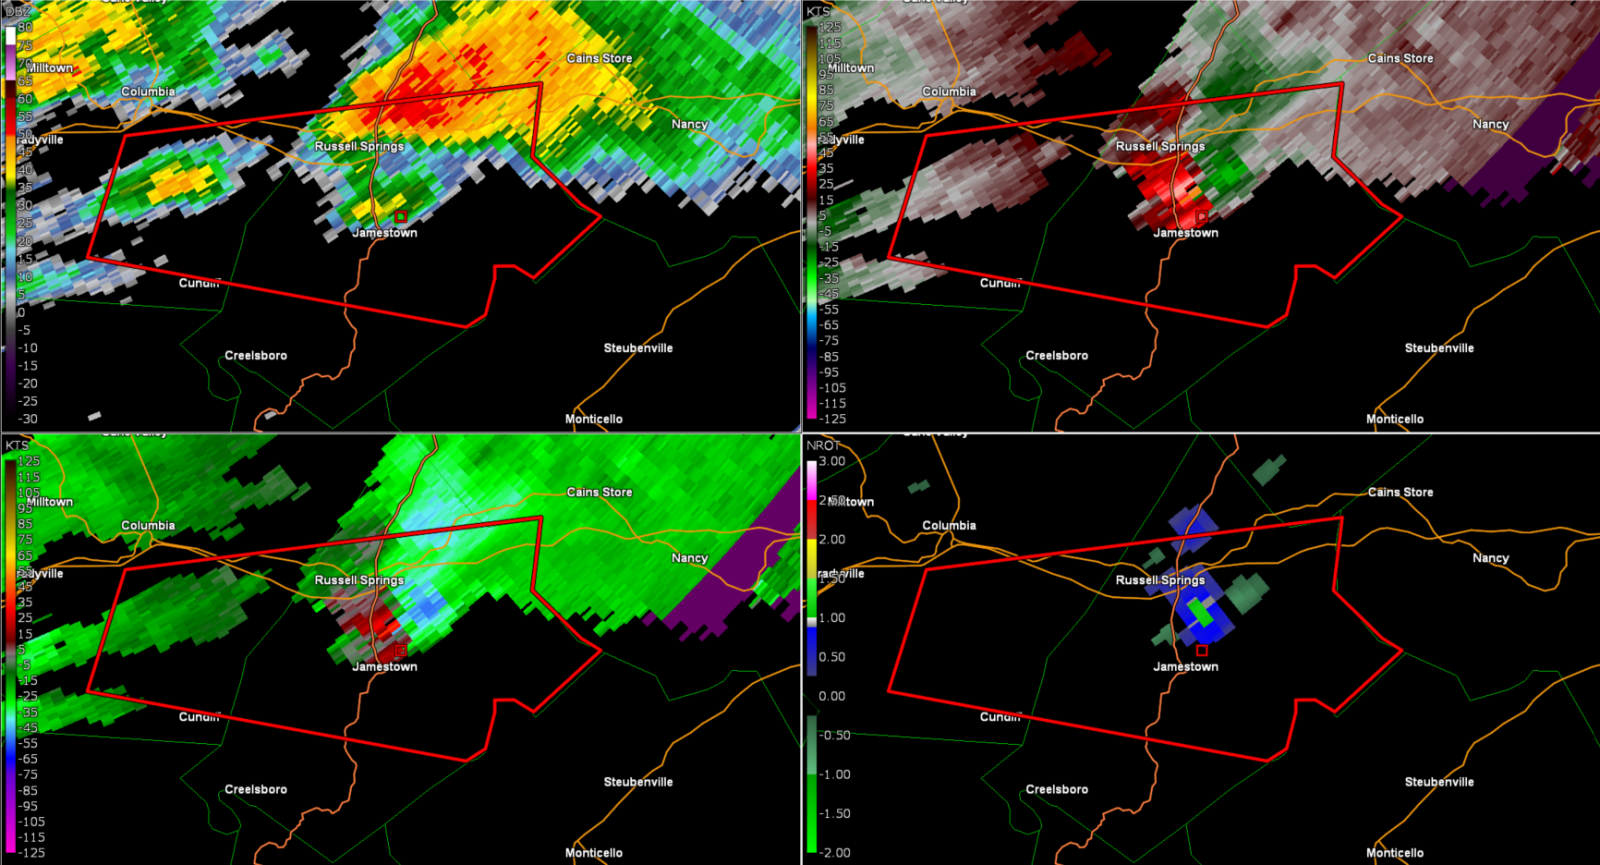
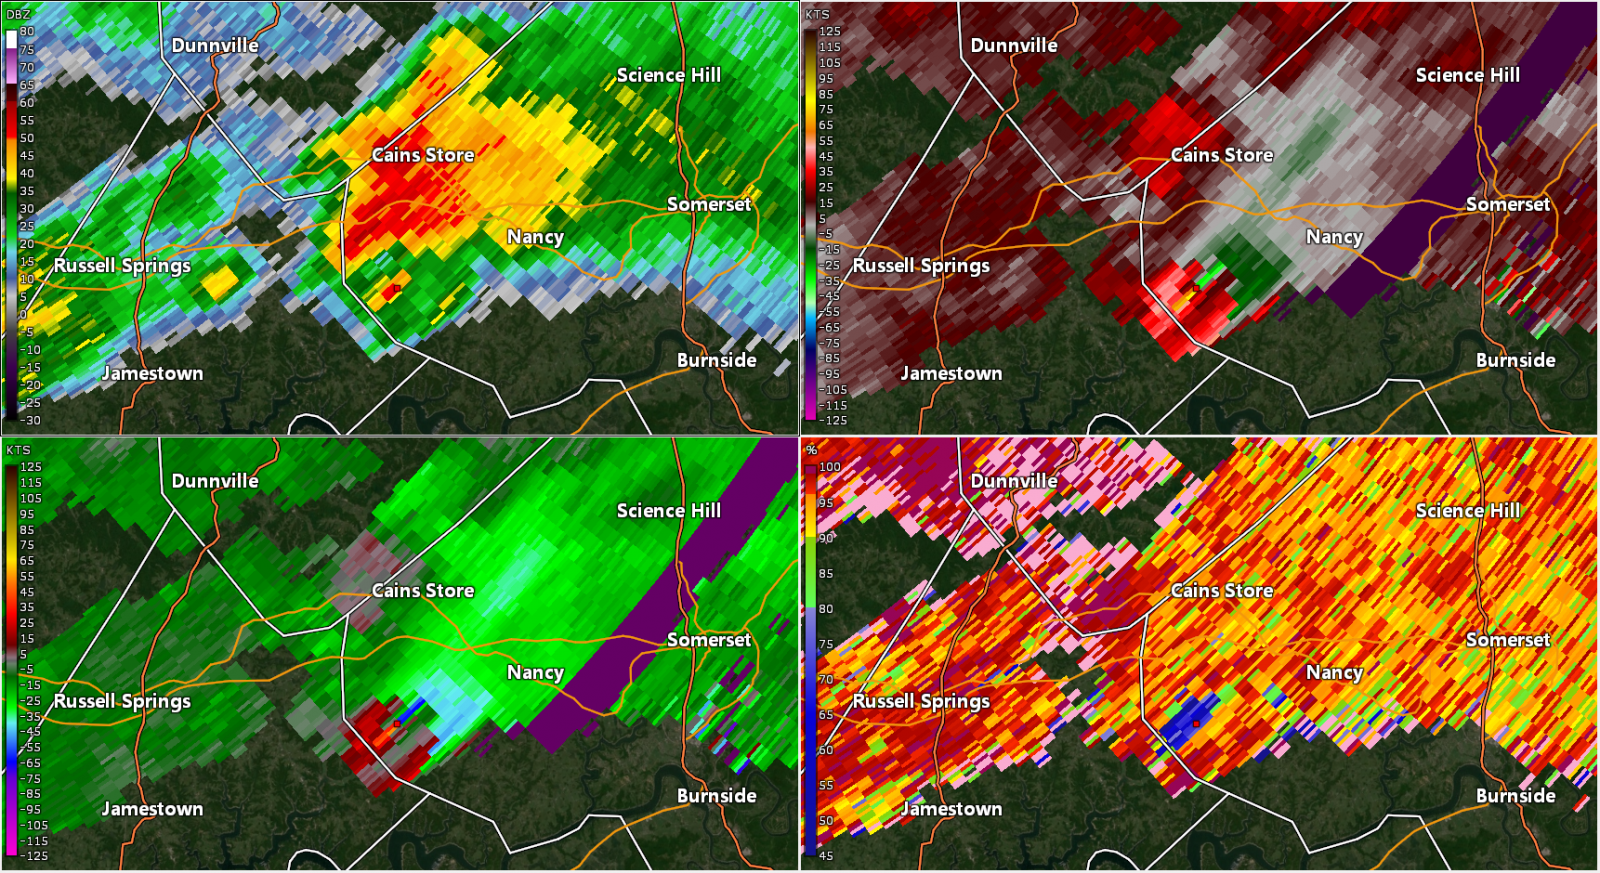
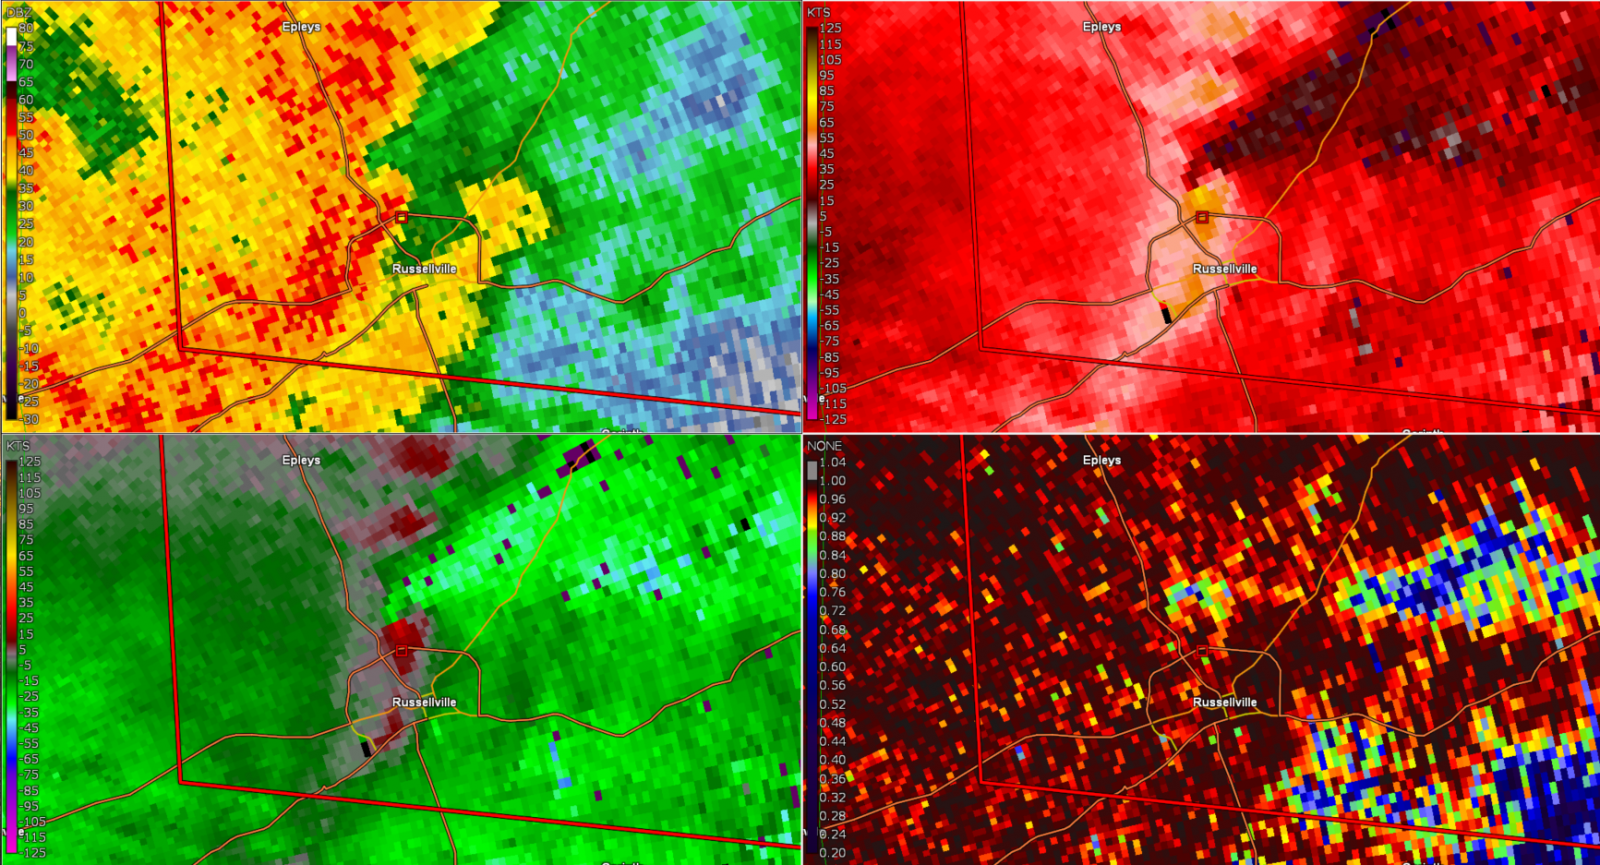
| KLVX: 1025 PM EDT Tornado has recently touched down in Russell county, KY and will quickly strengthen to EF-3 strength near the Eli community. | KLVX: 1040 PM EDT The tornado has just passed over the Gosser Ridge area near the Russell/Pulaski Co line, producing EF-3 damage. You can see the TDS in the Correlation Coefficient product. | KHPX: 1055 PM EDT Tornado EF-1 tornado is touching down just north of Russellville with reflectivity showing a front end nub coincident with a "gate to gate" velocity couplet. | KHPX: 1058 PM EDT The tornado continues ESE and starts to pick up debris as seen in the bottom right panel Correlation Coefficient product. This is known as a TDS signature. |
Environment
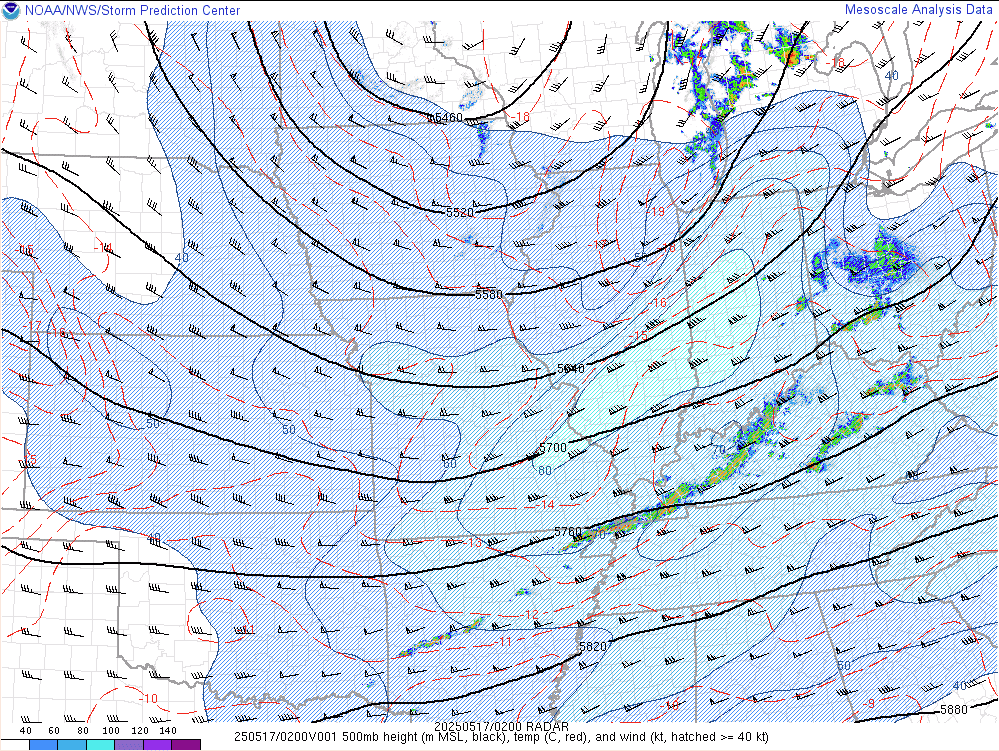
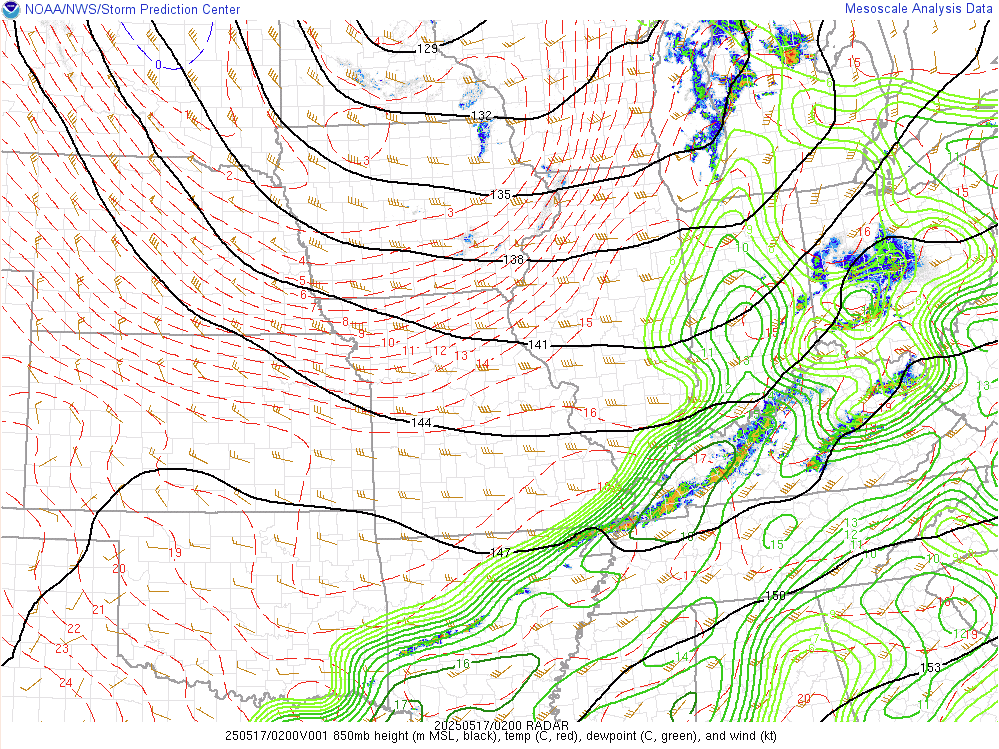
A deep, closed upper low moved across the northern Plains and upper Midwest May 16th into the 17th. Across the Ohio Valley, a strong gradient in mid- and upper-level heights resulted in unusually strong west-southwesterly mid- and upper-level flow for mid-May, with an 80+ kt mid-level jet located just northwest of the region. 40-45 kt of southwesterly flow via a low-level jet brought ample low-level moisture into the region, along with providing extra wind shear in the low levels of the atmosphere. This strongly sheared setup interacted with a pre-existing air mass which was quite unstable, as temperatures were in the upper 70s and lower 80s with dewpoint temperatures in the upper 60s and lower 70s on Friday. This combination of shear and instability provided a prime setup for severe weather. The trigger for the severe weather event across the Ohio and Tennessee valleys was a cold front which pushed from the Mississippi Valley across Kentucky and Indiana during the evening and early overnight hours on May 16th-17th. Scattered supercells across Missouri, Arkansas, and Illinois eventually merged into a severe quasi-linear convective system which brought spin-up tornadoes and damaging straight-line winds. A few leading supercells were able to remain ahead of the main line of storms; these supercells produced extremely large hail (up to 4 inches in diameter) and long-track, violent tornadoes, including the tornado which impacted Russell, Pulaski, and Laurel County, Kentucky.
 |
 |
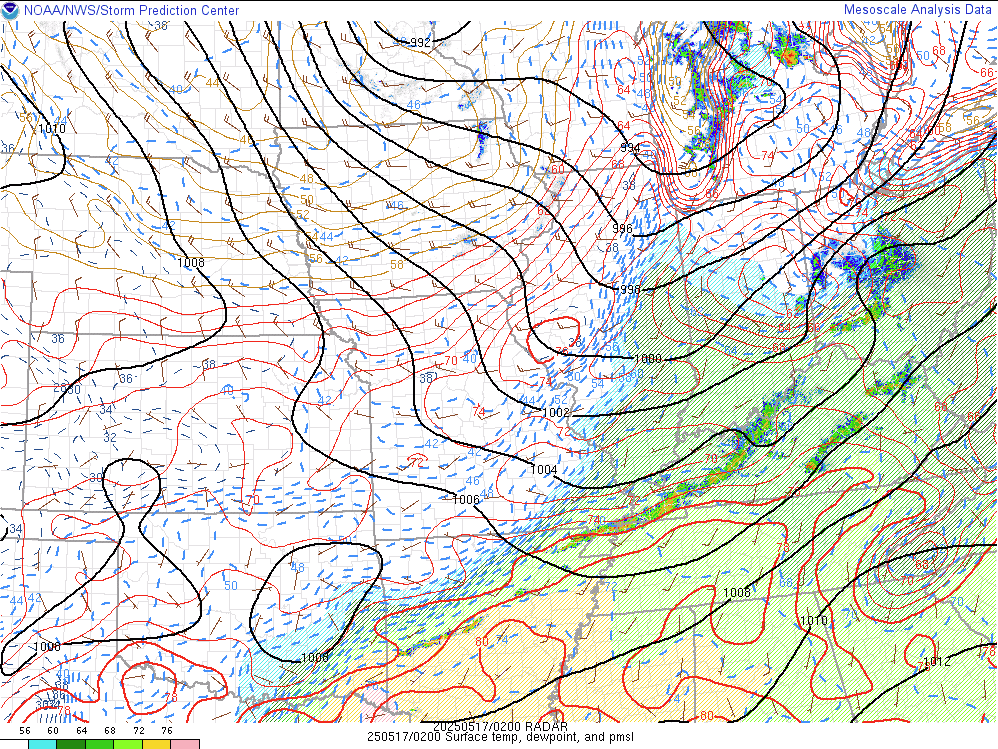 |
| Figure 1: 500 mb Heights and Winds, Regional Radar Mosaic at 10 PM EDT 5/16/25 | Figure 2: 850 mb Heights, Winds, Temperatures, and Dewpoints, Regional Radar Mosaic at 10 PM EDT 5/16/25 | Figure 3: Mean Sea Level Pressure, Surface Temperatures and Dewpoints, Regional Radar Mosaic at 10 PM EDT 5/16/25 |
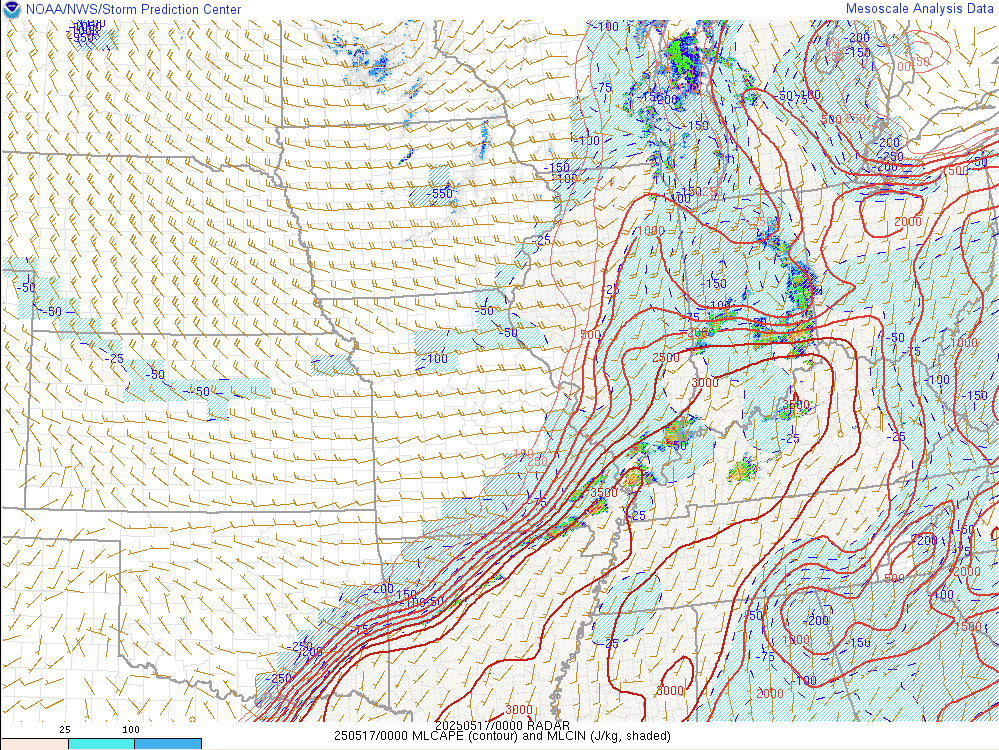
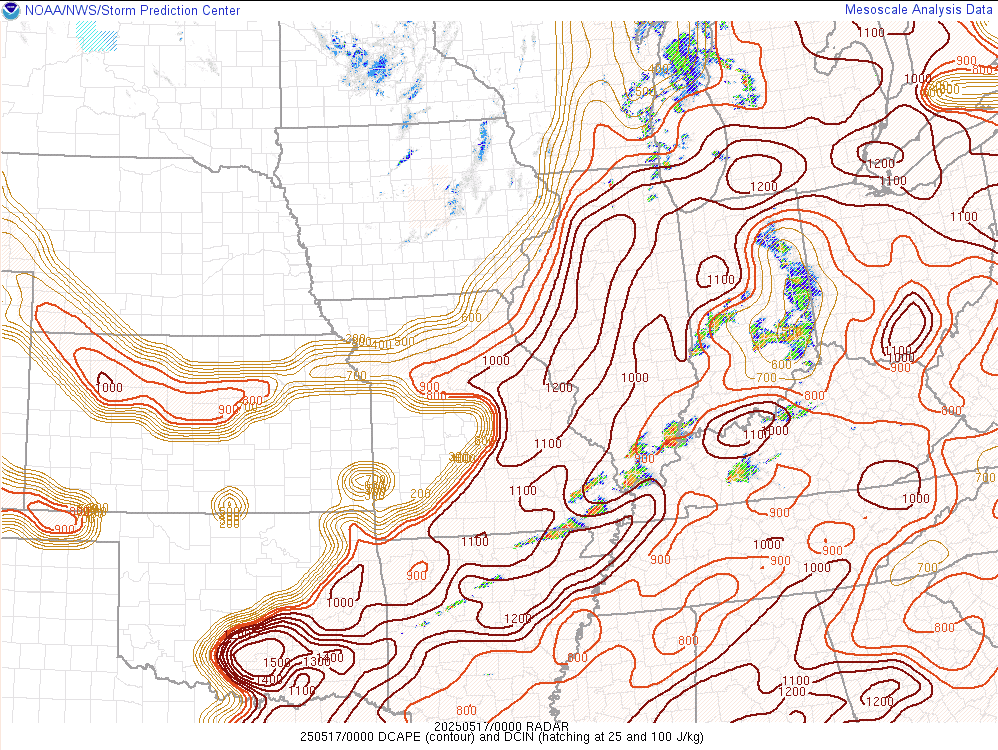
The environment which the storms moved into during the afternoon and evening hours on May 16th was highly unstable, with 2500-3500 J/kg of Mixed-Layer CAPE present across southern Indiana and central Kentucky. Downdraft CAPE values of 800-1200 J/kg were sufficient to bring down severe wind gusts, even in weak convection as negatively buoyant air parcels brought strong winds from aloft down to the surface. Usually, high DCAPE values would also suggest high LCL heights, and while LCLs for this event were not particularly low (generally around 1000 m), they were low enough to sustain low-level mesocyclones in the strongest supercells. It is possible that marginal LCL heights were partially responsible for keeping the southern Kentucky supercell from being even more prolific at producing tornadoes than they were.
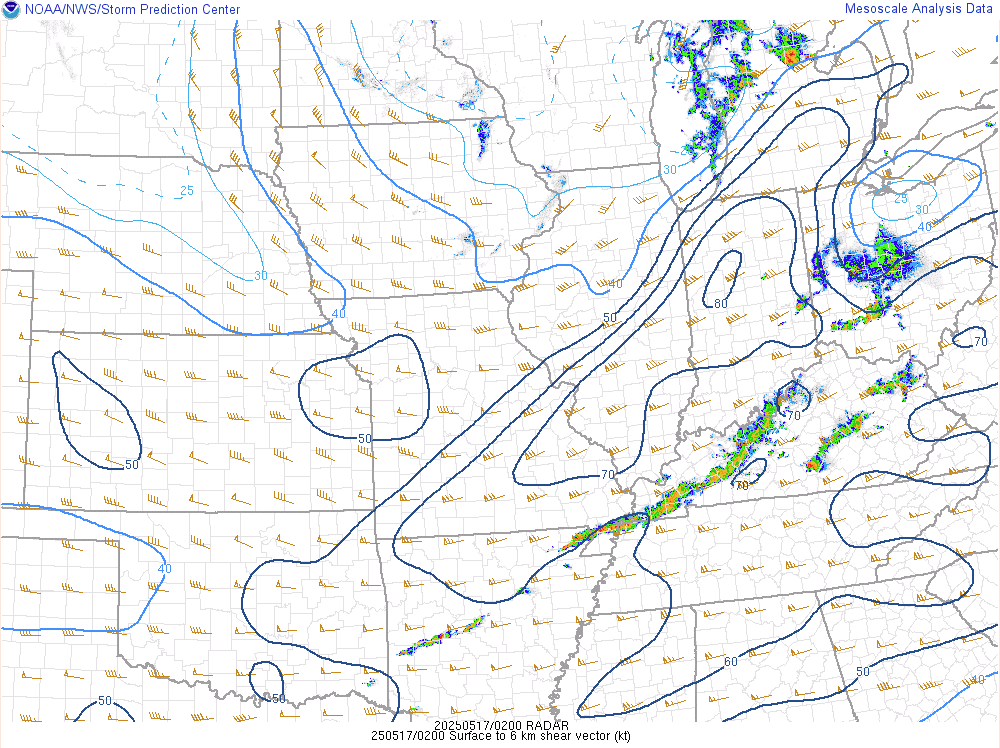
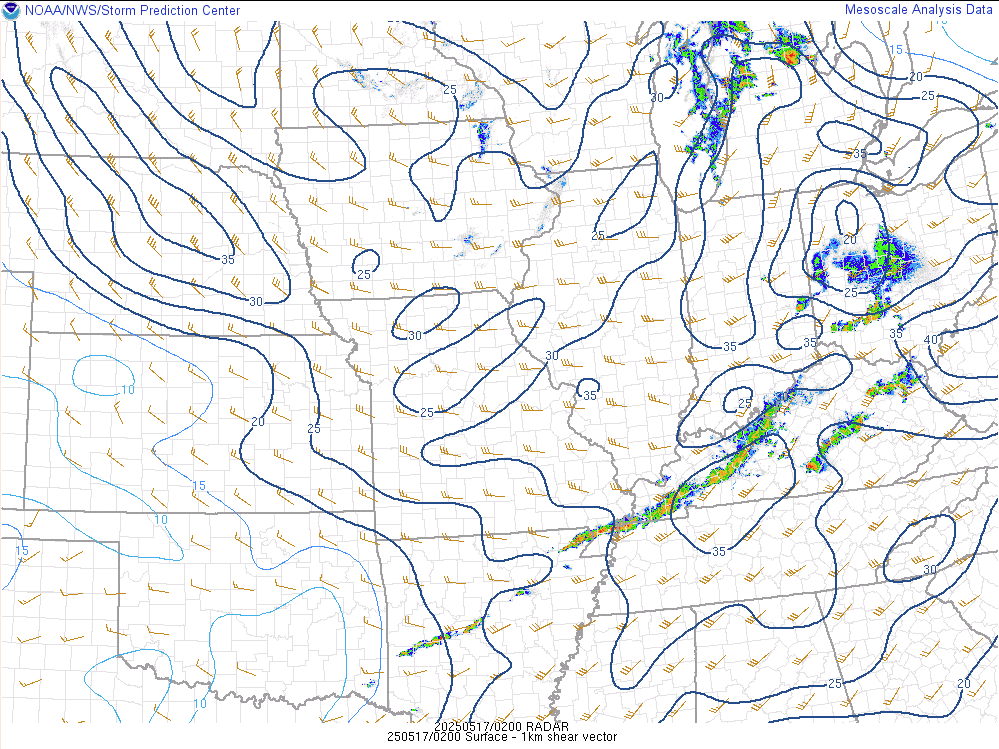
Given the amount of instability present, the wind shear parameters for this event allowed for the high-end severe threat which was realized. Deep-layer shear (0 to 6 km) on the order of 60 to 70 knots was observed; these values would be more typical for a late February or early March severe weather event with much less instability. 35 knots of 0 to 1 km shear and nearly 300 m2/s2 of surface to 500 m storm-relative helicity indicated that the low-level wind profile was supportive for mesovortexgenesis and tornadogenesis.
 |
 |
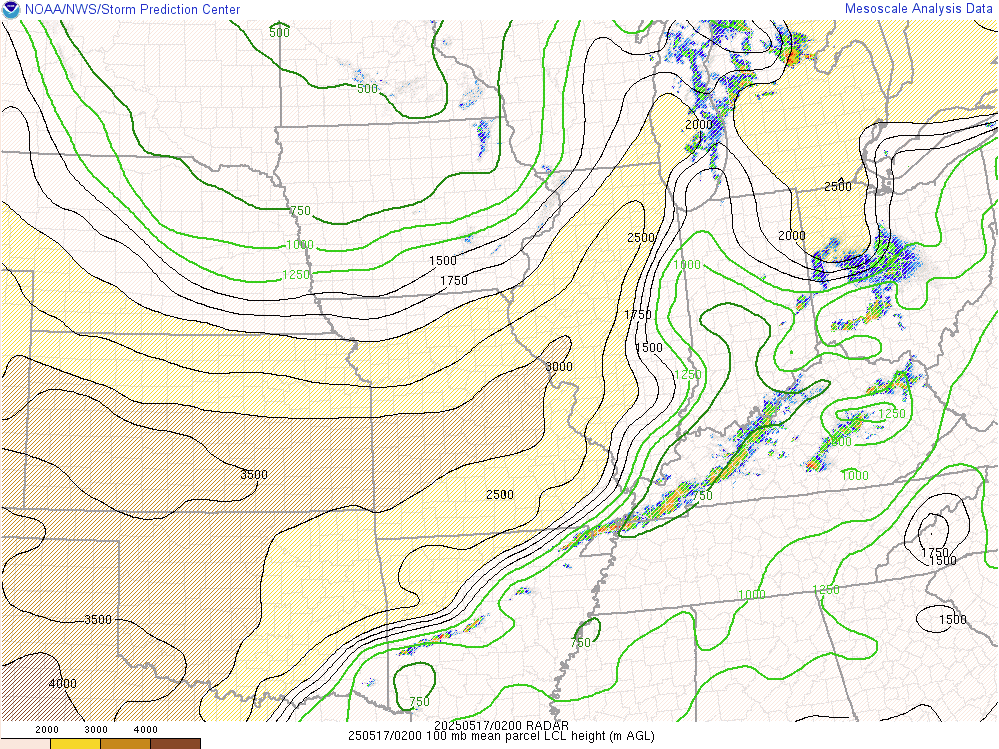 |
| Figure 4: Mixed Layer CAPE (contour) and CIN (shaded) at 8 PM EDT 5/16/25 | Figure 5: Downdraft CAPE (contour) at 8 PM EDT 5/16/25 | Figure 6: LCL Heights at 10 PM EDT 5/16/25 |
 |
 |
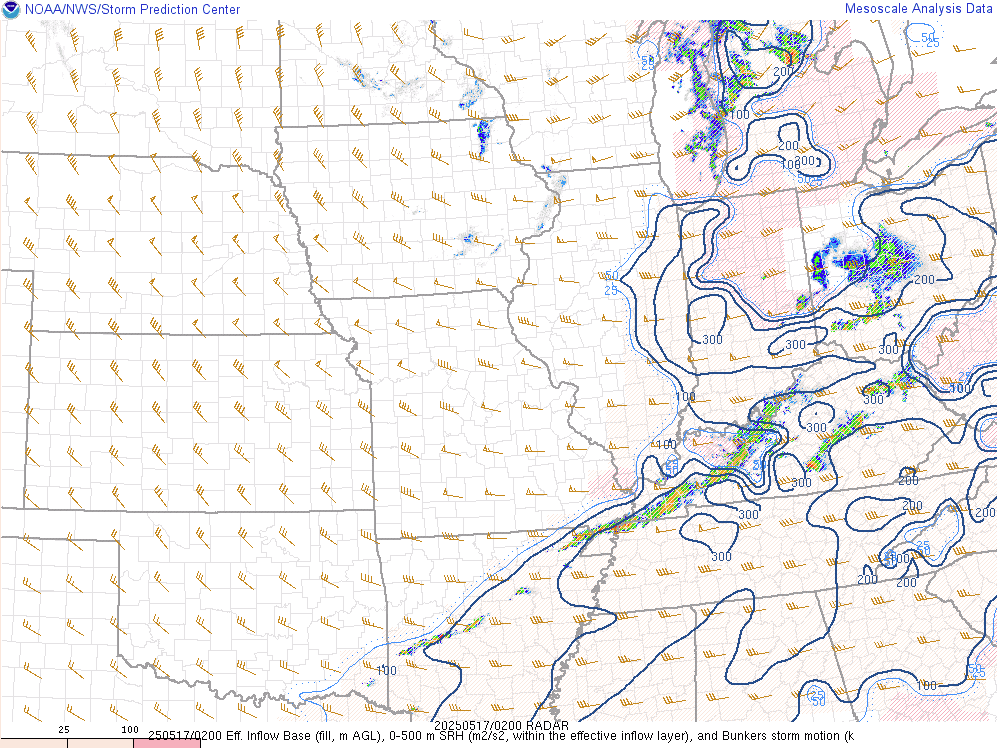 |
| Figure 7: 0-6 km Wind Shear at 10 PM EDT 5/16/25 | Figure 8: 0-1 km Wind Shear at 10 PM EDT 5/16/25 | Figure 9: 0-500 m Storm-Relative Helicity at 10 PM EDT 5/16/25 |
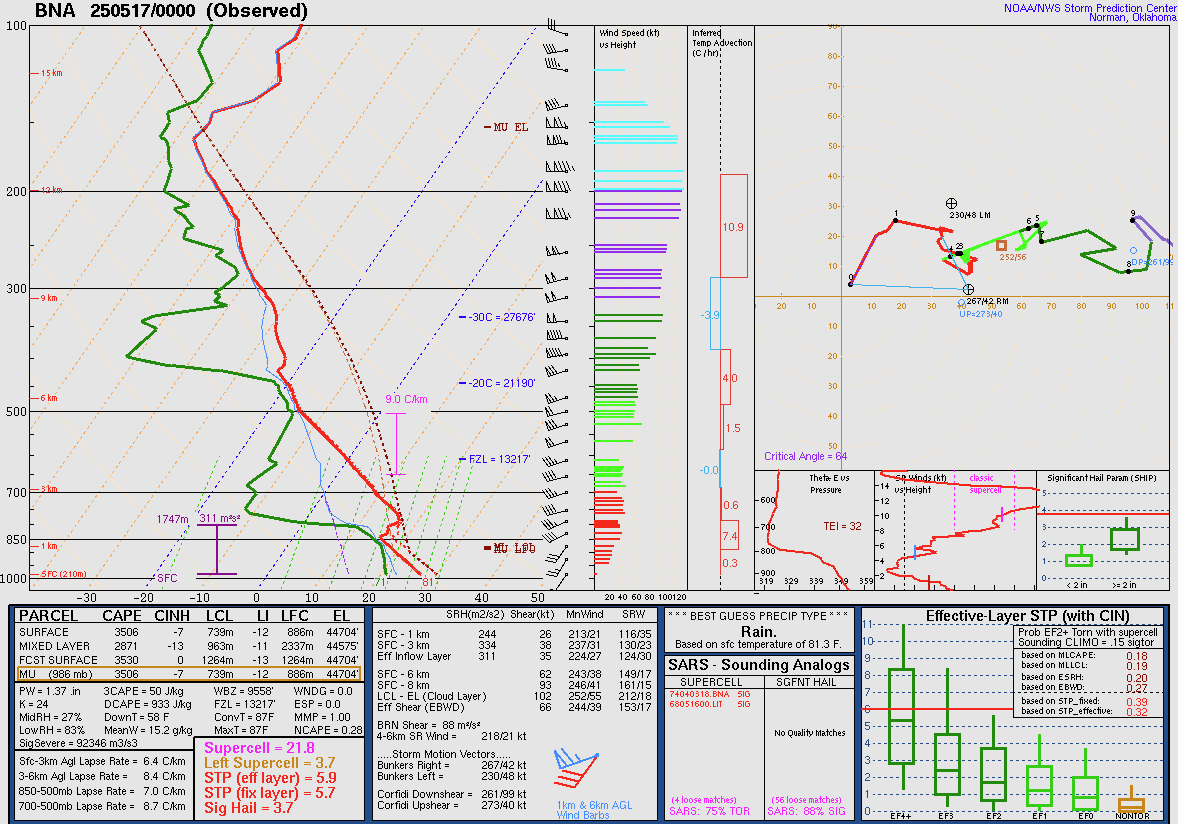
One unique feature of this severe weather event was the presence of a well-defined elevated mixed layer (EML), which can be seen in the sounding data in Figure 10. The EML is a layer of air with steep temperature decreases with increasing heights, and is also very dry. It also allows for high amounts of instability and favorable conditions for explosive thunderstorm growth, which can lead to large hail and damaging winds.
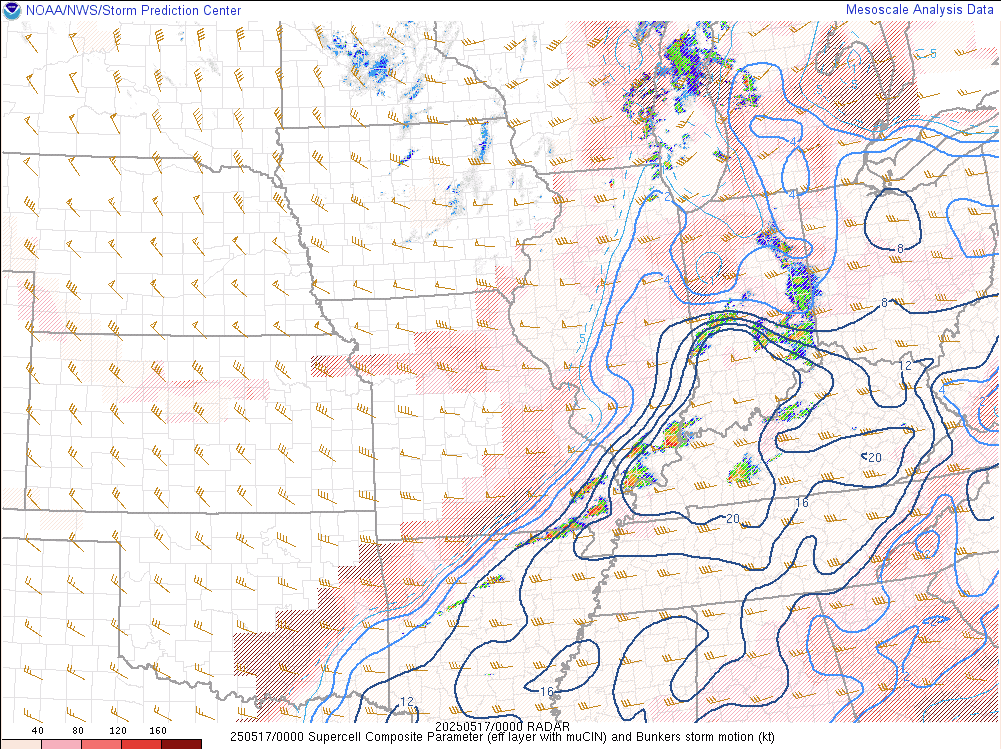
Given the combination of a lot of instability and ample shear, it is unsurprising that composite indices were very high for this event. Ahead of the leading supercell, as well as ahead of the main line of storms, supercell composite parameter (SCP) values approached 20, while significant tornado parameter (STP) values were between 4-6. These values are 3 to 5 times above typical thresholds which indicate elevated potential for supercells and tornadoes.
 |
 |
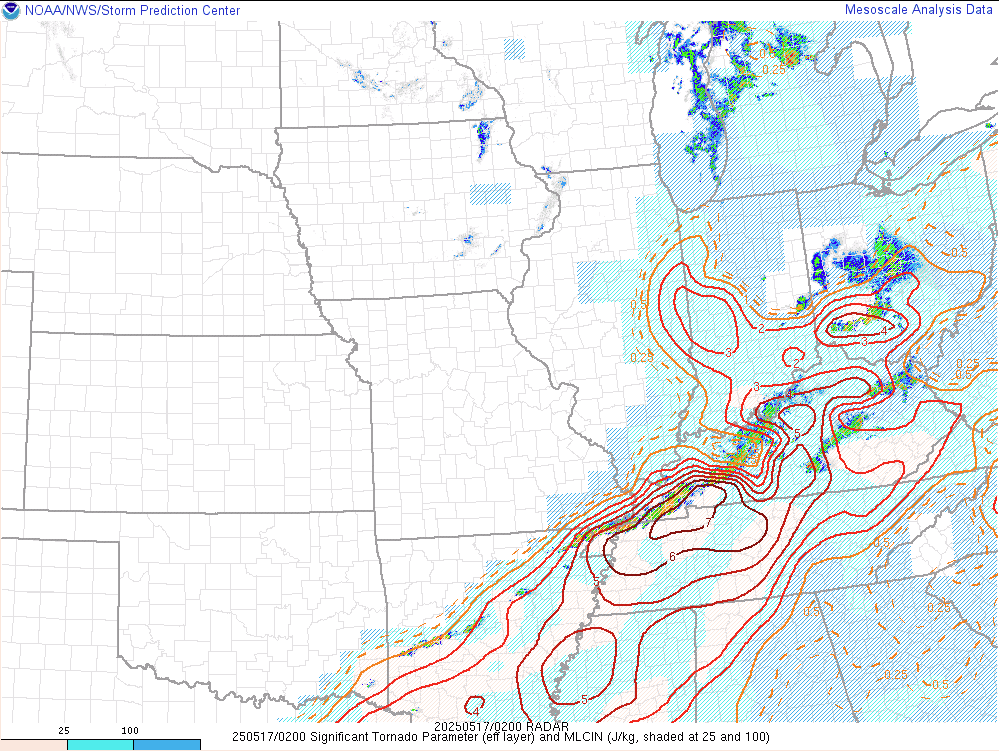 |
| Figure 10: Sounding Data from Nashville, TN (BNA) at 8 pm EDT 5/16/25 | Figure 11: Supercell Composite Parameter at 10 PM EDT 5/16/25 | Figure 12: Significant Tornado Parameter at 10 PM EDT 5/16/25 |
 |
Media use of NWS Web News Stories is encouraged! Please acknowledge the NWS as the source of any news information accessed from this site. |
|


 Weather Story
 Weather Map
 Local Radar