Overview
|
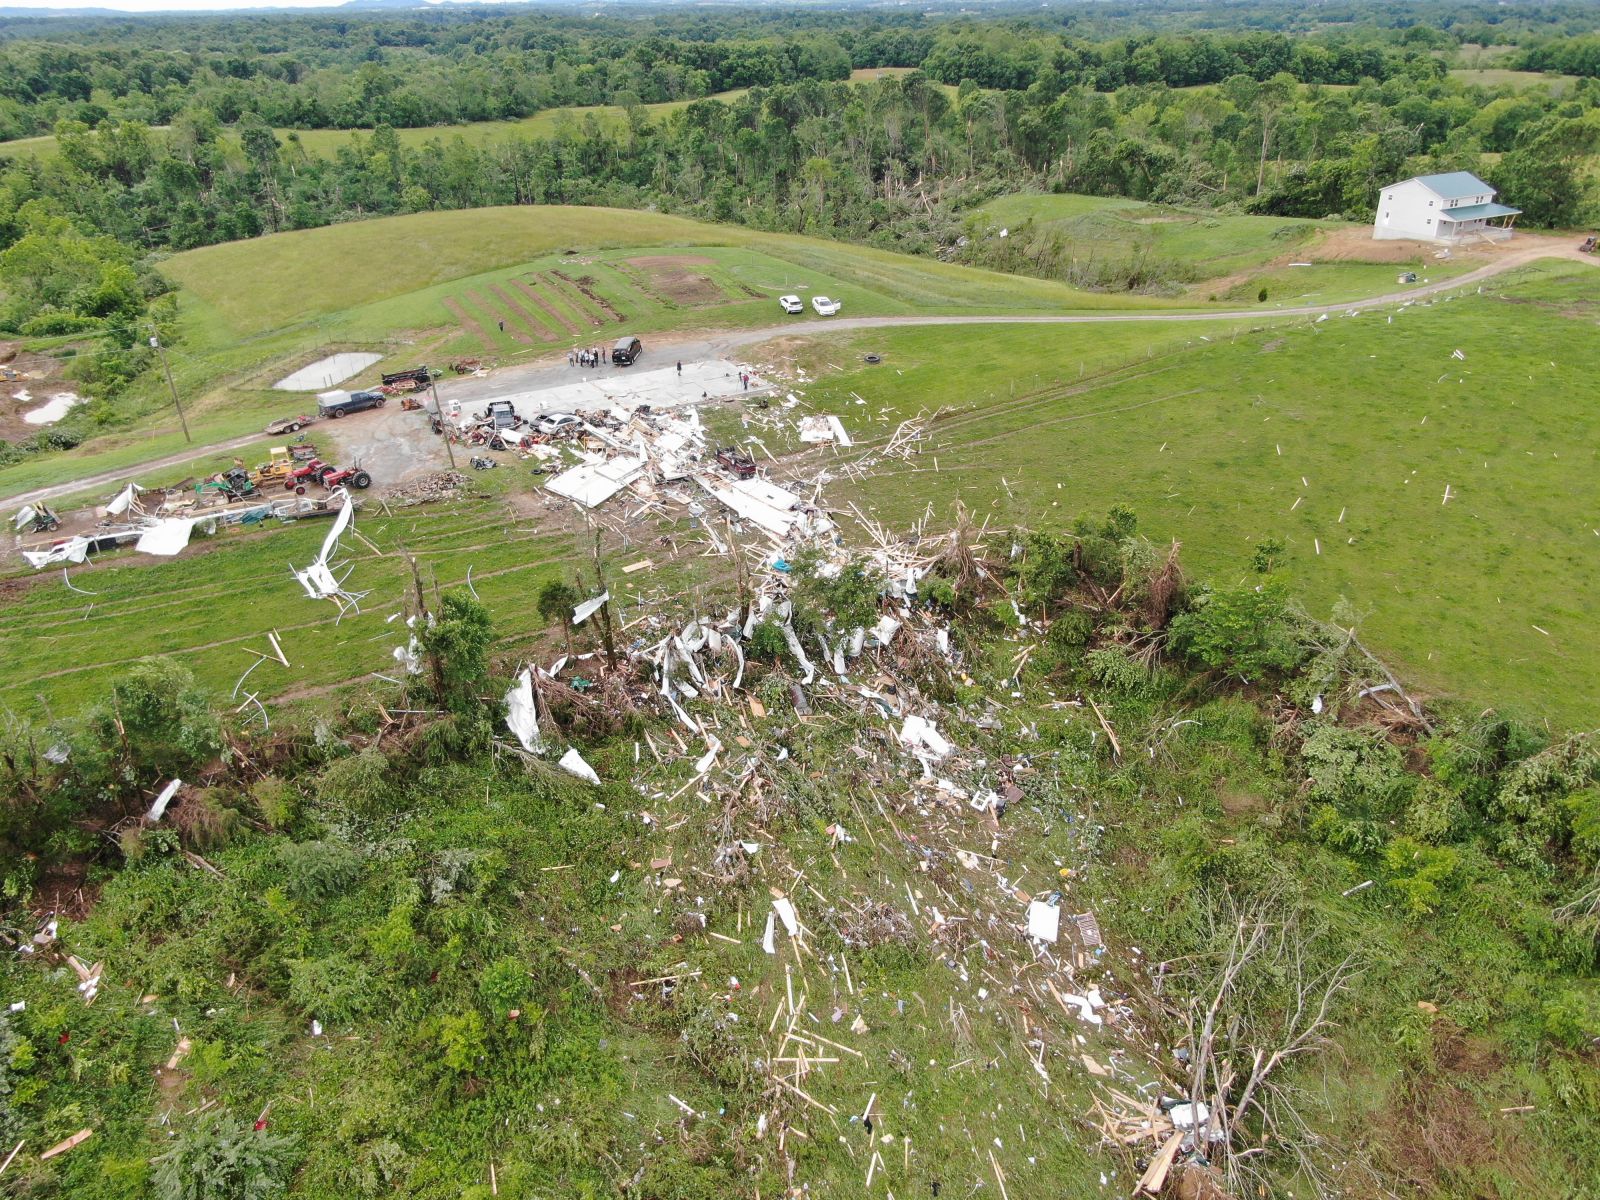
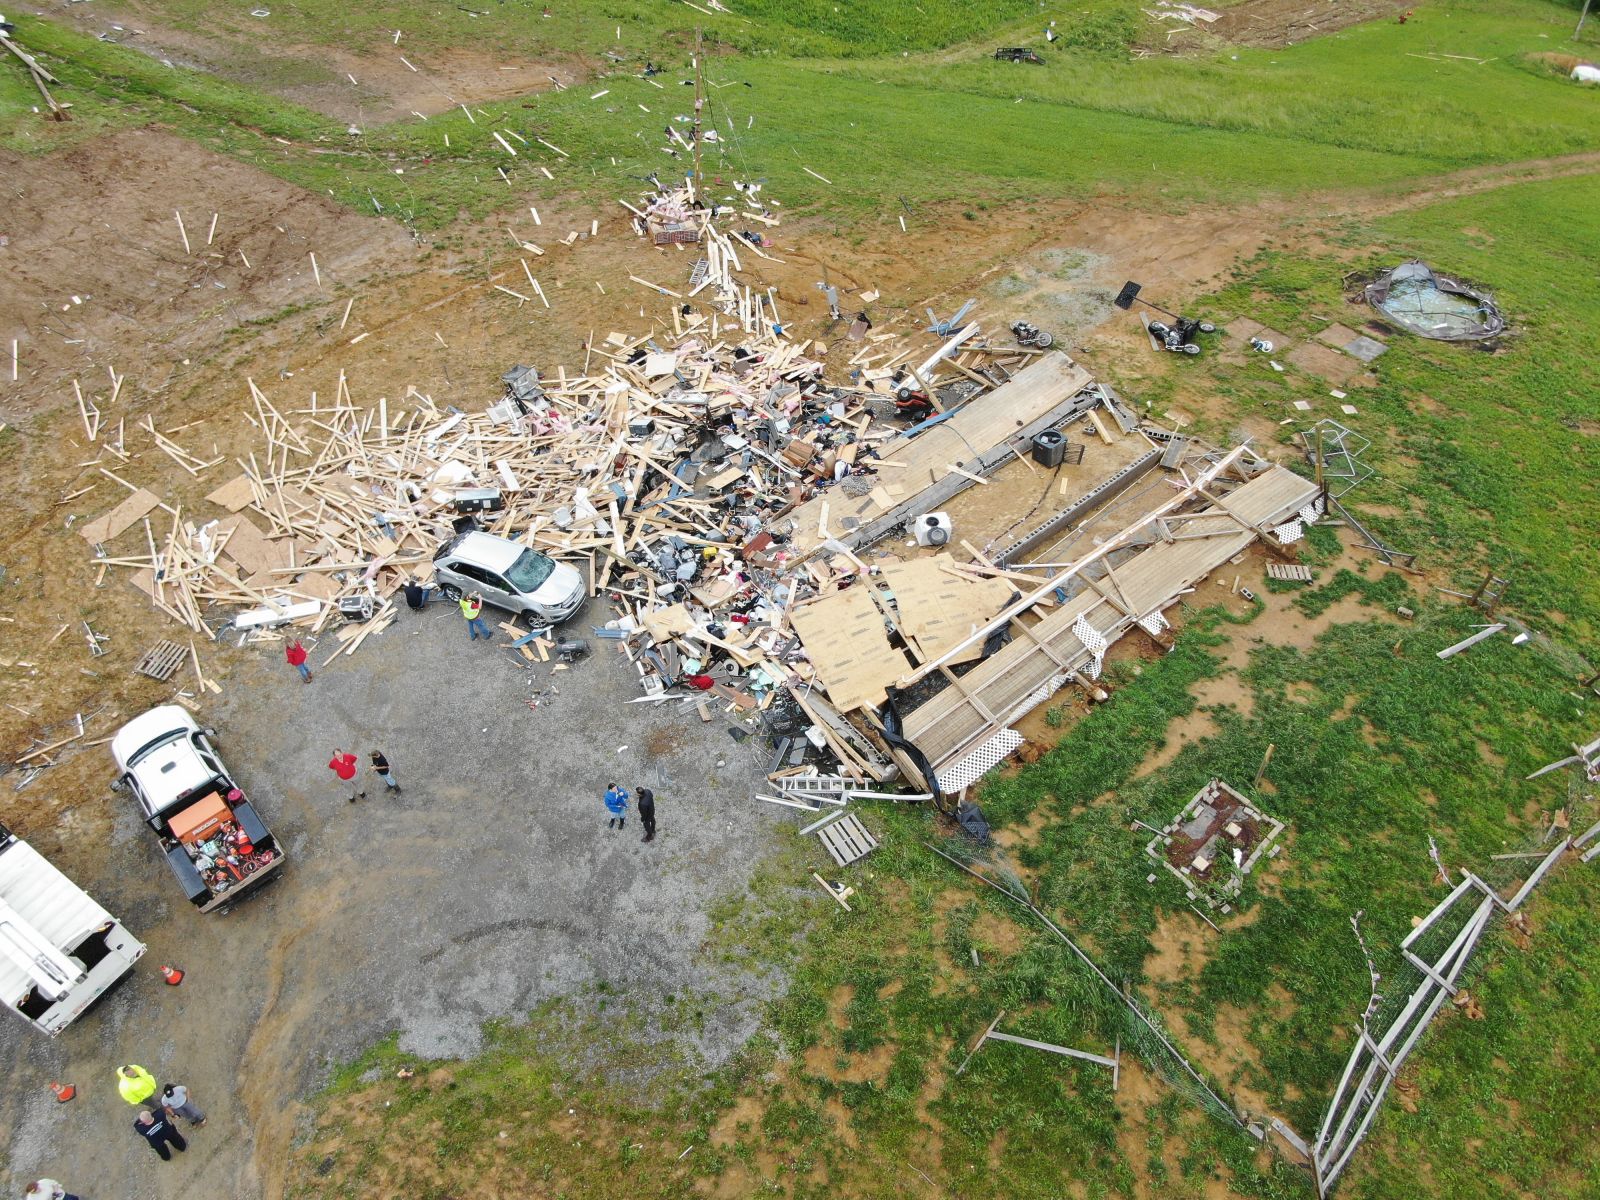
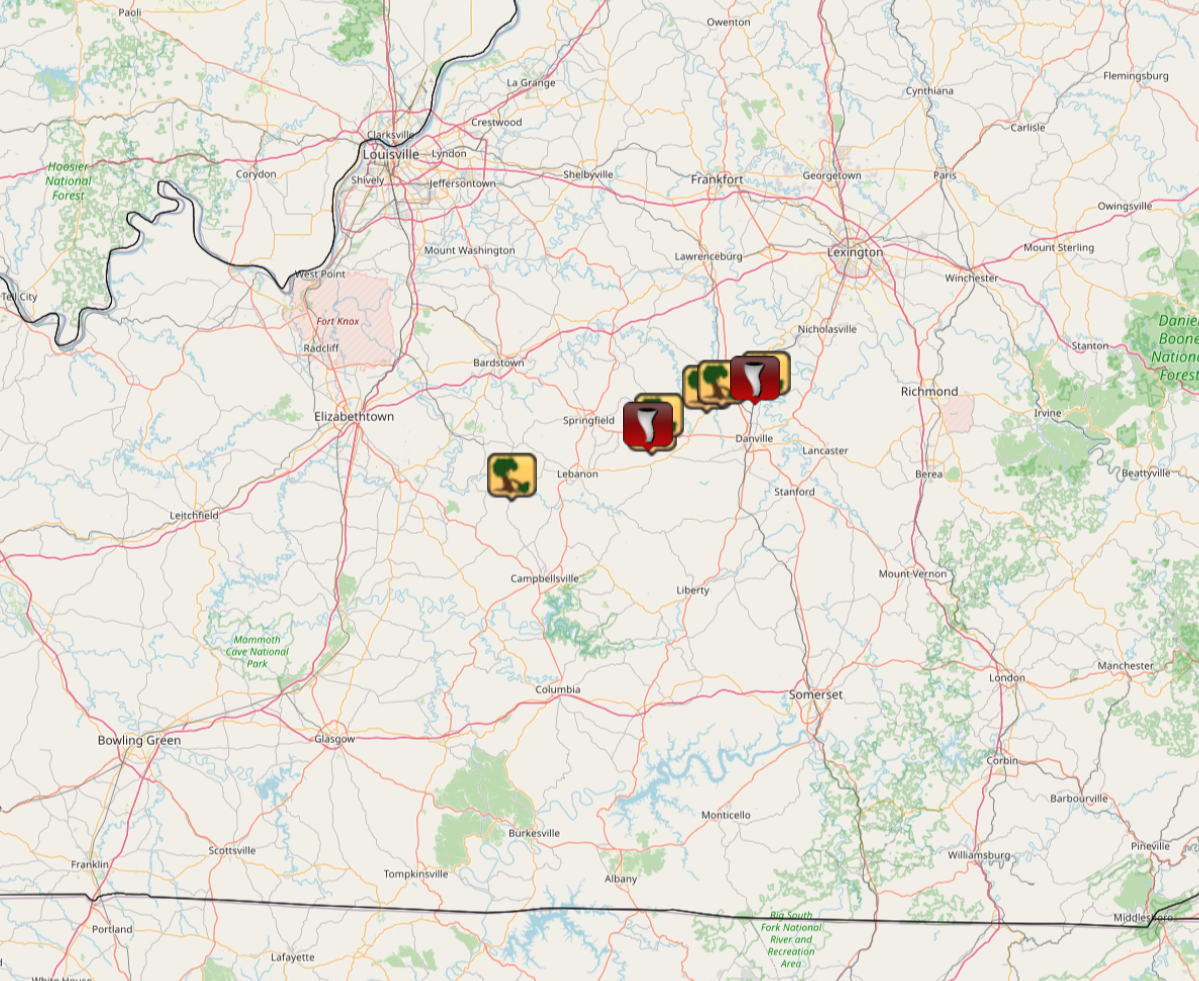
Just after sunrise on May 30th, 2025, storms moved through central Kentucky. These storms brought a tornado to southeastern Washington County and into northwestern Boyle County. Additional damage was also found in Mercer County near Burgin, KY. This storm summary page reviews the data and tornado damage.
|
|
Tornadoes
Select a tornado from the table to zoom into the track and view more information. The default table view is limited to 8 tracks, but can be scrolled by a mouse wheel or dynamically expanded. Additionally, the table can fill the entire window by clicking the small circular expanding arrow icon at the very top right of the table and returned to its original size by clicking the button again. The side information panel that opens over the map can be closed using the "X" on the upper right corner of the pop-up. Zoom into the map and click damage points to see detailed information and pictures from the surveys.
|
NOTE: times shown below are local to your device's time zone. |

The Enhanced Fujita (EF) Scale classifies tornadoes into the following categories:
| EF0 Weak 65-85 mph |
EF1 Moderate 86-110 mph |
EF2 Significant 111-135 mph |
EF3 Severe 136-165 mph |
EF4 Extreme 166-200 mph |
EF5 Catastrophic 200+ mph |
 |
|||||
| Tornadoes that fail to impact any ratable structures on the EF-Scale are rated EF-Unknown (EF-U) | |||||
Pics/Video
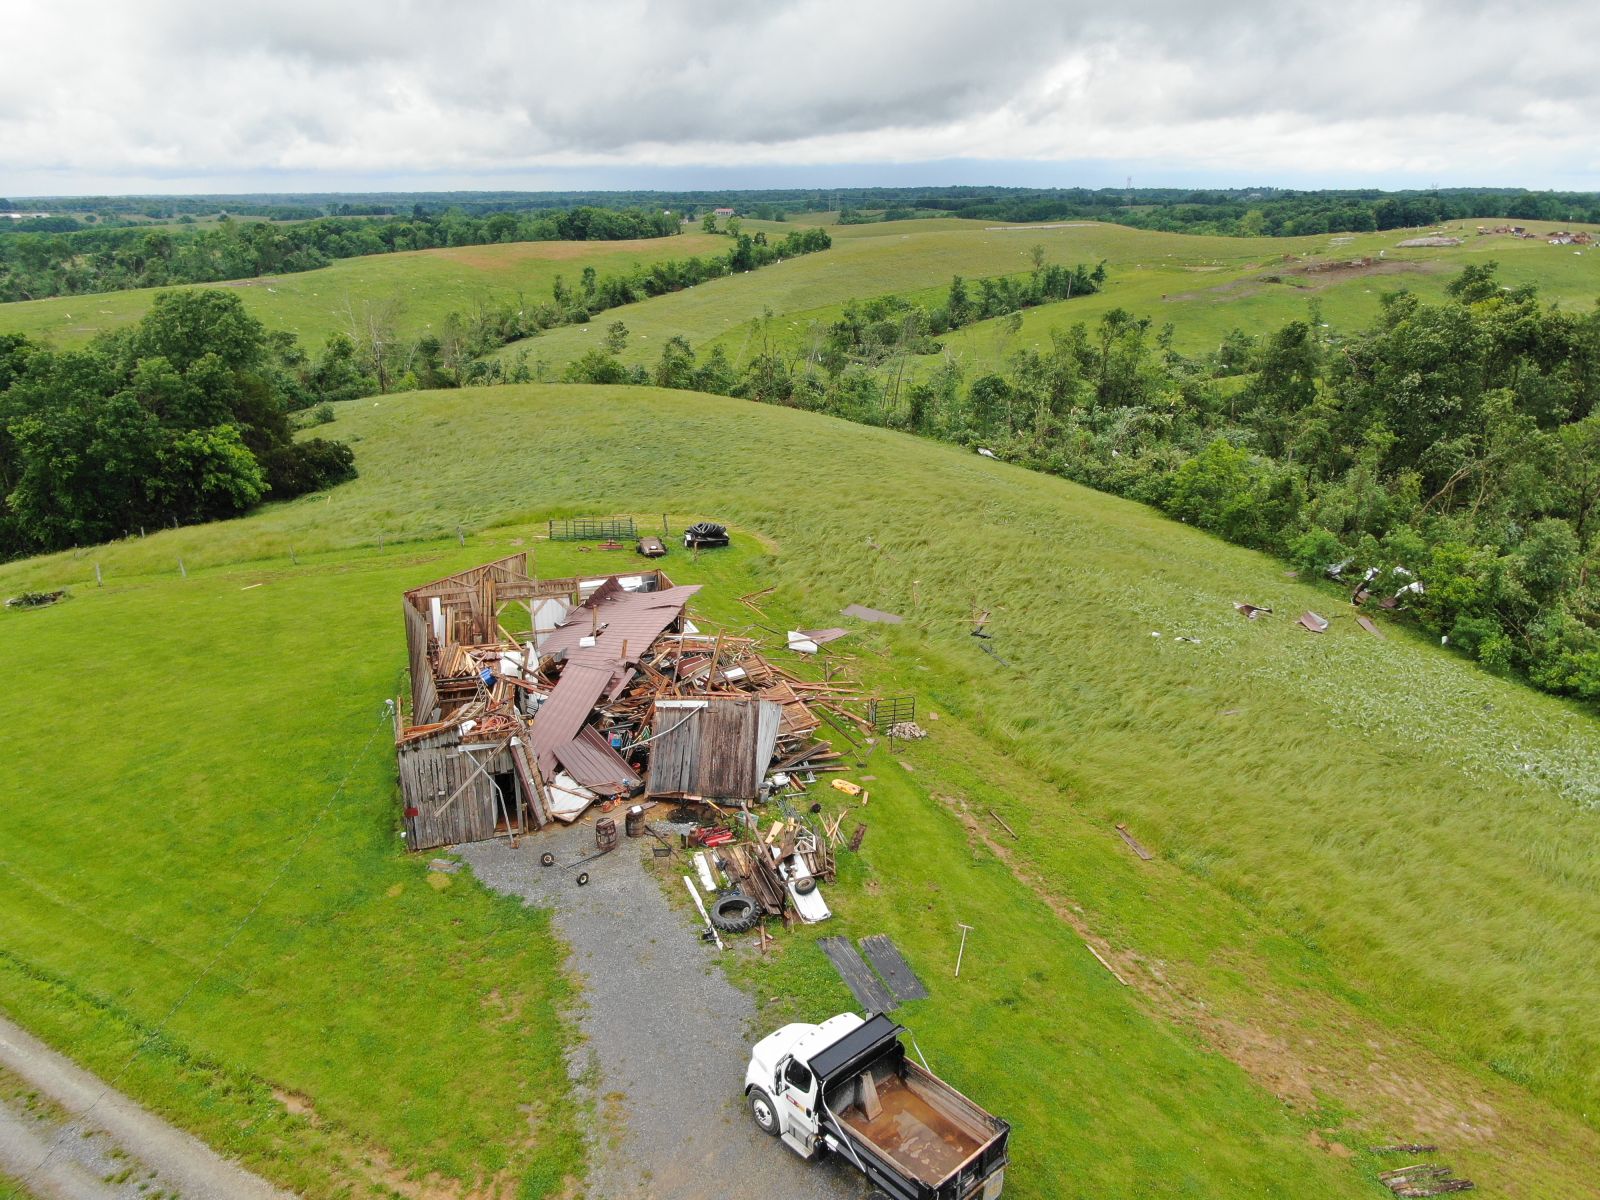
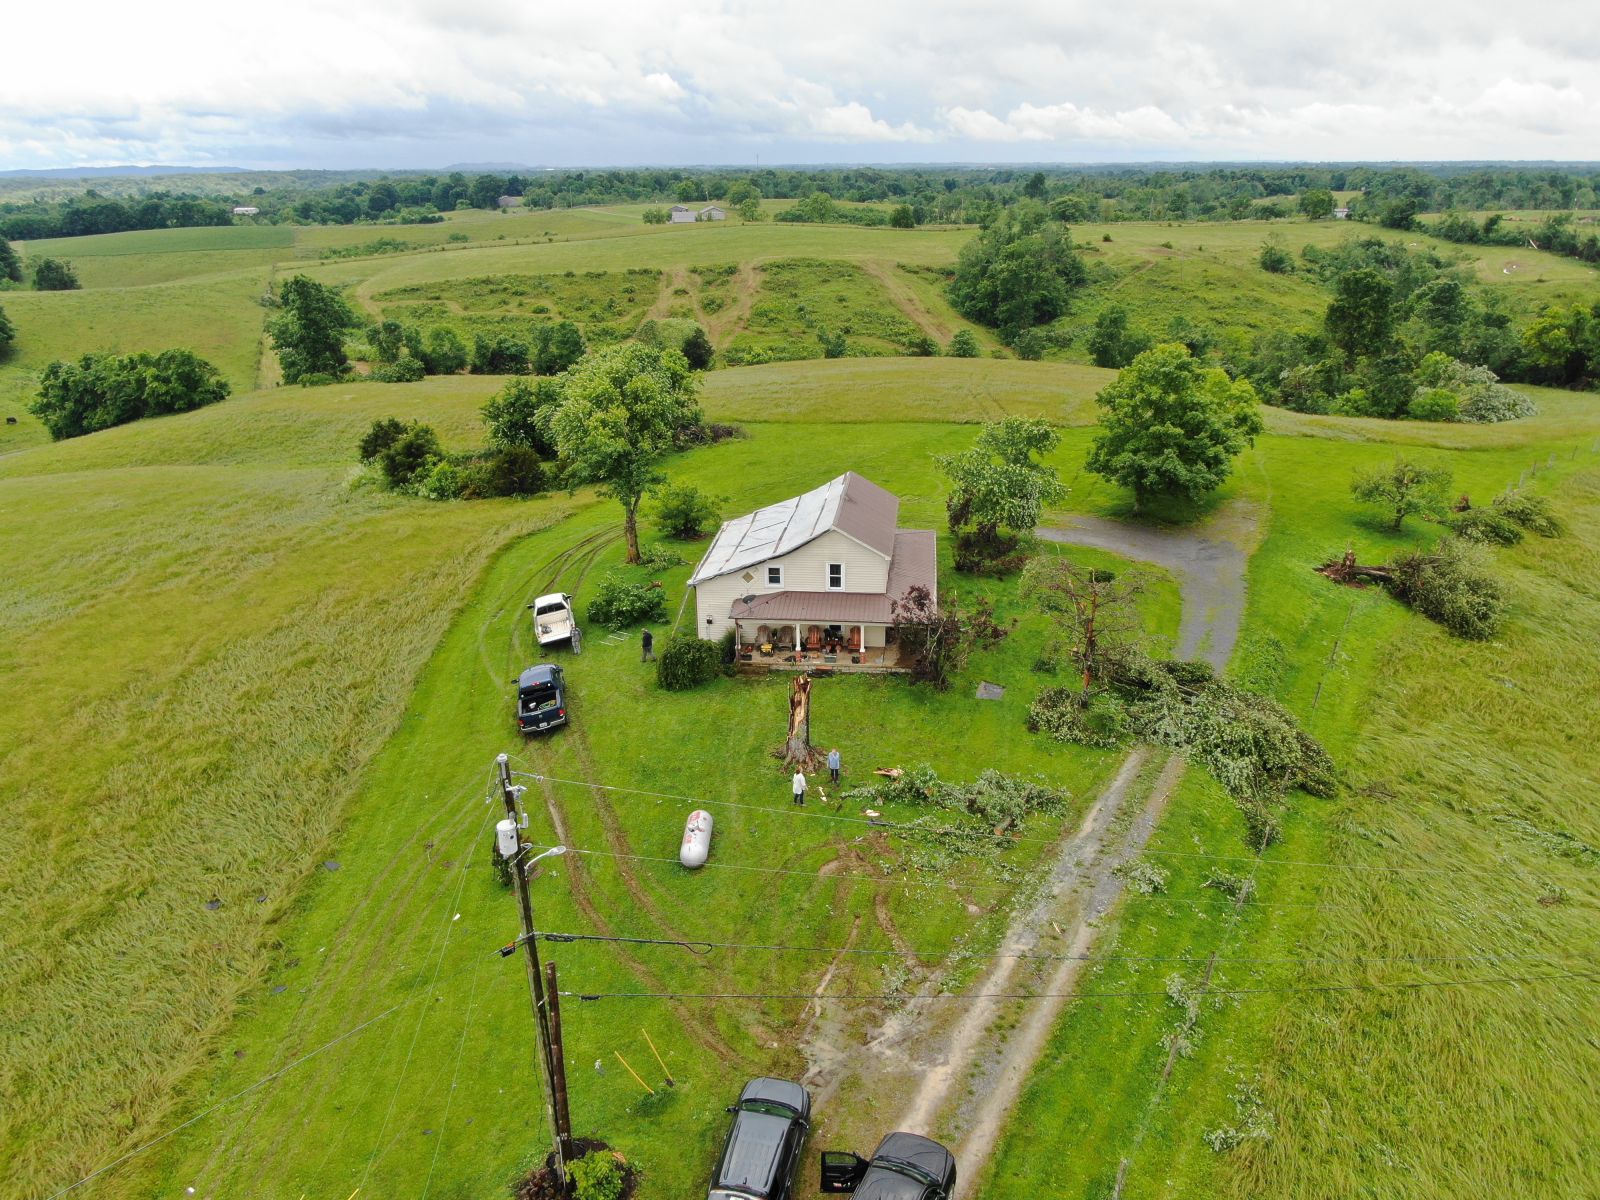
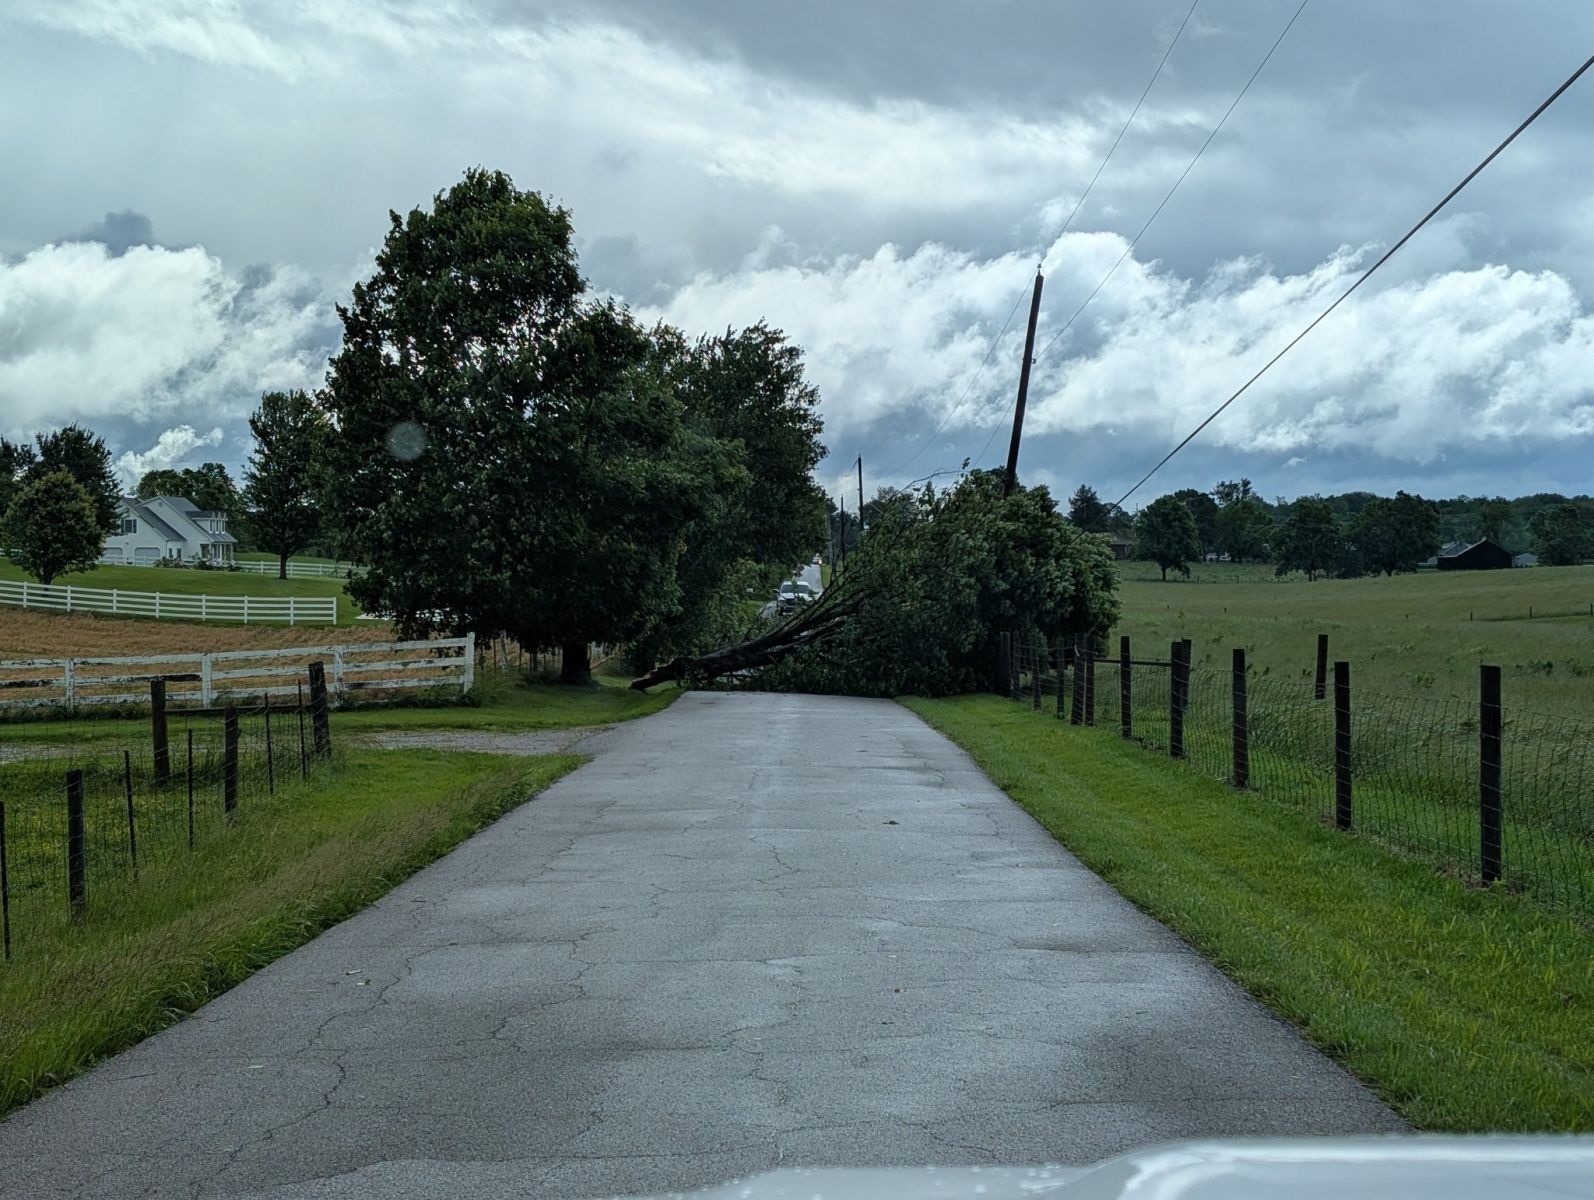
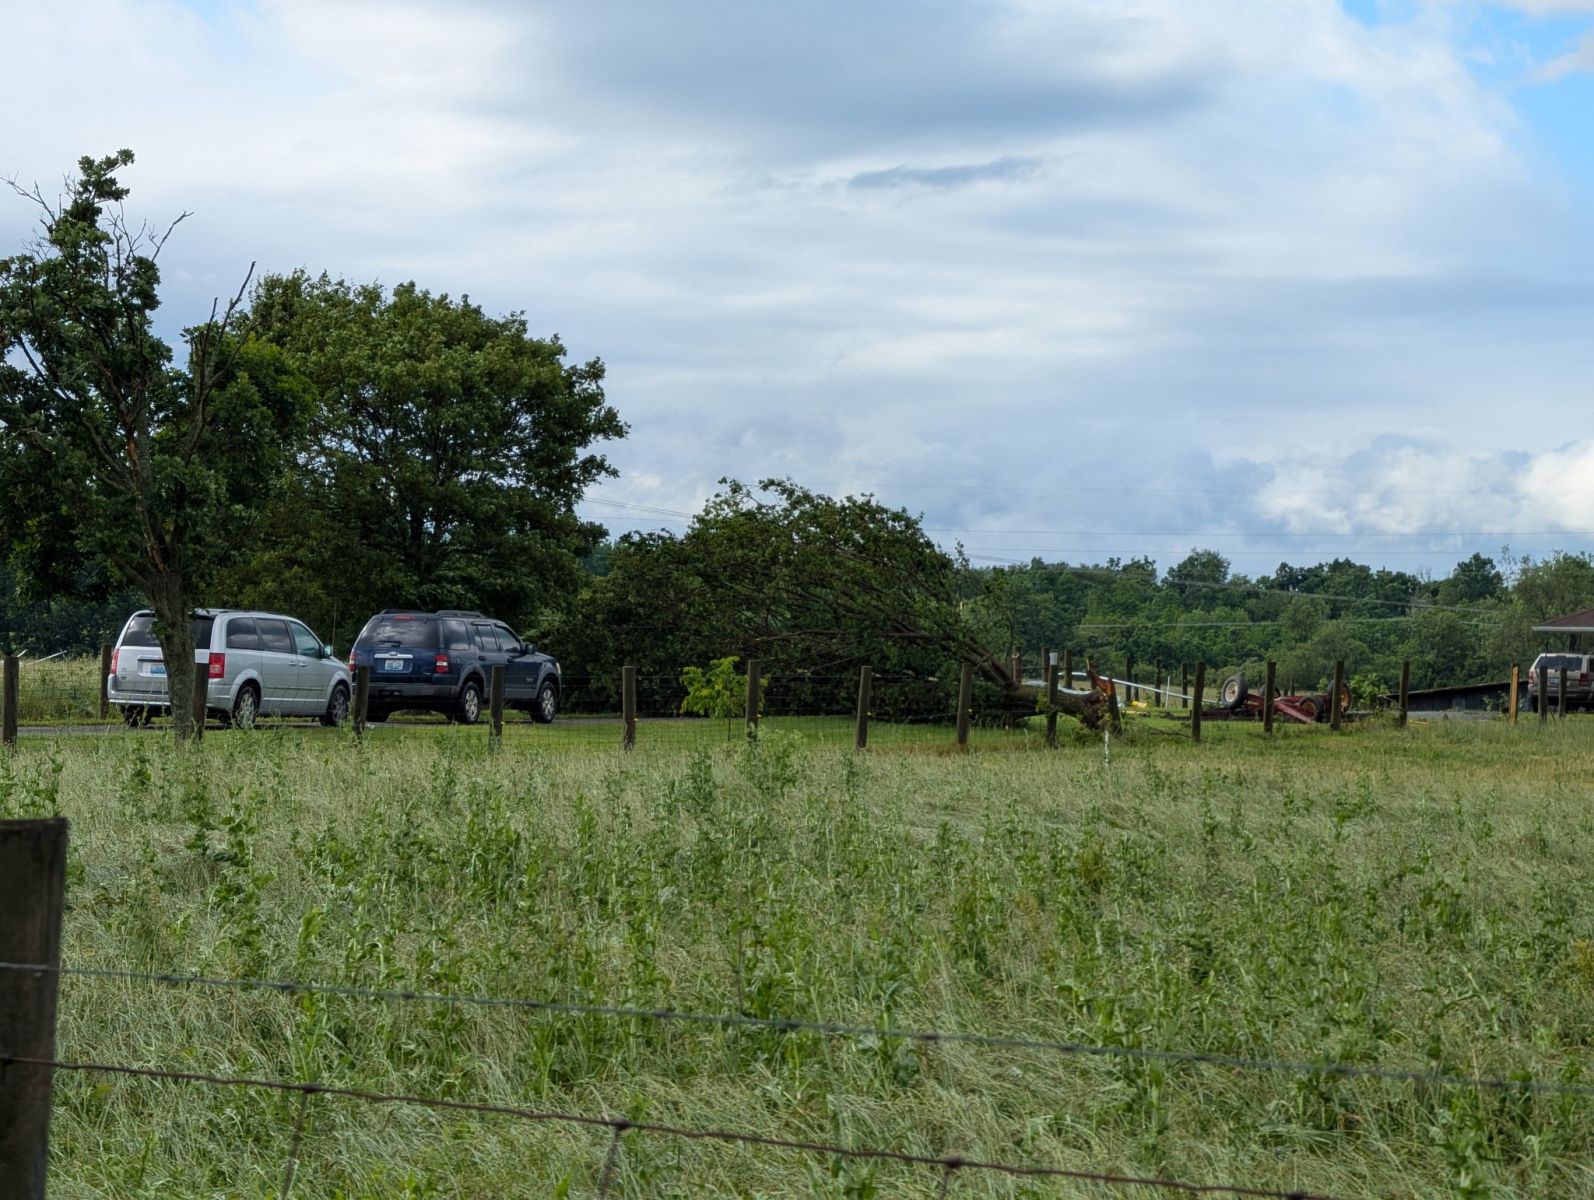
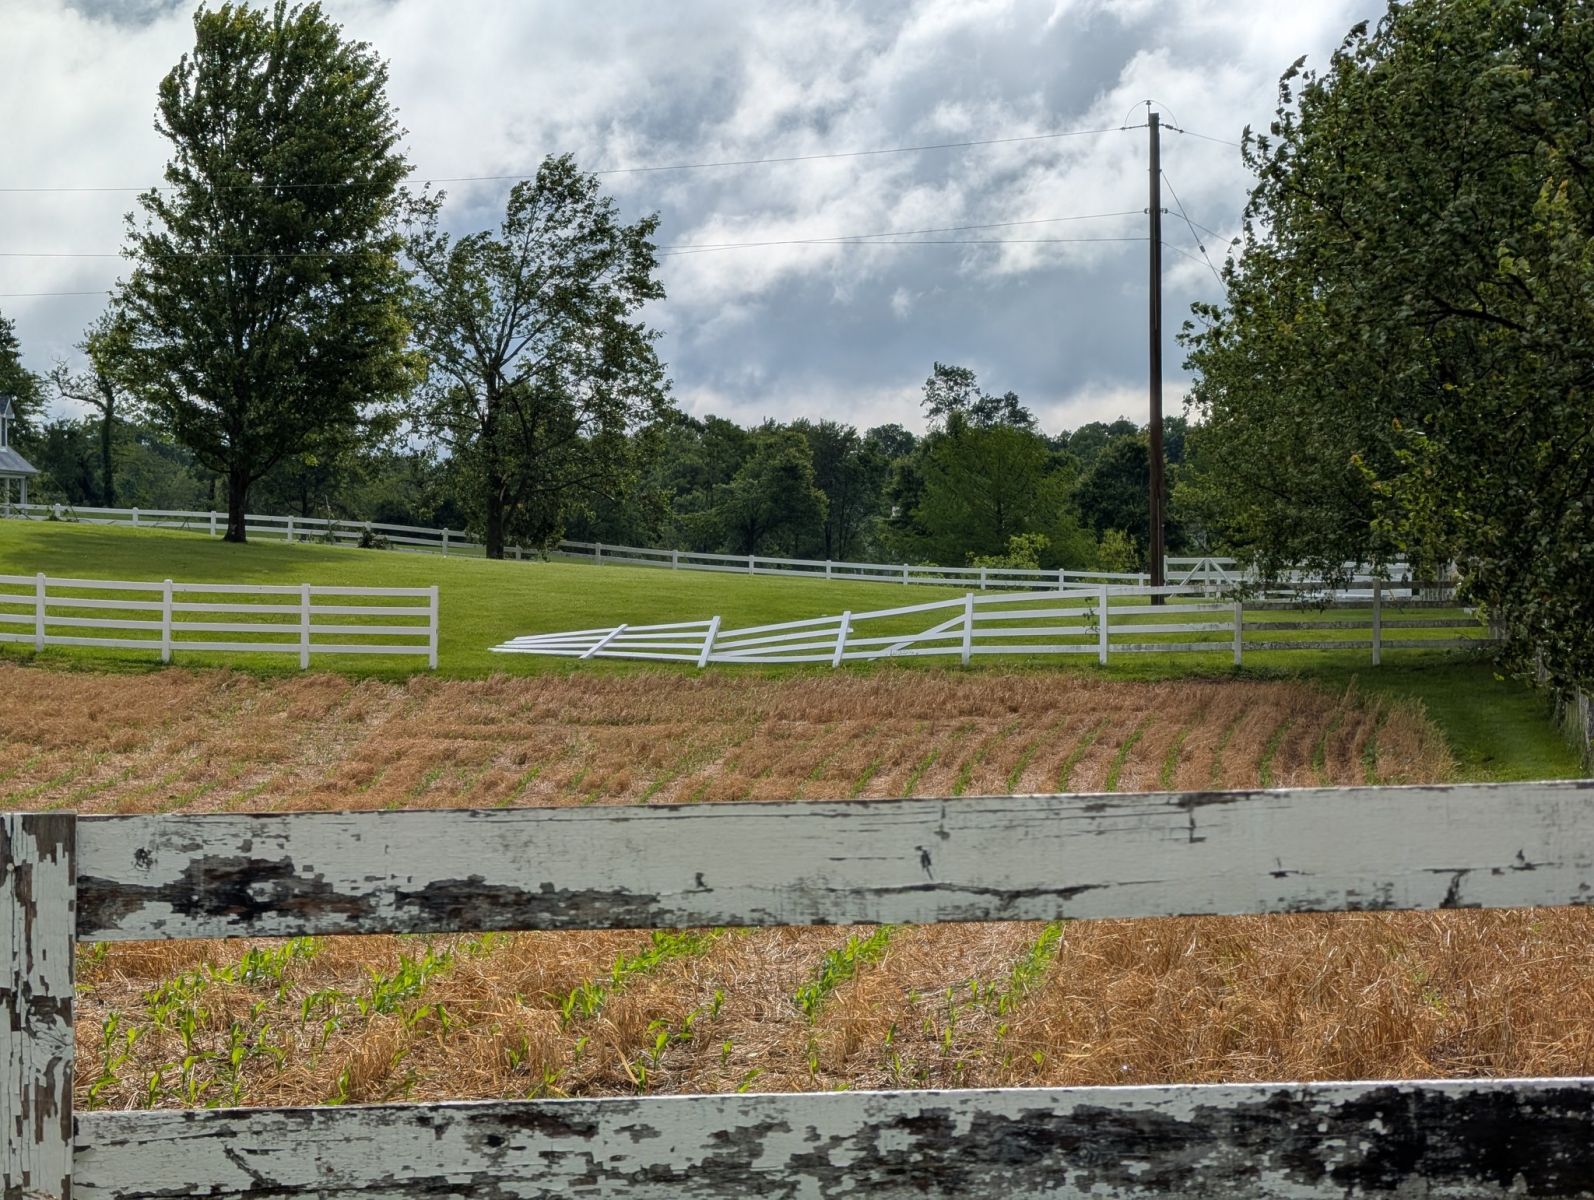
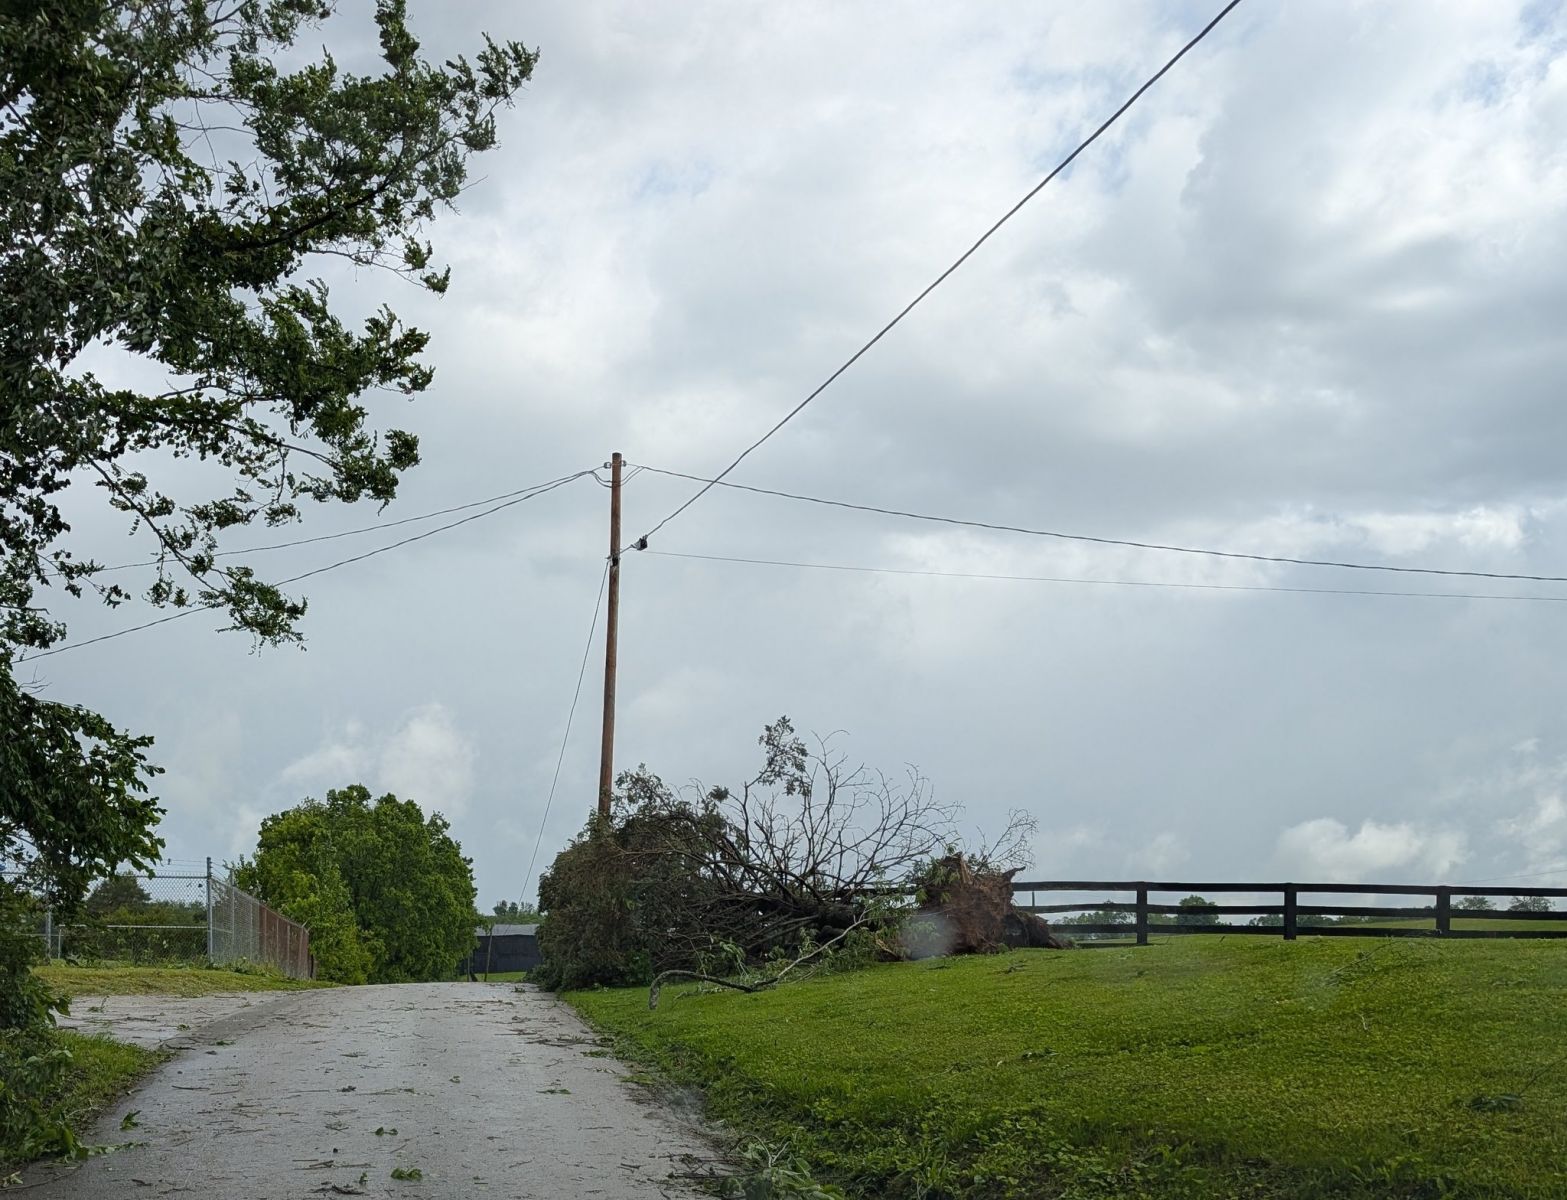
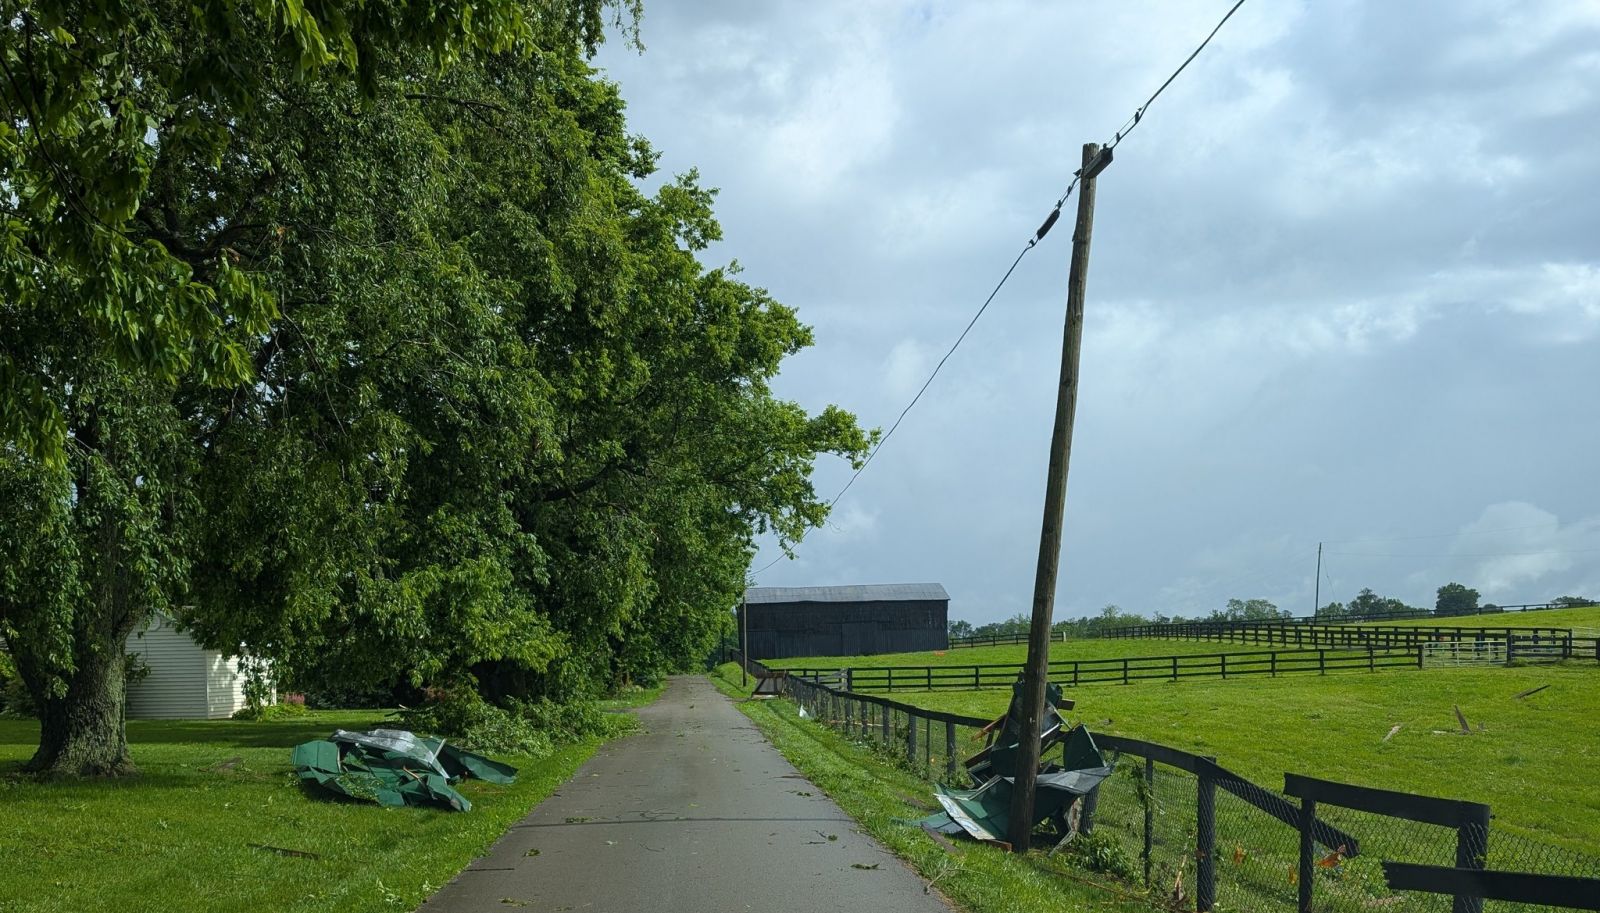
Washington/Boyle Counties
 |
 |
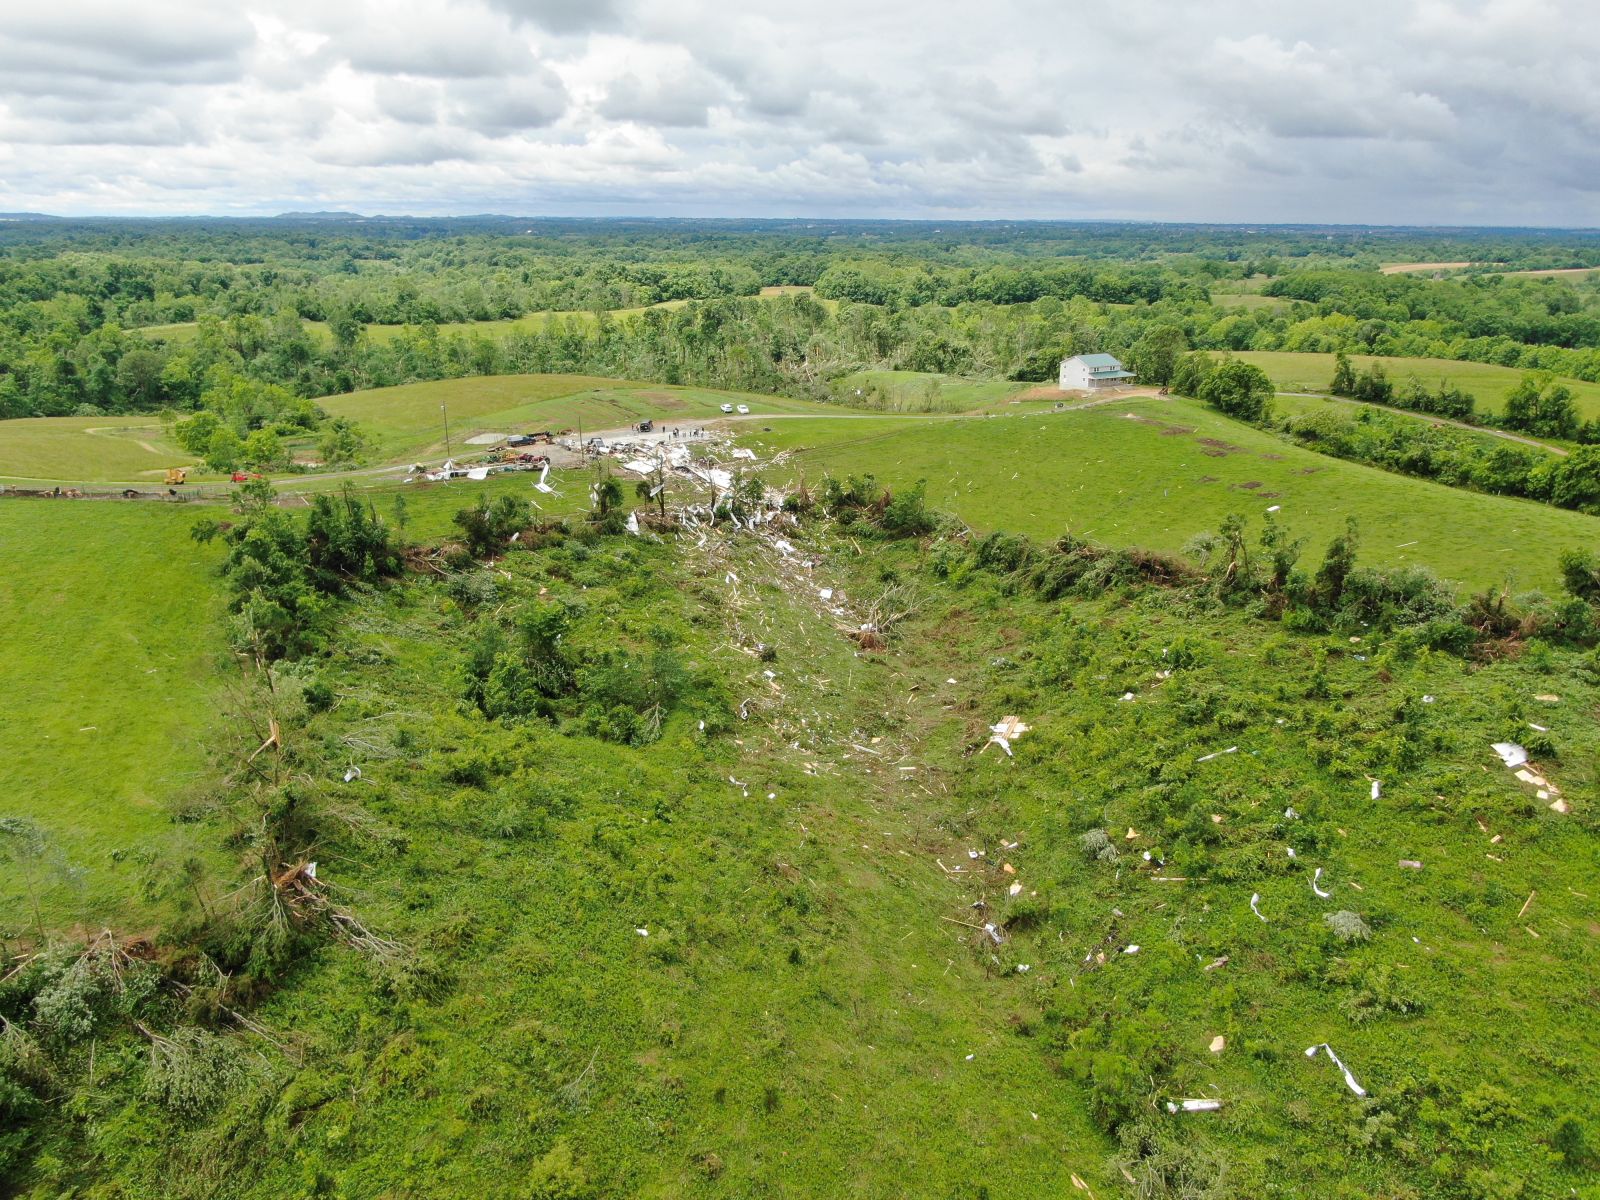 |
| Washington County Tornado Damage (Photo Credits: Leslee Wagner) | Washington County Tornado Damage (Photo Credits: Leslee Wagner) | NWS Storm Survey |
 |
 |
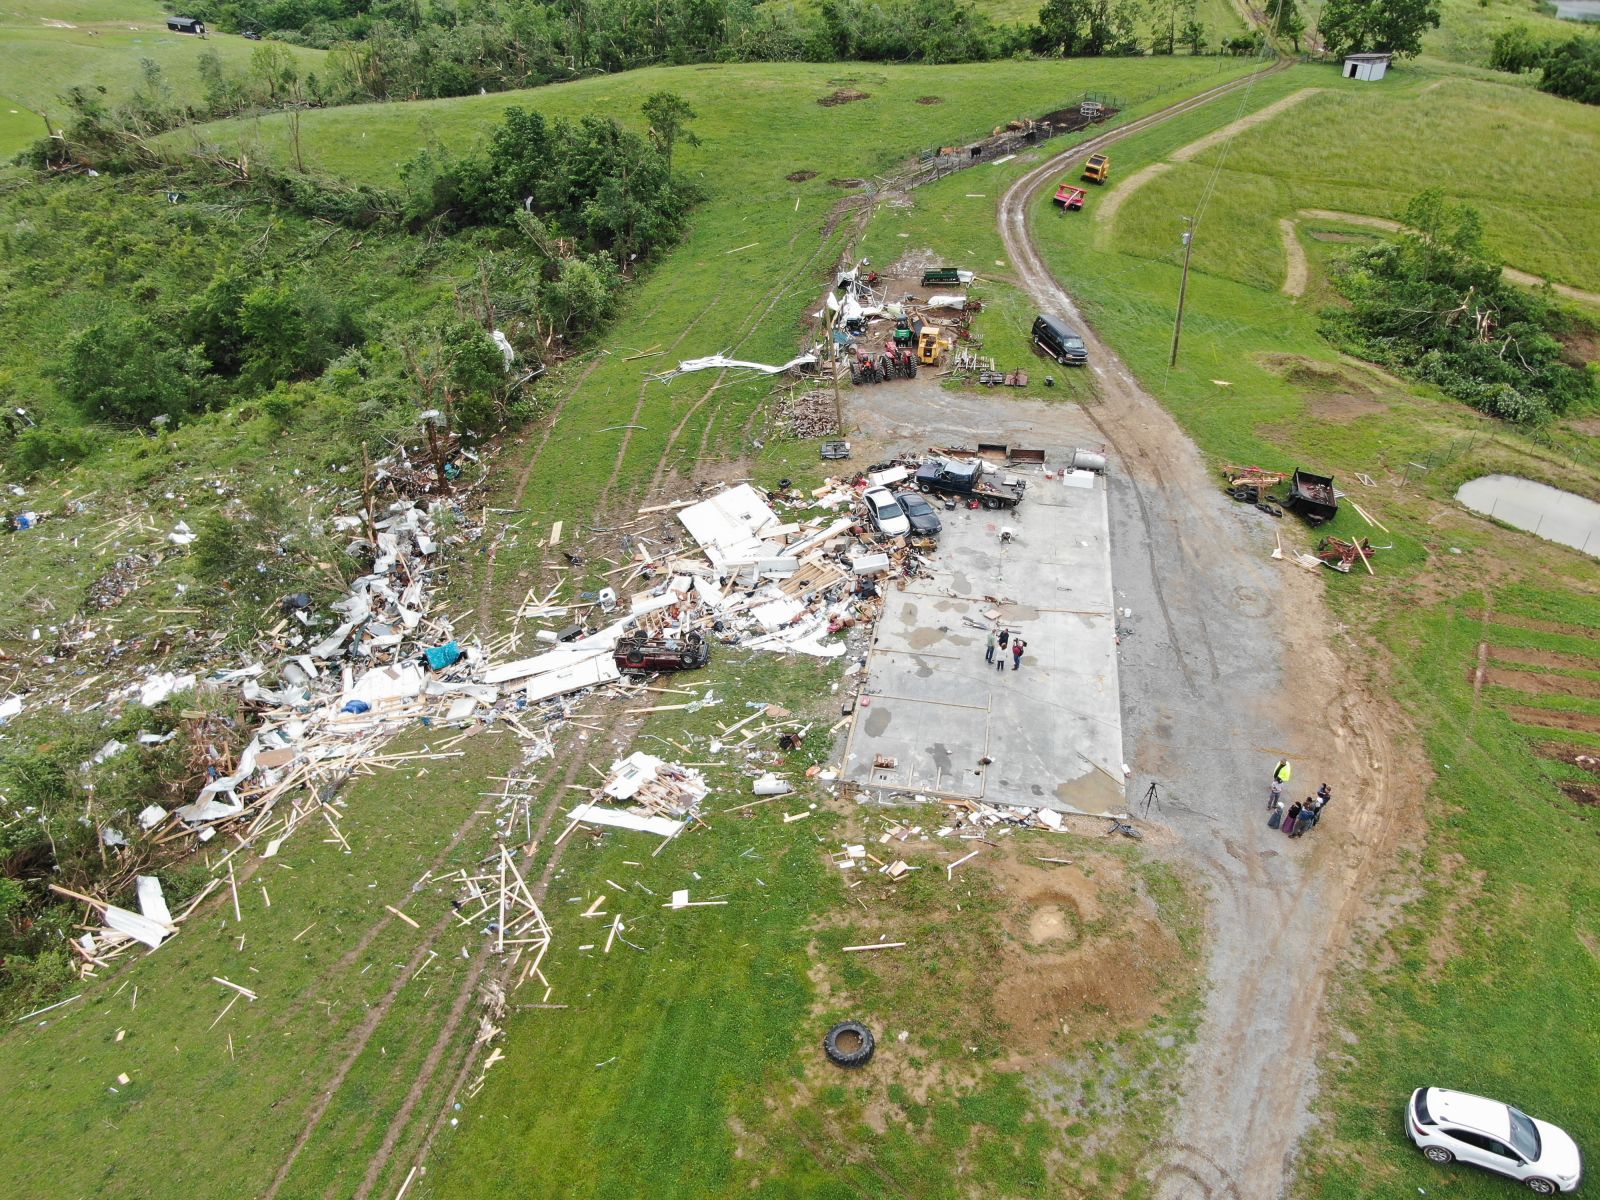 |
| NWS Storm Survey | NWS Storm Survey | NWS Storm Survey |
 |
 |
|
| NWS Storm Survey | NWS Storm Survey |
| NWS Storm Survey |
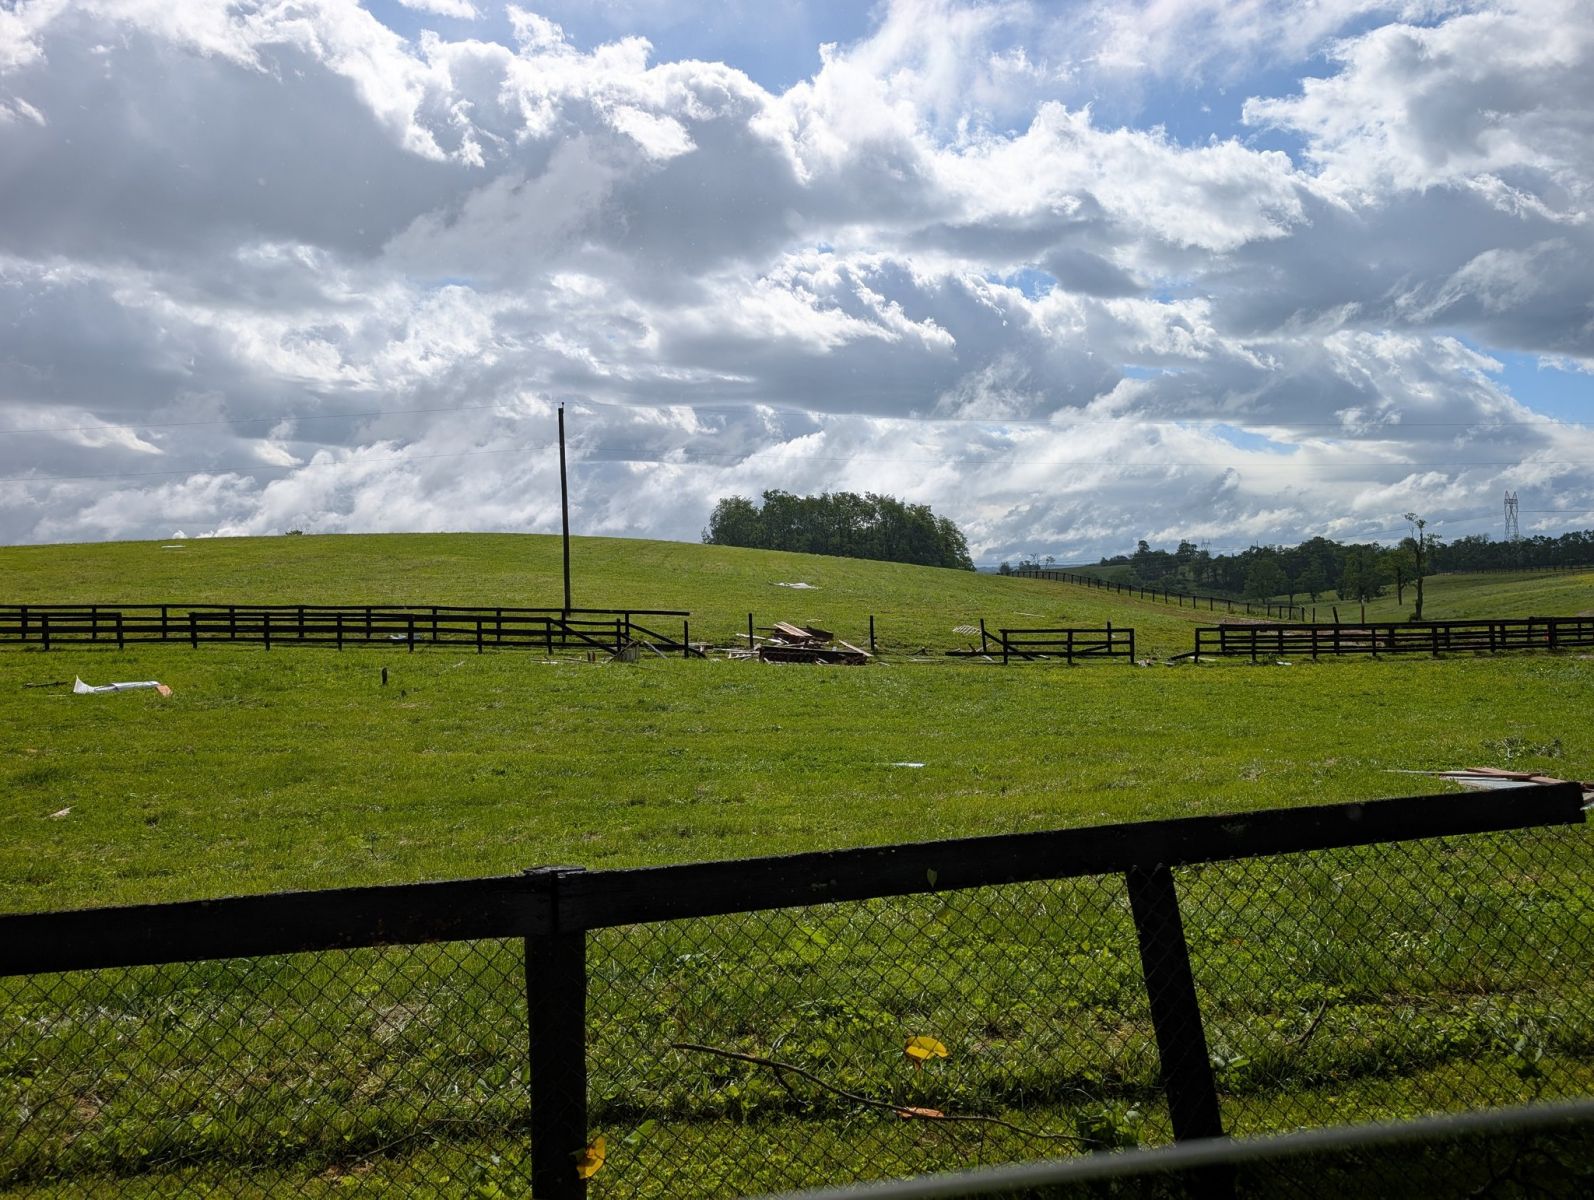
Mercer County
 |
 |
 |
| Photo Credit: X-Storm_101 | Photo Credit: X-Storm_101 | Photo Credit: X-Storm_101 |
 |
 |
 |
| Photo Credit: X-Storm_101 | Photo Credit: X-Storm_101 | Photo Credit: X-Storm_101 |
Storm Reports
Local Storm Reports Map
Radar
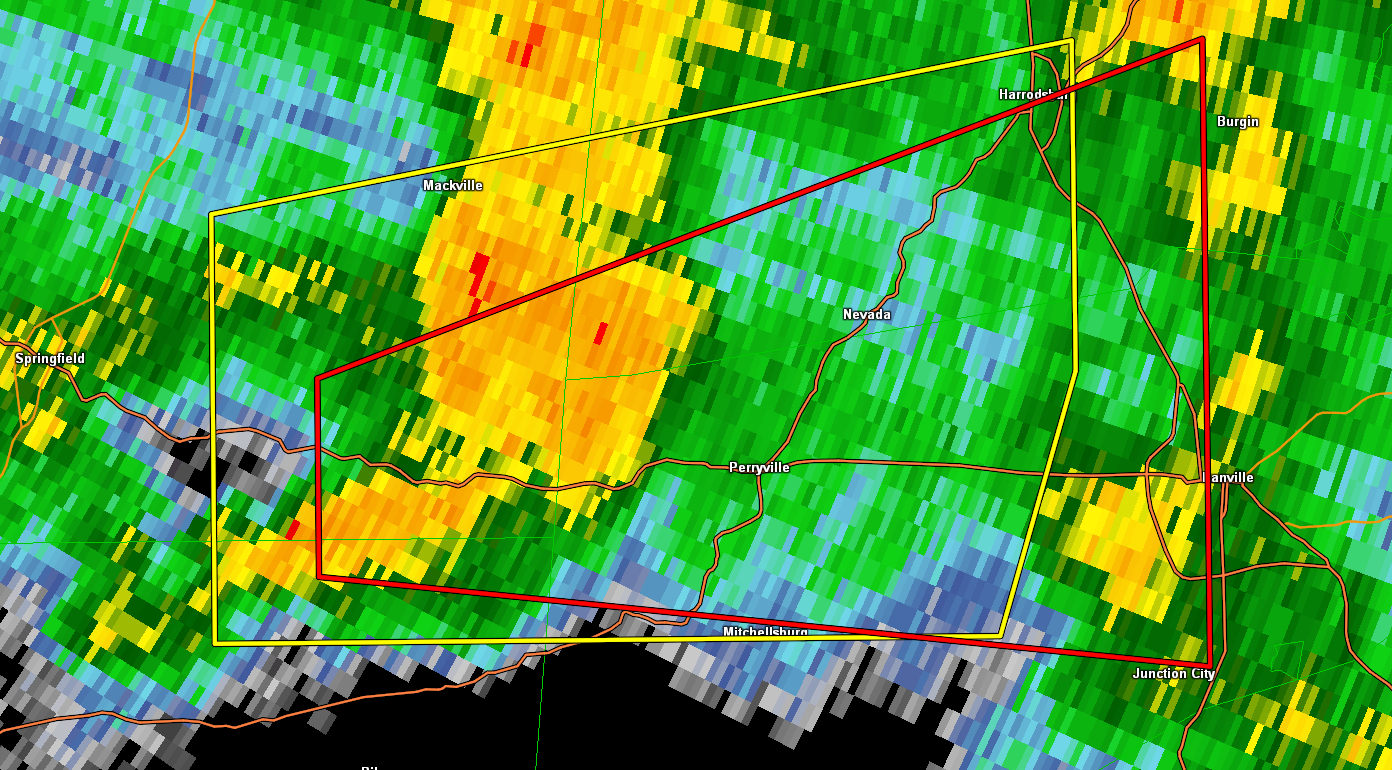
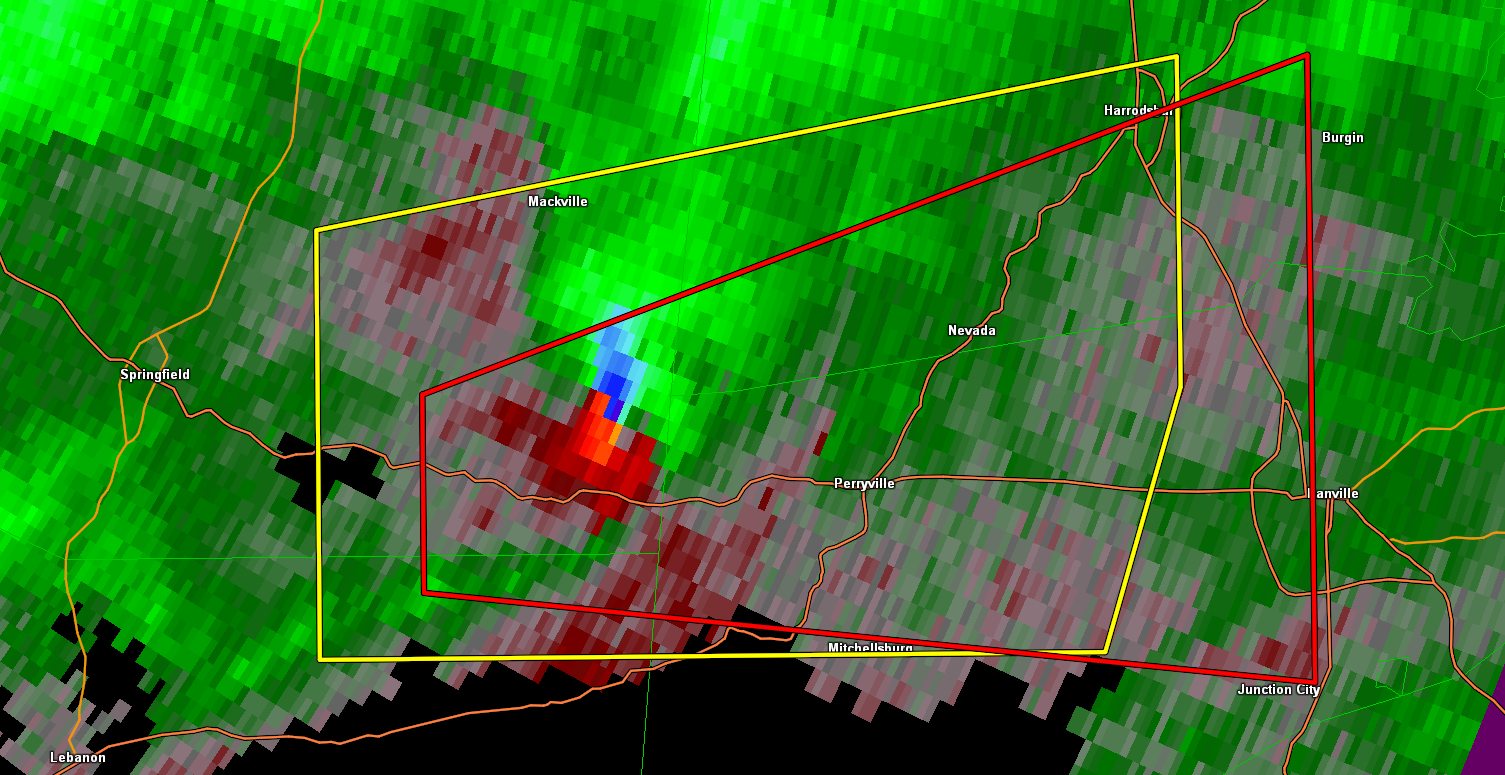
Washington County
 |
 |
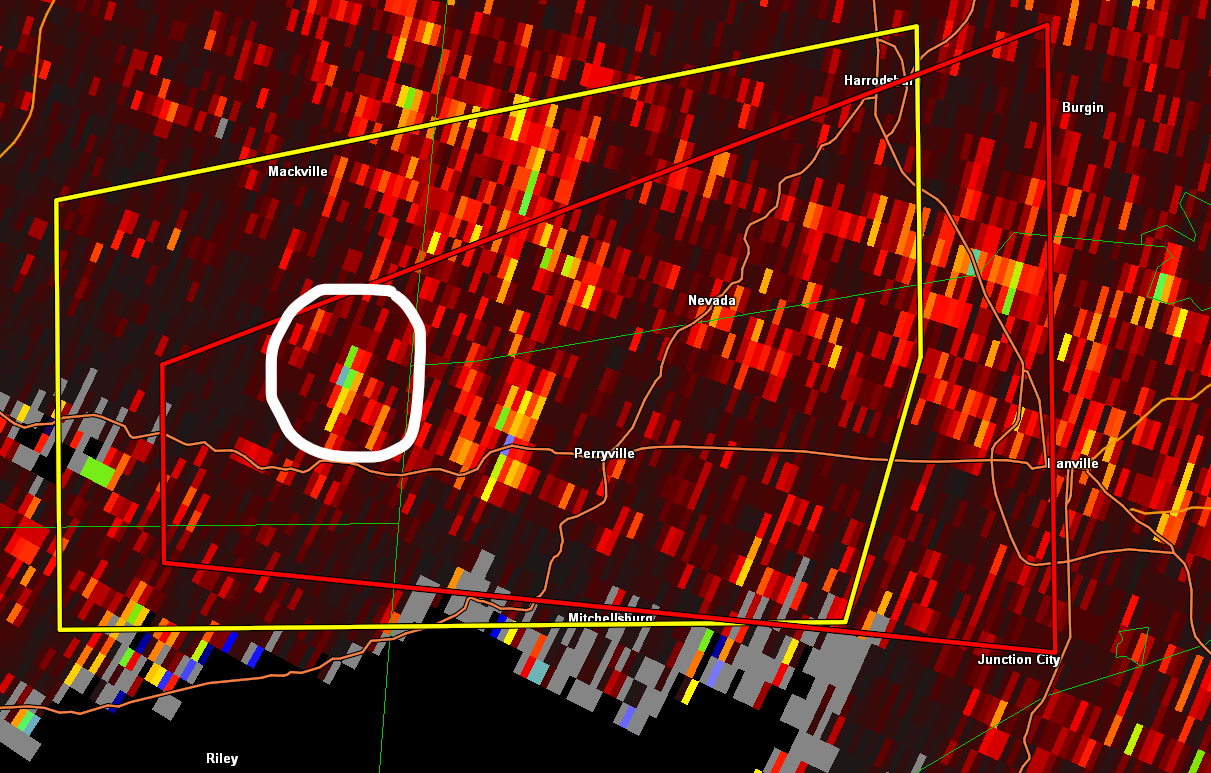 |
| Reflectivity at 1051Z | Storm Relative Velocity at 1051Z | Correlation Coefficient at 1051Z |
Environment
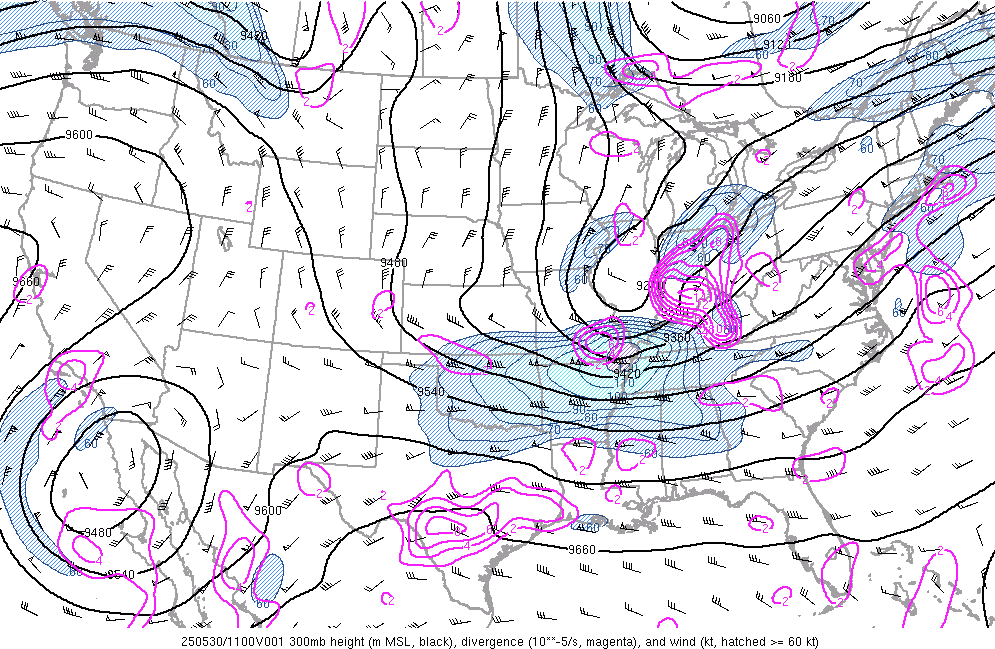
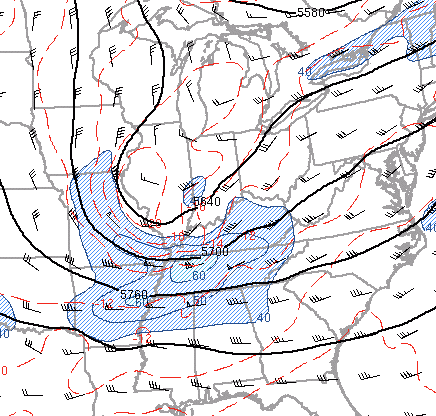
Deep layer troughing moved through the lower Ohio Valley in the morning of May 30th. Both at 300mb and 500mb, there is a jet streak which places central Kentucky under the left exit region of the jet. Due to four quadrant jet theory, the left exit region is an area of divergence aloft and a source of lift. Both the trough and the jet position bring large scale lift over the region in the morning.
 |
 |
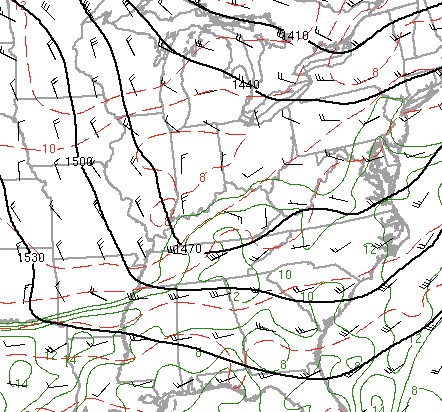 |
| Figure 1: 300mb at 11Z | Figure 2: 500mb at 11Z | Figure 3: 850mb at 11Z |
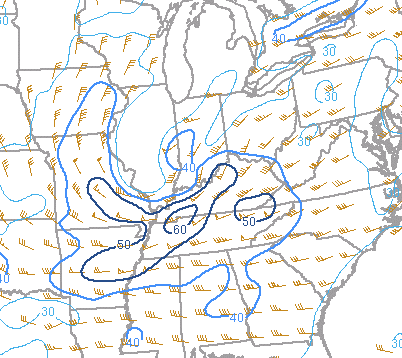
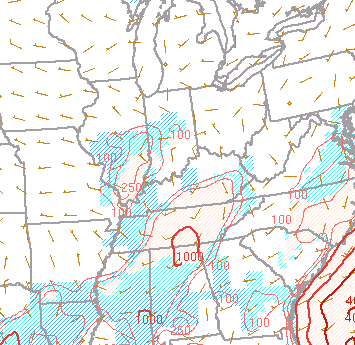
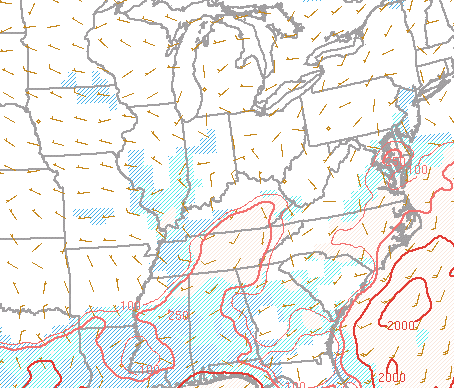
Due to troughing aloft and surface low pressure deepening at the surface, deep-layer shear is expected to be increased over the region (shown in Figure 4). In the lower levels, there is some shear present, however Washington County is along the northern periphery of this shear. There is also a weak nose of instability at the surface nosing into Washington County (shown in Figure 7). The LCL height over the region was 500m, which is quite low. All of these ingredients combined offer a risk for tornadogenesis around this hour, however the conditions were not extremely favorable.
 |
 |
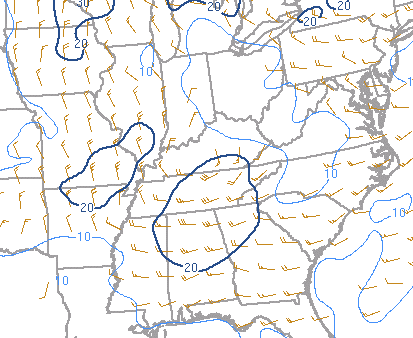 |
| Figure 4: 0-6km Shear at 11Z | Figure 5: Effective Shear at 11Z | Figure 6: 0-1km Shear at 11Z |
 |
 |
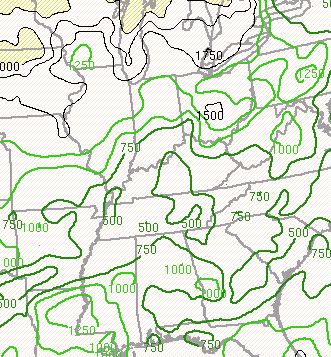 |
| Figure 7: Surface Based CAPE at 11Z | Figure 8: Mixed Layer CAPE at 11Z | Figure 9: LCL Height at 11Z |
 |
Media use of NWS Web News Stories is encouraged! Please acknowledge the NWS as the source of any news information accessed from this site. |
|


 Weather Story
 Weather Map
 Local Radar