Overview
|
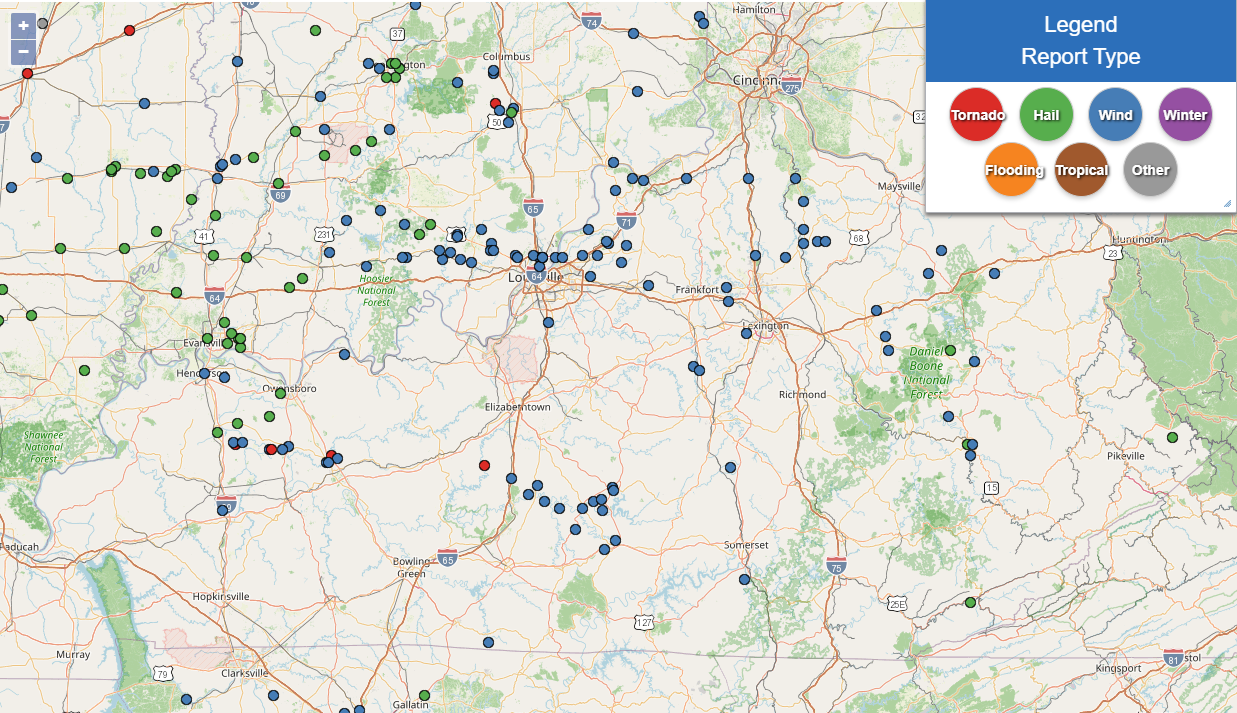
A strong low pressure system brought multiple rounds of severe storms to southern Indiana and central Kentucky April 27-29, 2026. The severe storms produced four tornadoes, numerous instances of straight line wind damage and flash flooding.
|
 |
Tornadoes
Select a tornado from the table to zoom into the track and view more information. The default table view is limited to 8 tracks, but can be scrolled by a mouse wheel or dynamically expanded. Additionally, the table can fill the entire window by clicking the small circular expanding arrow icon at the very top right of the table and returned to its original size by clicking the button again. The side information panel that opens over the map can be closed using the "X" on the upper right corner of the pop-up. Zoom into the map and click damage points to see detailed information and pictures from the surveys.
|
NOTE: times shown below are local to your device's time zone. |

The Enhanced Fujita (EF) Scale classifies tornadoes into the following categories:
| EF0 Weak 65-85 mph |
EF1 Moderate 86-110 mph |
EF2 Significant 111-135 mph |
EF3 Severe 136-165 mph |
EF4 Extreme 166-200 mph |
EF5 Catastrophic 200+ mph |
 |
|||||
| Tornadoes that fail to impact any ratable damage indicators on the EF-Scale are rated EF-Unknown (EF-U) | |||||
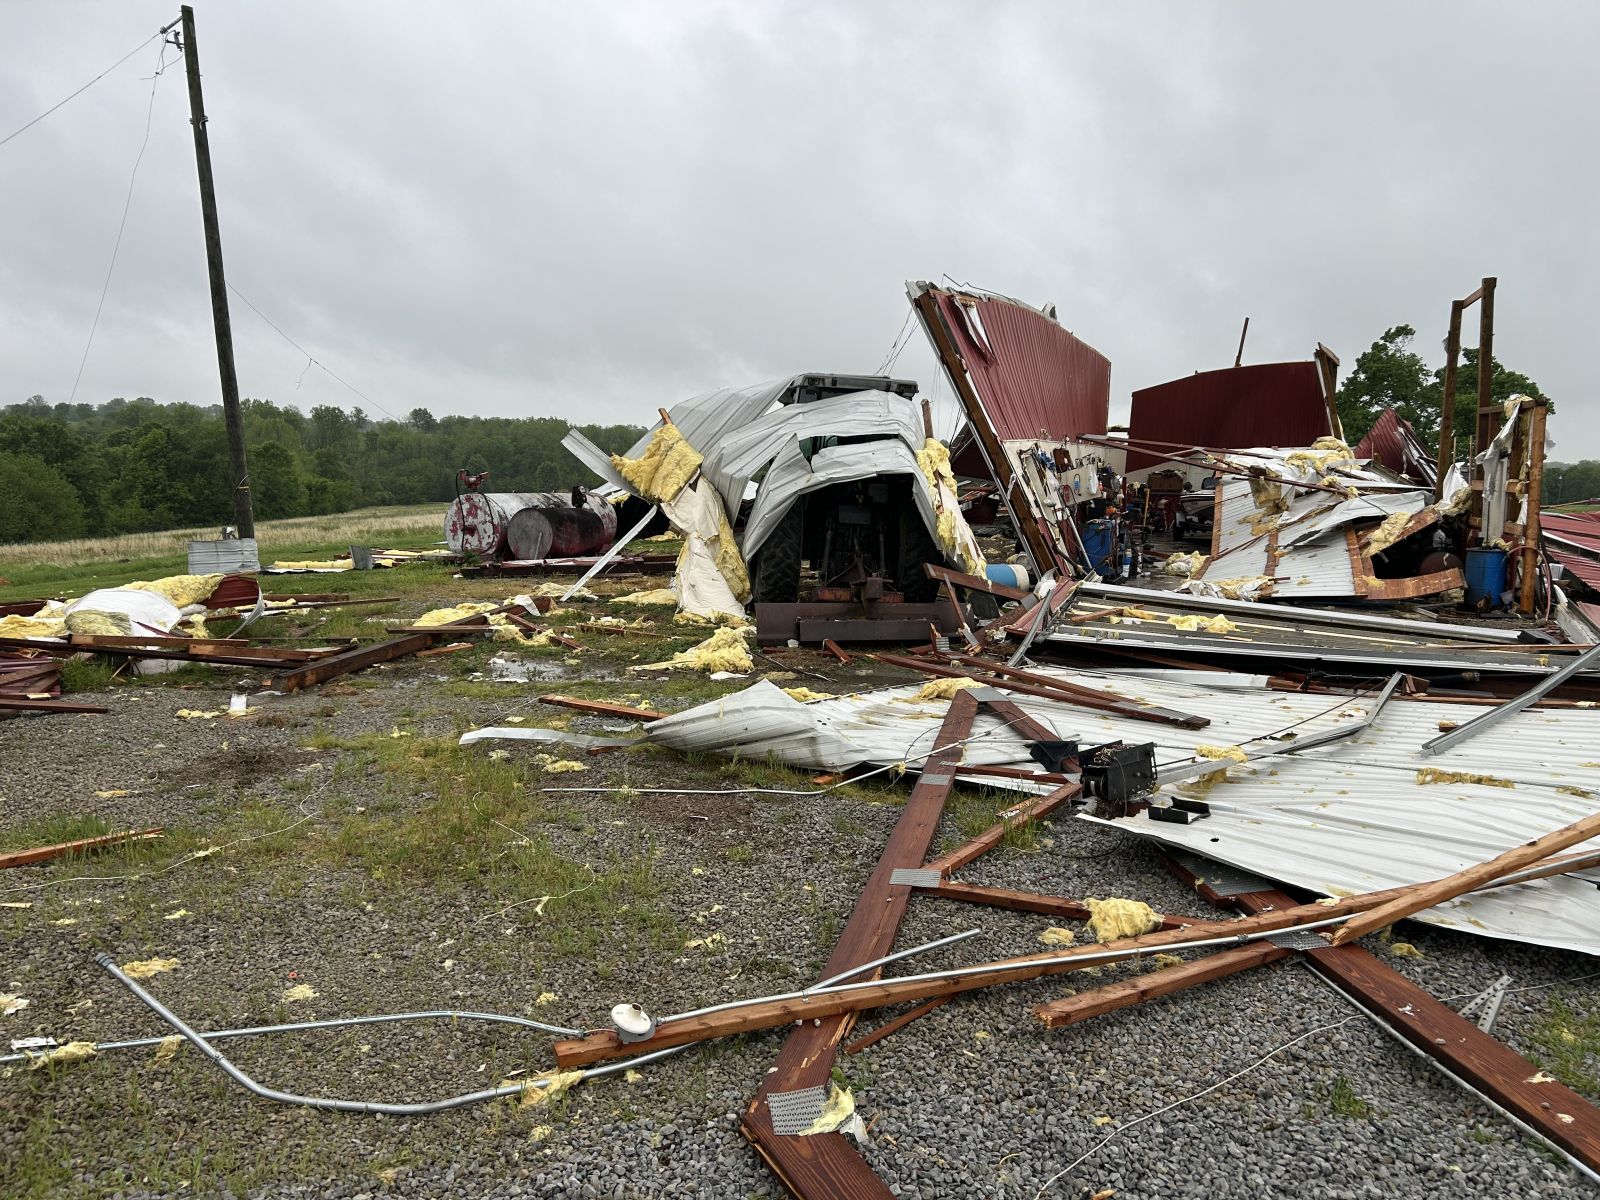
Wind
Crawford County
 |
 |
 |
 |
| Courtesy of Crawford County EMA | Courtesy of Crawford County EMA | Courtesy of Crawford County EMA | Courtesy of Crawford County EMA |
Harrison County, KY
 |
 |
 |
 |
|
Roof peeled off in Cynthiana, KY Courtesy of Melody Dawn Bills-Hubbard |
Courtesy of Harrison County, KY EMA | Courtesy of Harrison County, KY EMA | Courtesy of Harrison County, KY EMA |
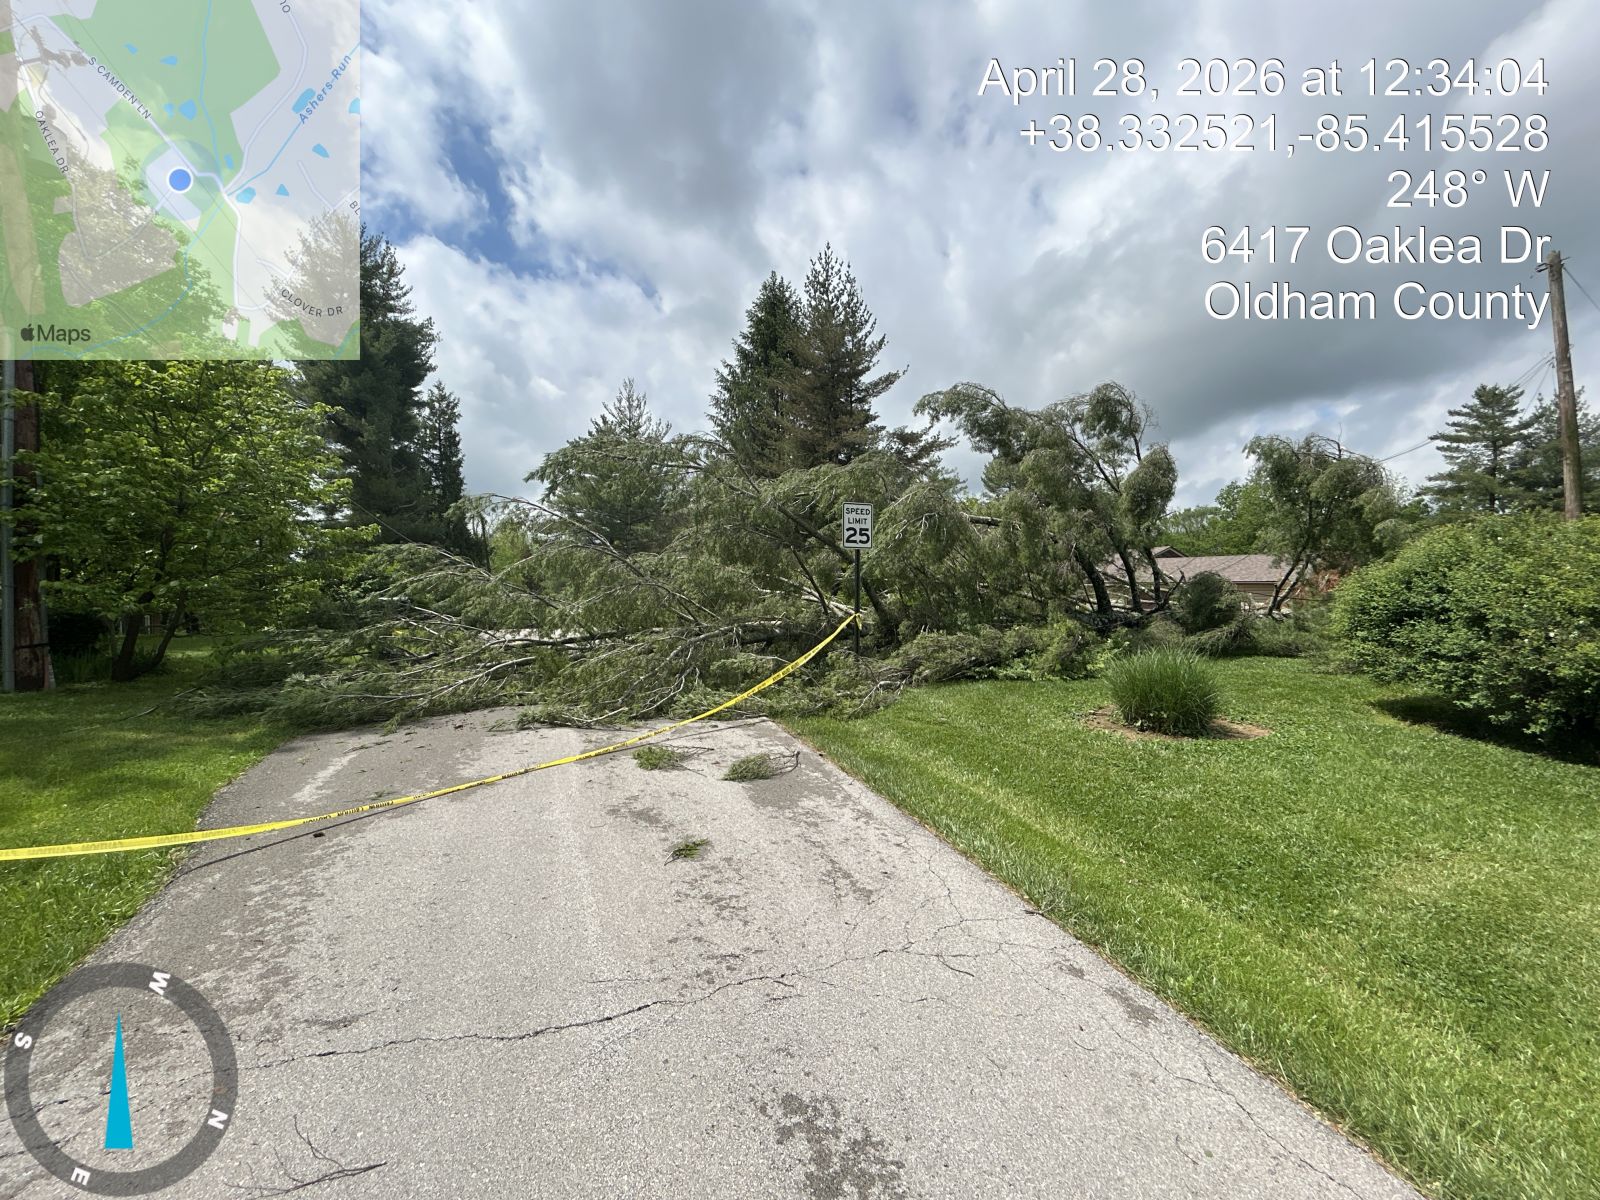
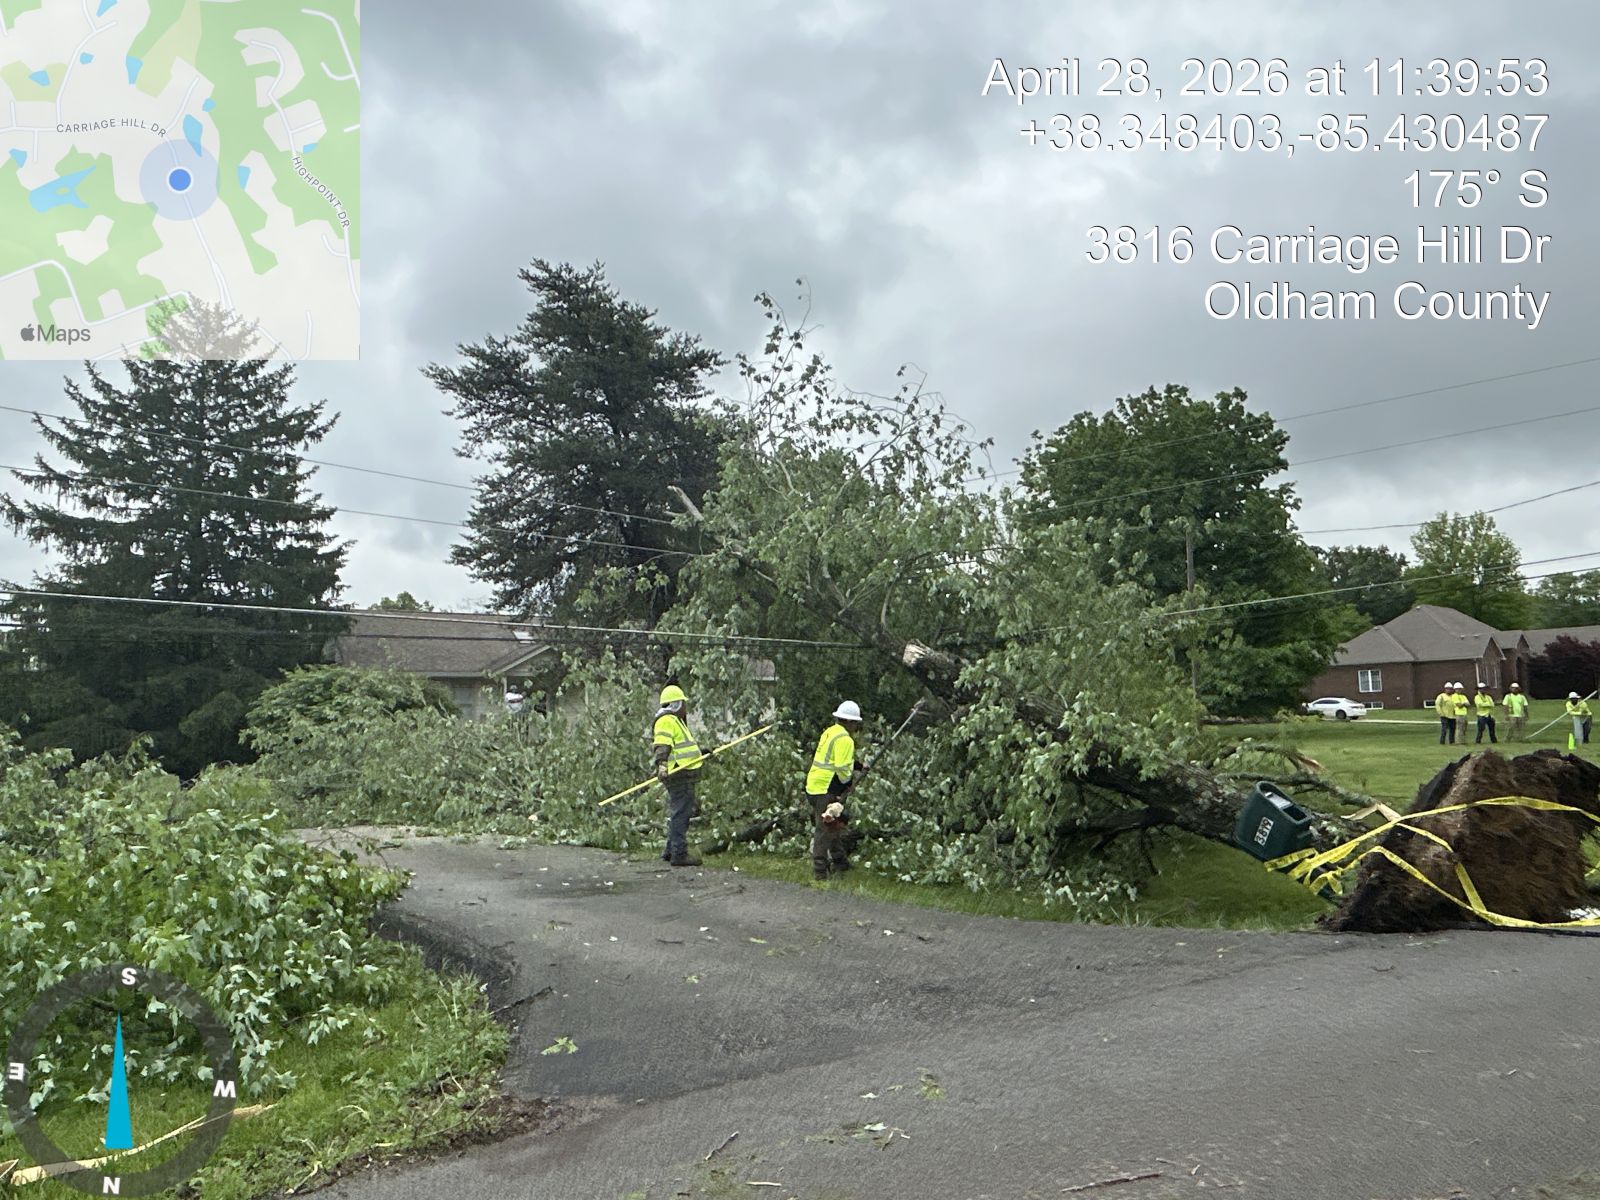
Oldham County
 |
 |
 |
 |
| Courtesy of Oldham County Aerial Response Team | Courtesy of Oldham County Aerial Response Team | Courtesy of Oldham County Aerial Response Team | Courtesy of Oldham County Aerial Response Team |
 |
 |
 |
.jpg) |
| Courtesy of Oldham County Aerial Response Team | Courtesy of Oldham County Aerial Response Team | Courtesy of Oldham County Aerial Response Team | Courtesy of Oldham County Aerial Response Team |
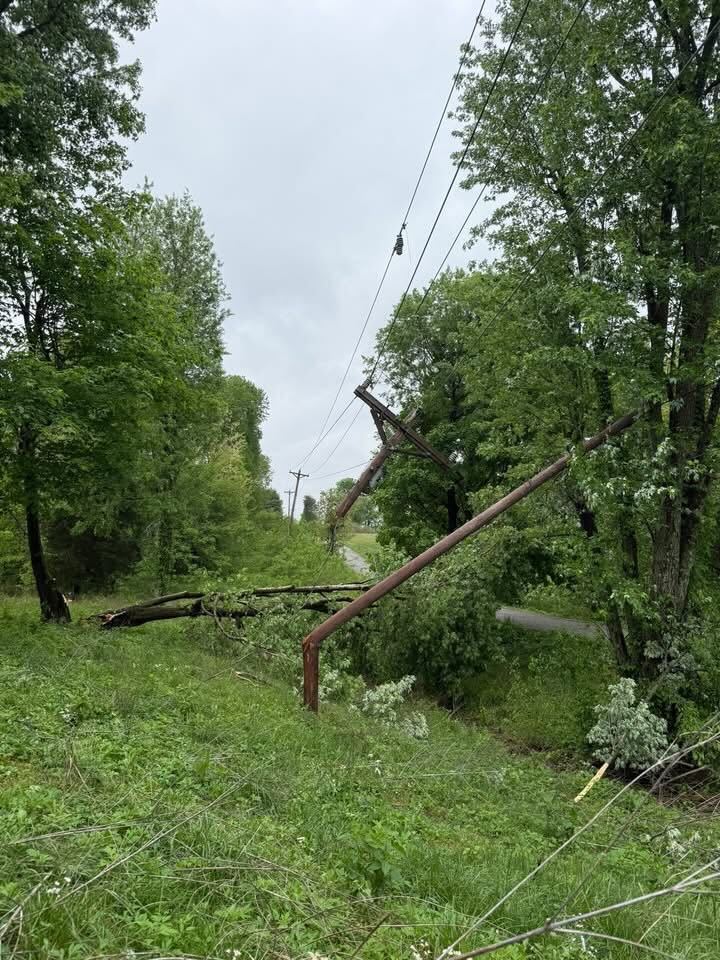
Shelby/Woodford Counties
 |
 |
 |
 |
| Barn collapse in Benson Pike area. (Shelby County) Courtesy of Chris Spaulding |
Power Poles snapped in Benson Pike area. (Shelby County) Courtesy of Chris Spaulding |
Woodford County Courtesy of Woodford EMA |
Woodford County Courtesy of Woodford EMA |
Flooding
Rainfall/Flood Reports
 |
 |
| 48-Hour Rainfall Totals | Flash Flood Reports (4/27- 4/28/2026) |
Hydrographs
 |
 |
| Blue River (IN) at Fredericksburg | Muscatatuck River at Deputy |
Drone Video
SE Oldham County Damage - Courtesy of Oldham County Aerial Response Team
Environment
 |
 |
 |
| Figure 1: 300mb Analysis Map | Figure 2: 500mb Analysis Map | Figure 3: 850mb Analysis Map |
 |
| Figure 4: Surface Analysis Map |
 |
 |
 |
| Figure 4: LCL Heights | Figure 5: MUCAPE, MUCIN, and Effective Bulk Shear | Figure 6: Surface to 3km Shear |
 |
 |
 |
| Figure 4: 0-3km Storm Relative Helicity | Figure 5: Precipitable Water | Figure 6: 700 - 500mb Lapse Rates |
Additional Information
The Forecast
 |
 |
 |
 |
| SPC Day 1 Categorical Outlook | SPC Day 1 Tornado Outlook | SPC Day 1 Wind Outlook | SPC Day 1 Hail Outlook |
 |
 |
||
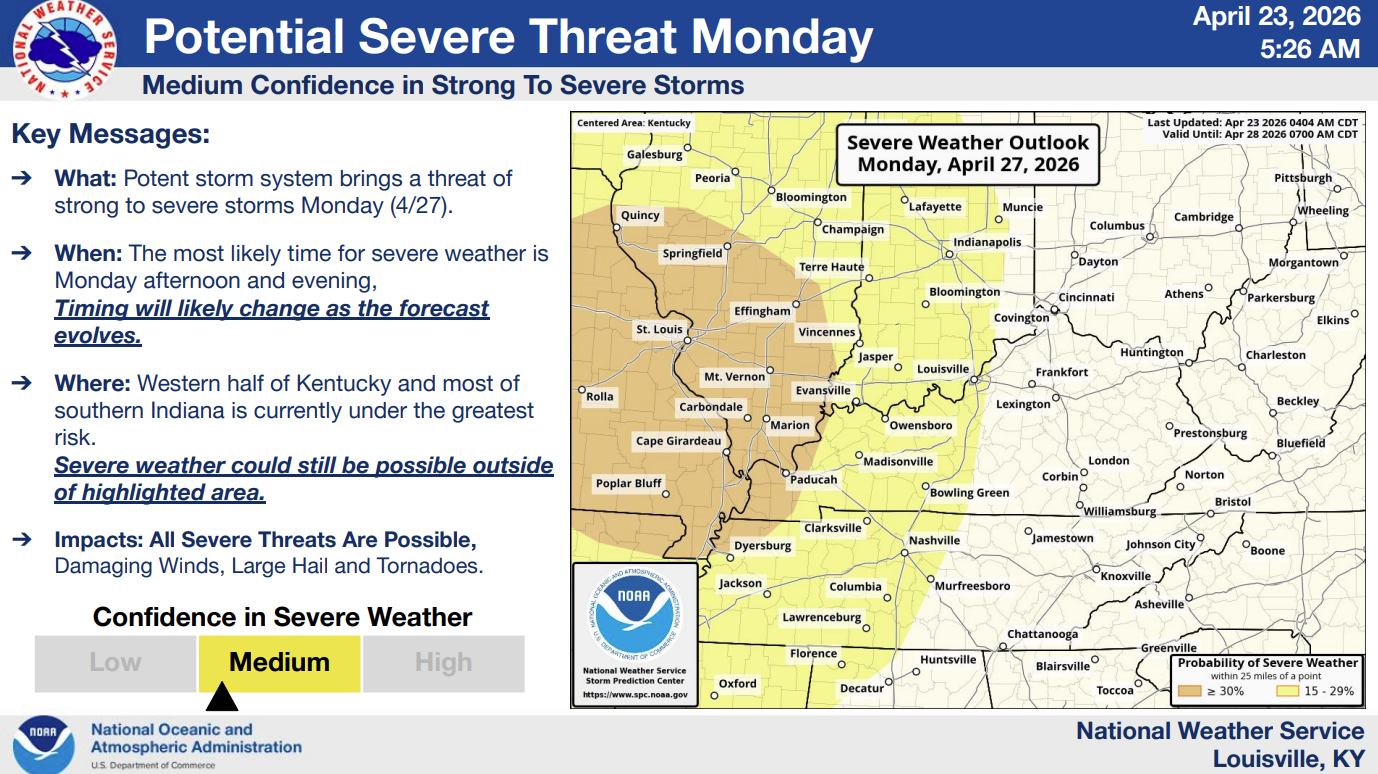
| Day 5 briefing slide to community partners (advertised in our AFD as early as 7 days out) | Day 1 briefing slide to the public |
NWS video briefing ahead of severe weather Monday 4/27/2026
 |
Media use of NWS Web News Stories is encouraged! Please acknowledge the NWS as the source of any news information accessed from this site. |
|


 Weather Story
 Weather Map
 Local Radar