Overview
A line of showers and thunderstorms developed in the early morning hours of February 10, 2024, ahead of a cold front in an environment that had very strong shear but little instability. The storms, mainly in southern Indiana and portions of north-central Kentucky, ended up morphing into a convective line that produced both wind damage and isolated tornadoes before weakening and pushing east of the region by sunrise. A total of two small, short-lived EF-1 tornadoes developed with the line.
Tornadoes:
|
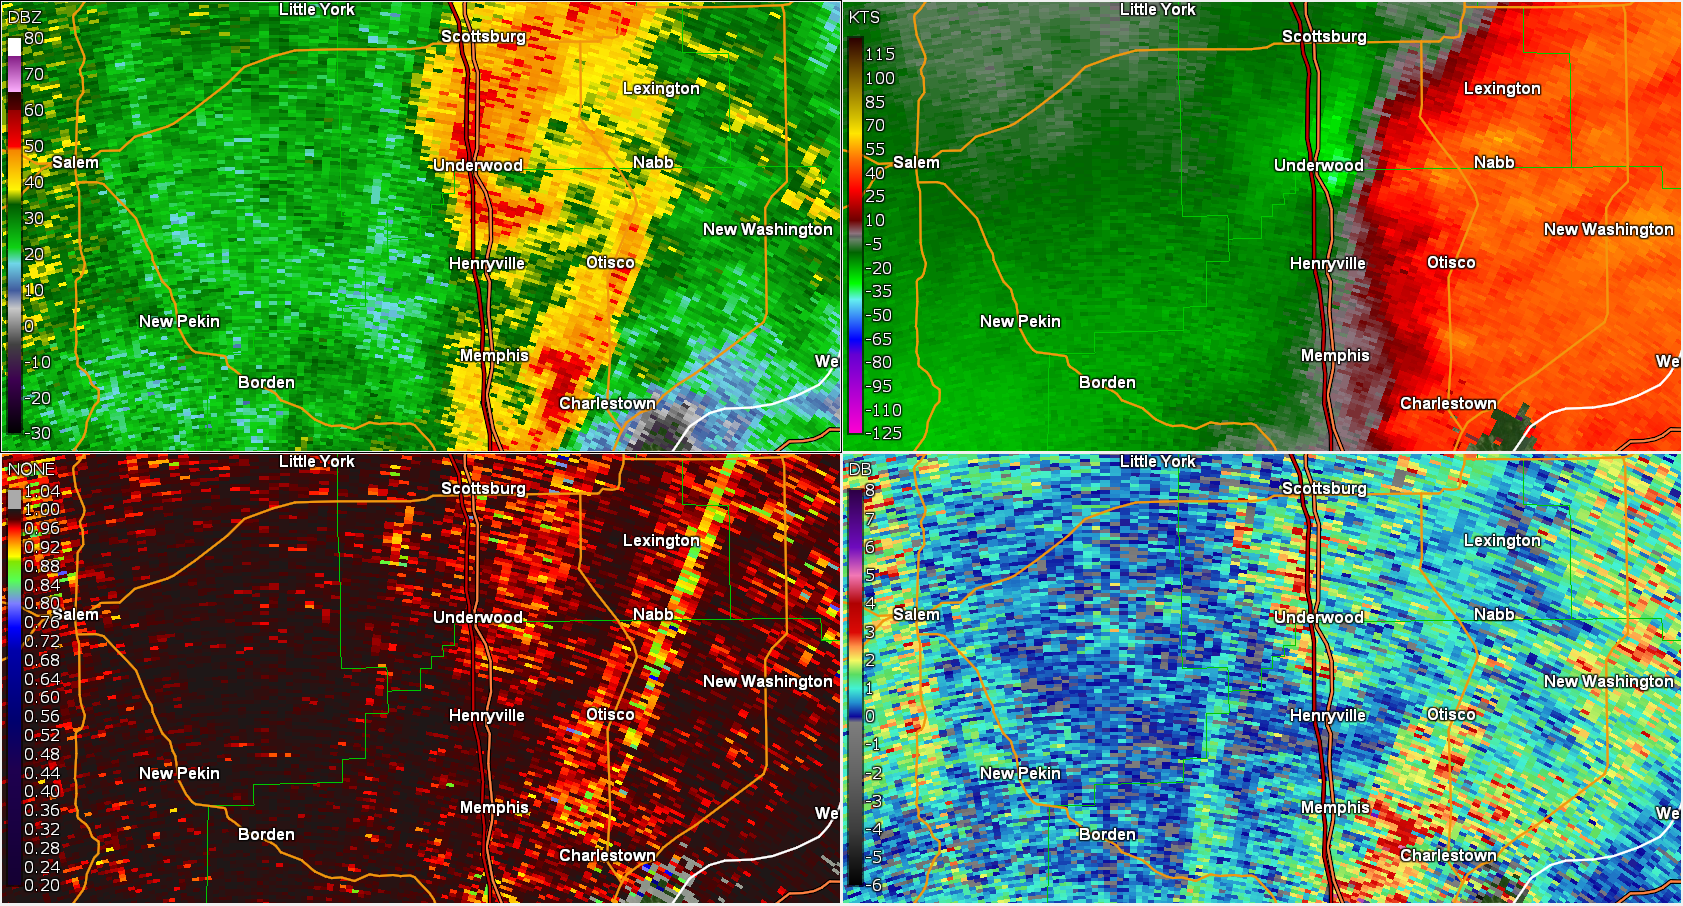
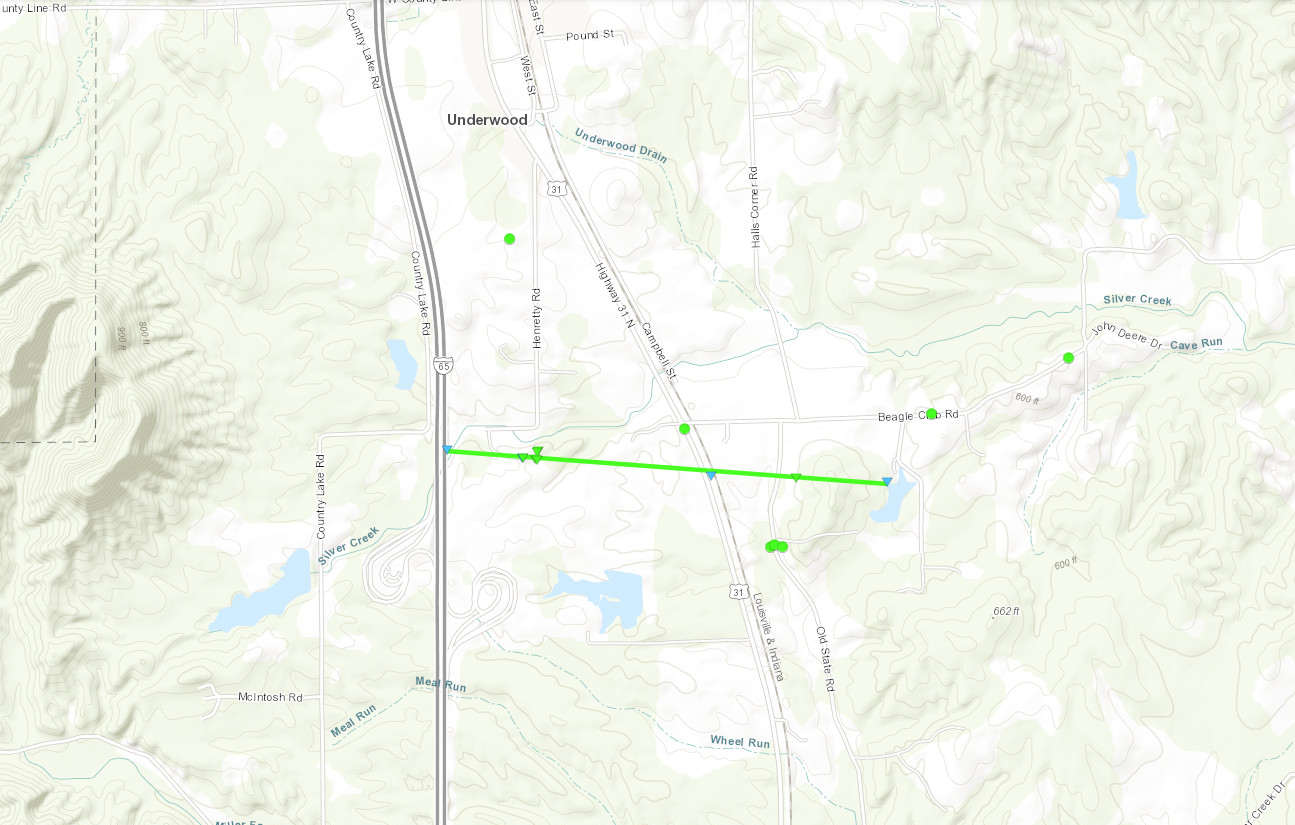
Tornado - Underwood, IN
|
||||||||||||||||
|
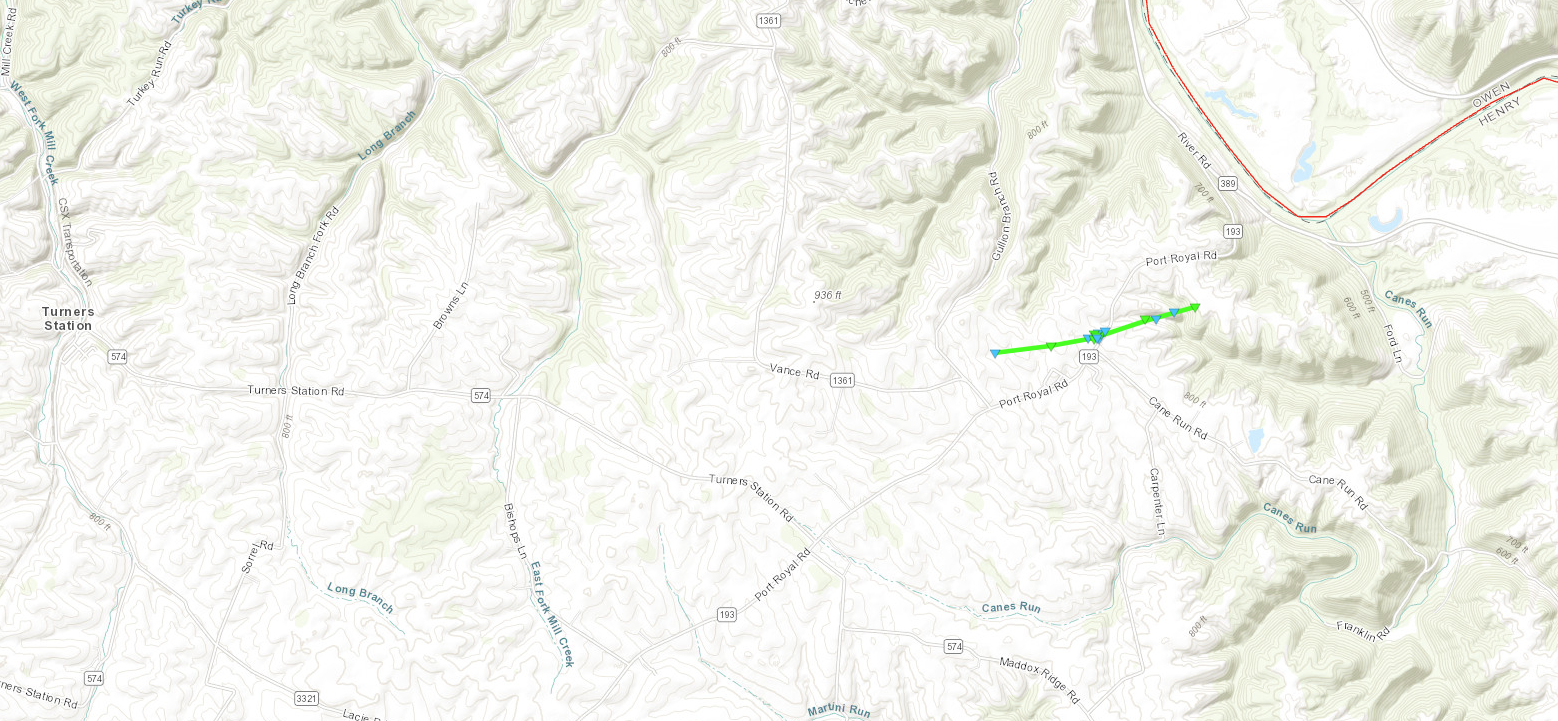
Tornado - Port Royal, KY
|
||||||||||||||||
The Enhanced Fujita (EF) Scale classifies tornadoes into the following categories:
| EF0 Weak 65-85 mph |
EF1 Moderate 86-110 mph |
EF2 Significant 111-135 mph |
EF3 Severe 136-165 mph |
EF4 Extreme 166-200 mph |
EF5 Catastrophic 200+ mph |
 |
|||||
Storm Damage Reports
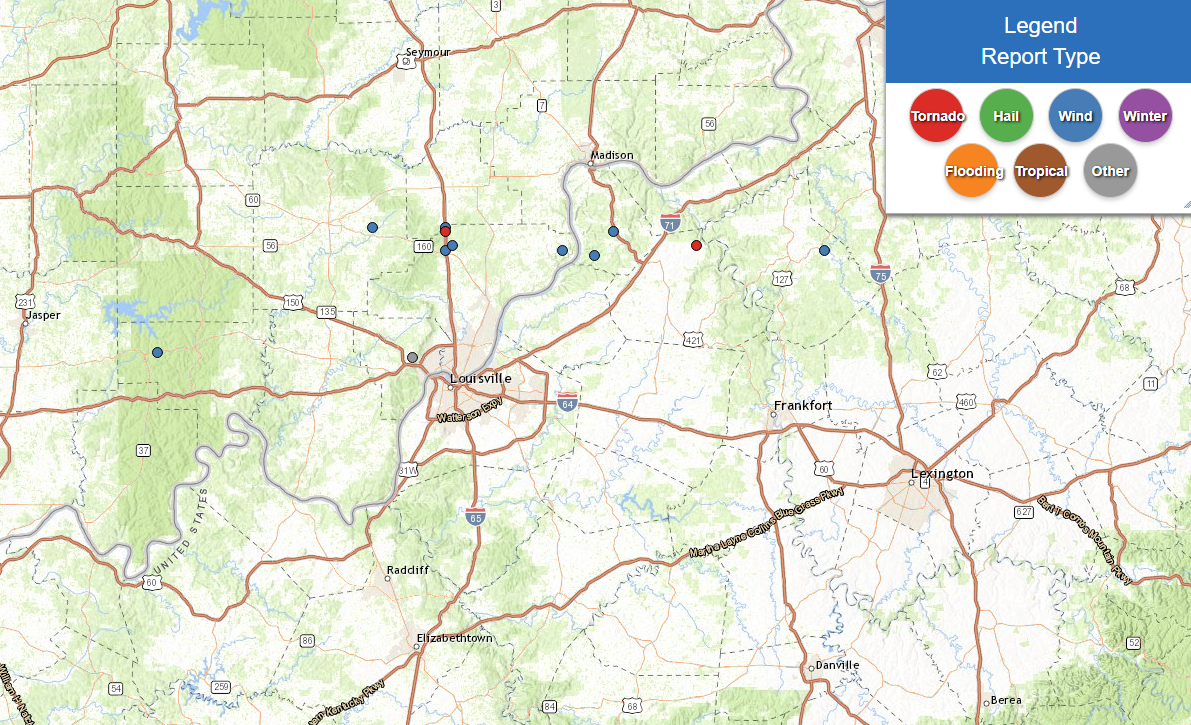
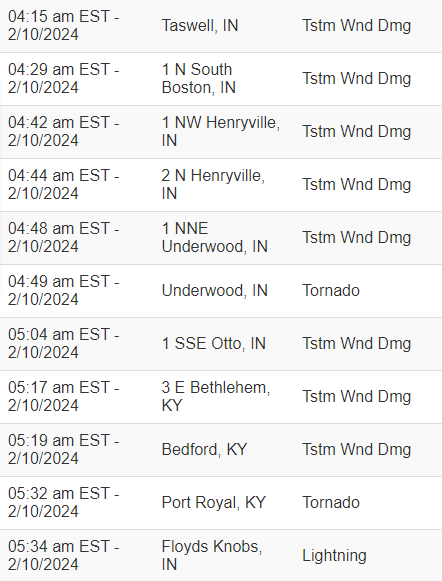
Wind
Significant straight-line winds of 65-85 mph impacted portions of Washington and Clark counties in Indiana and Trimble County in Kentucky.
 |
 |
 |
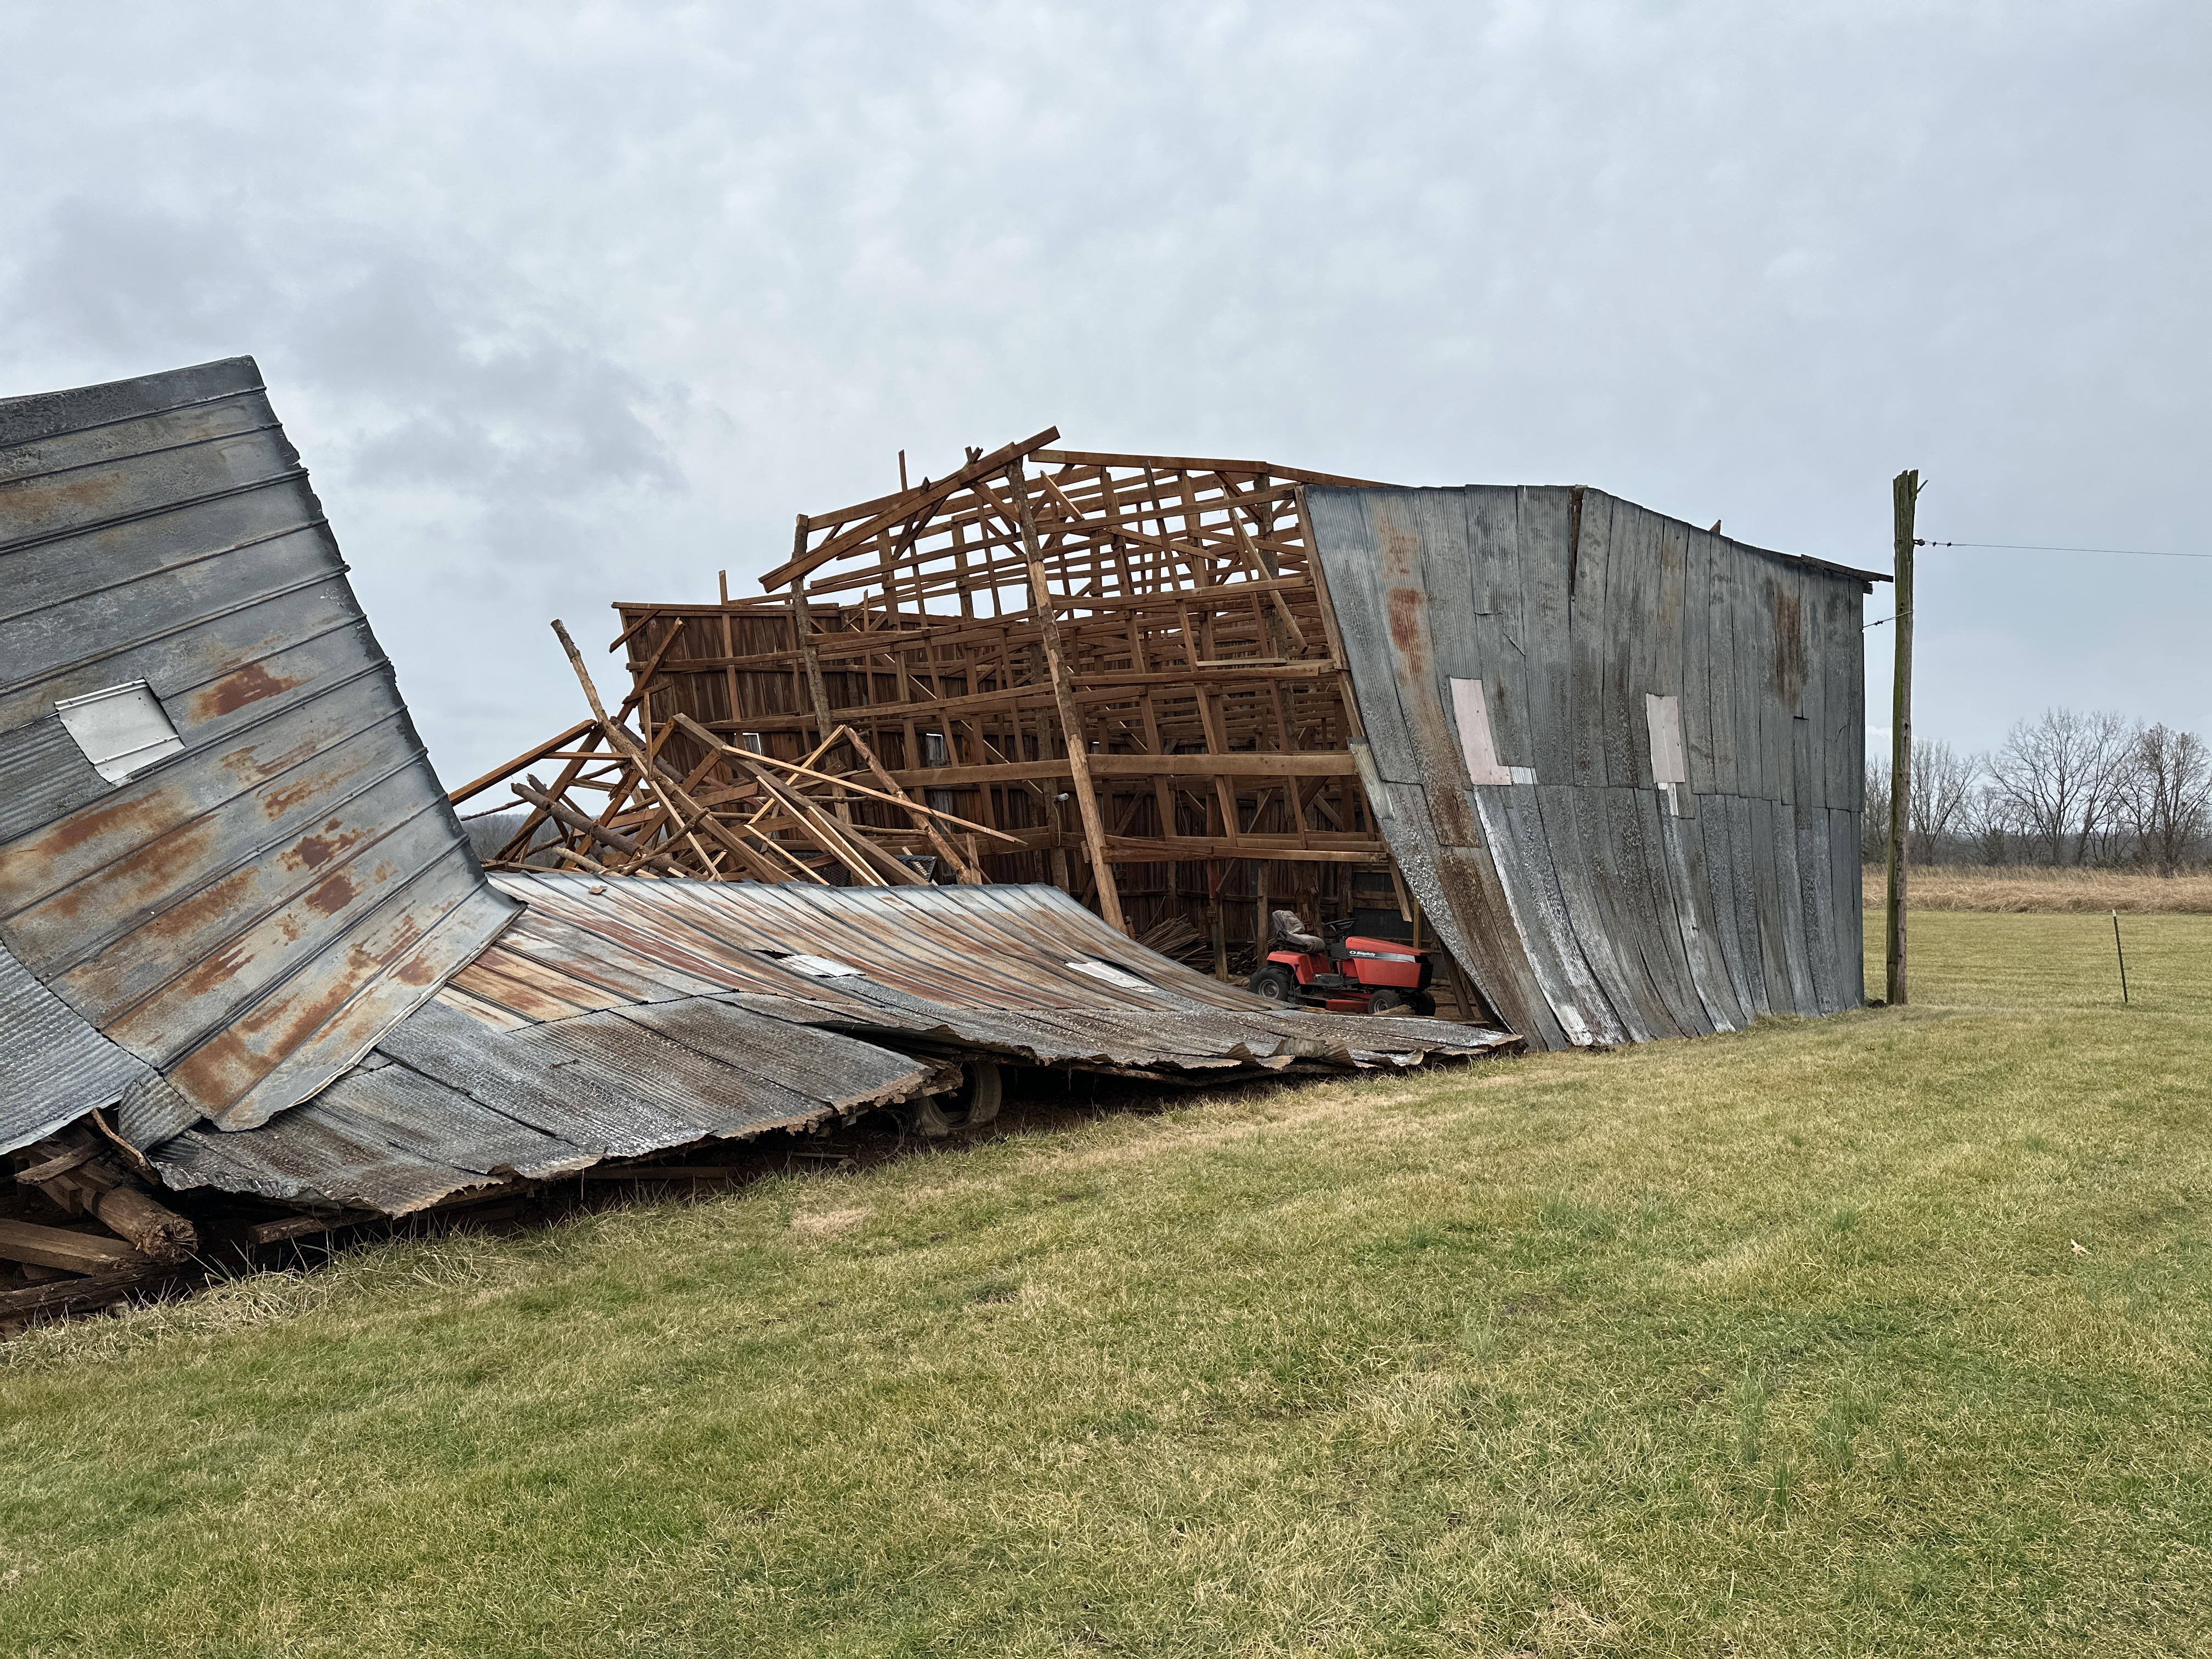 |
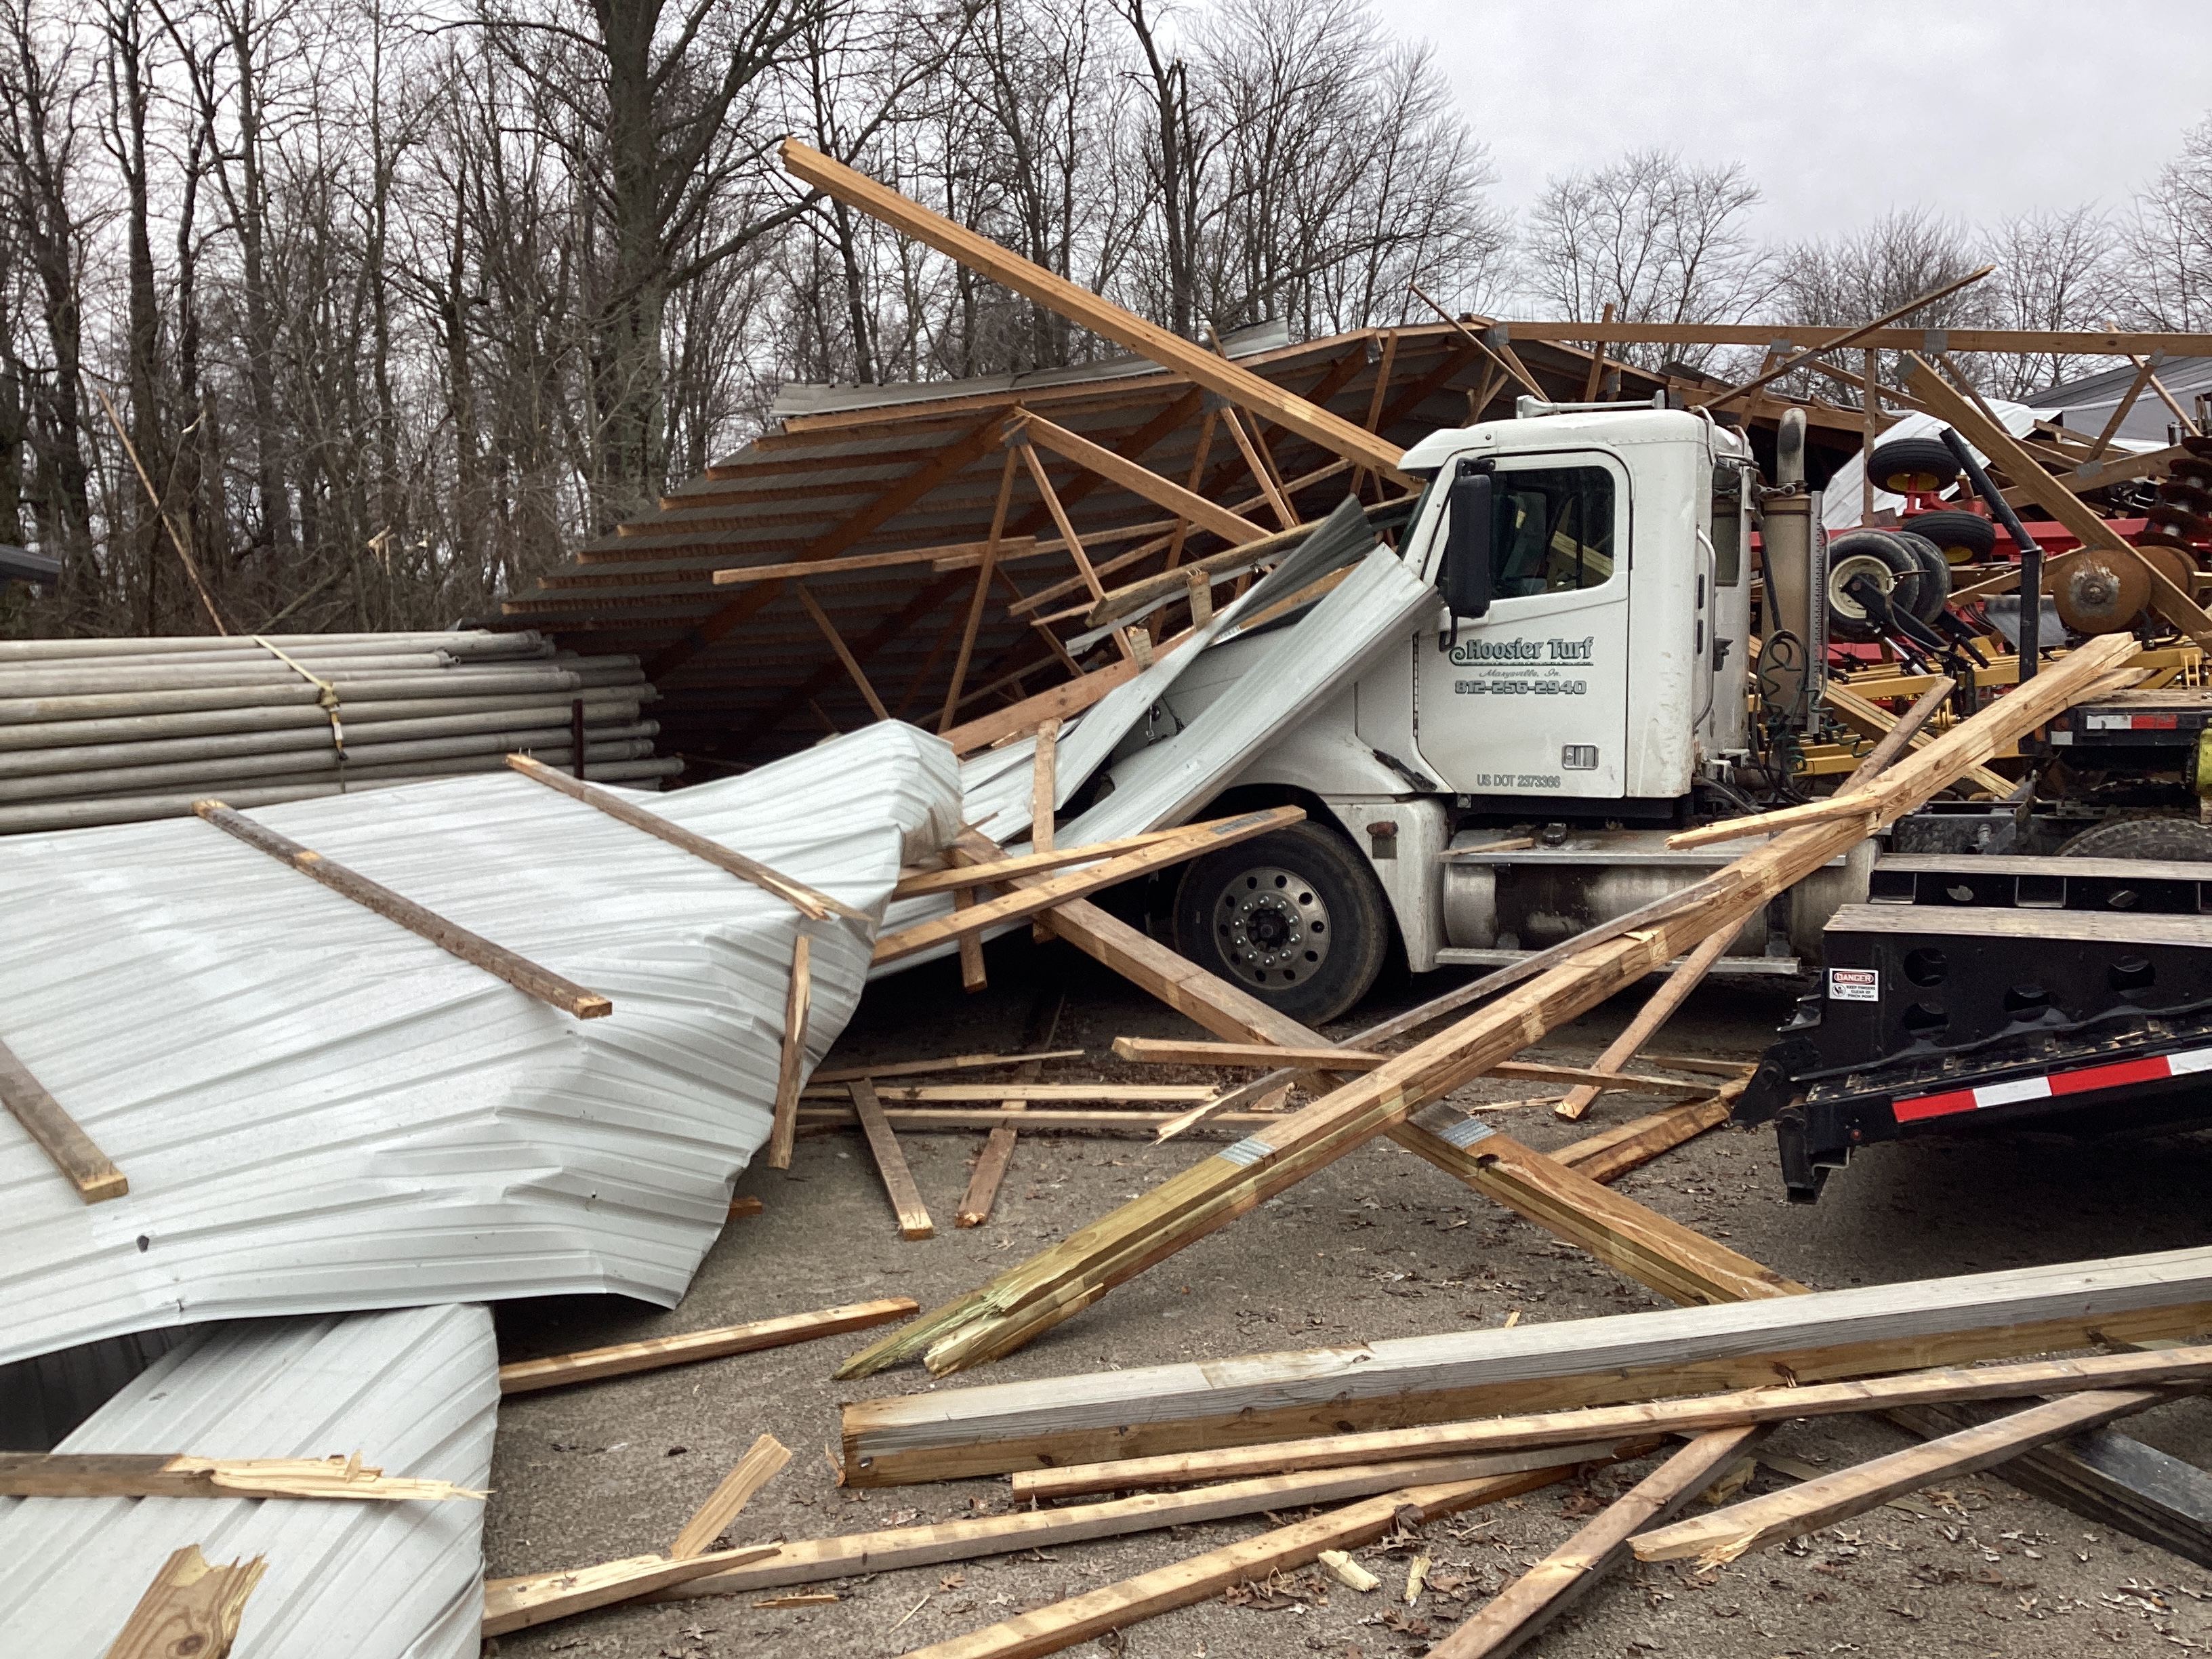
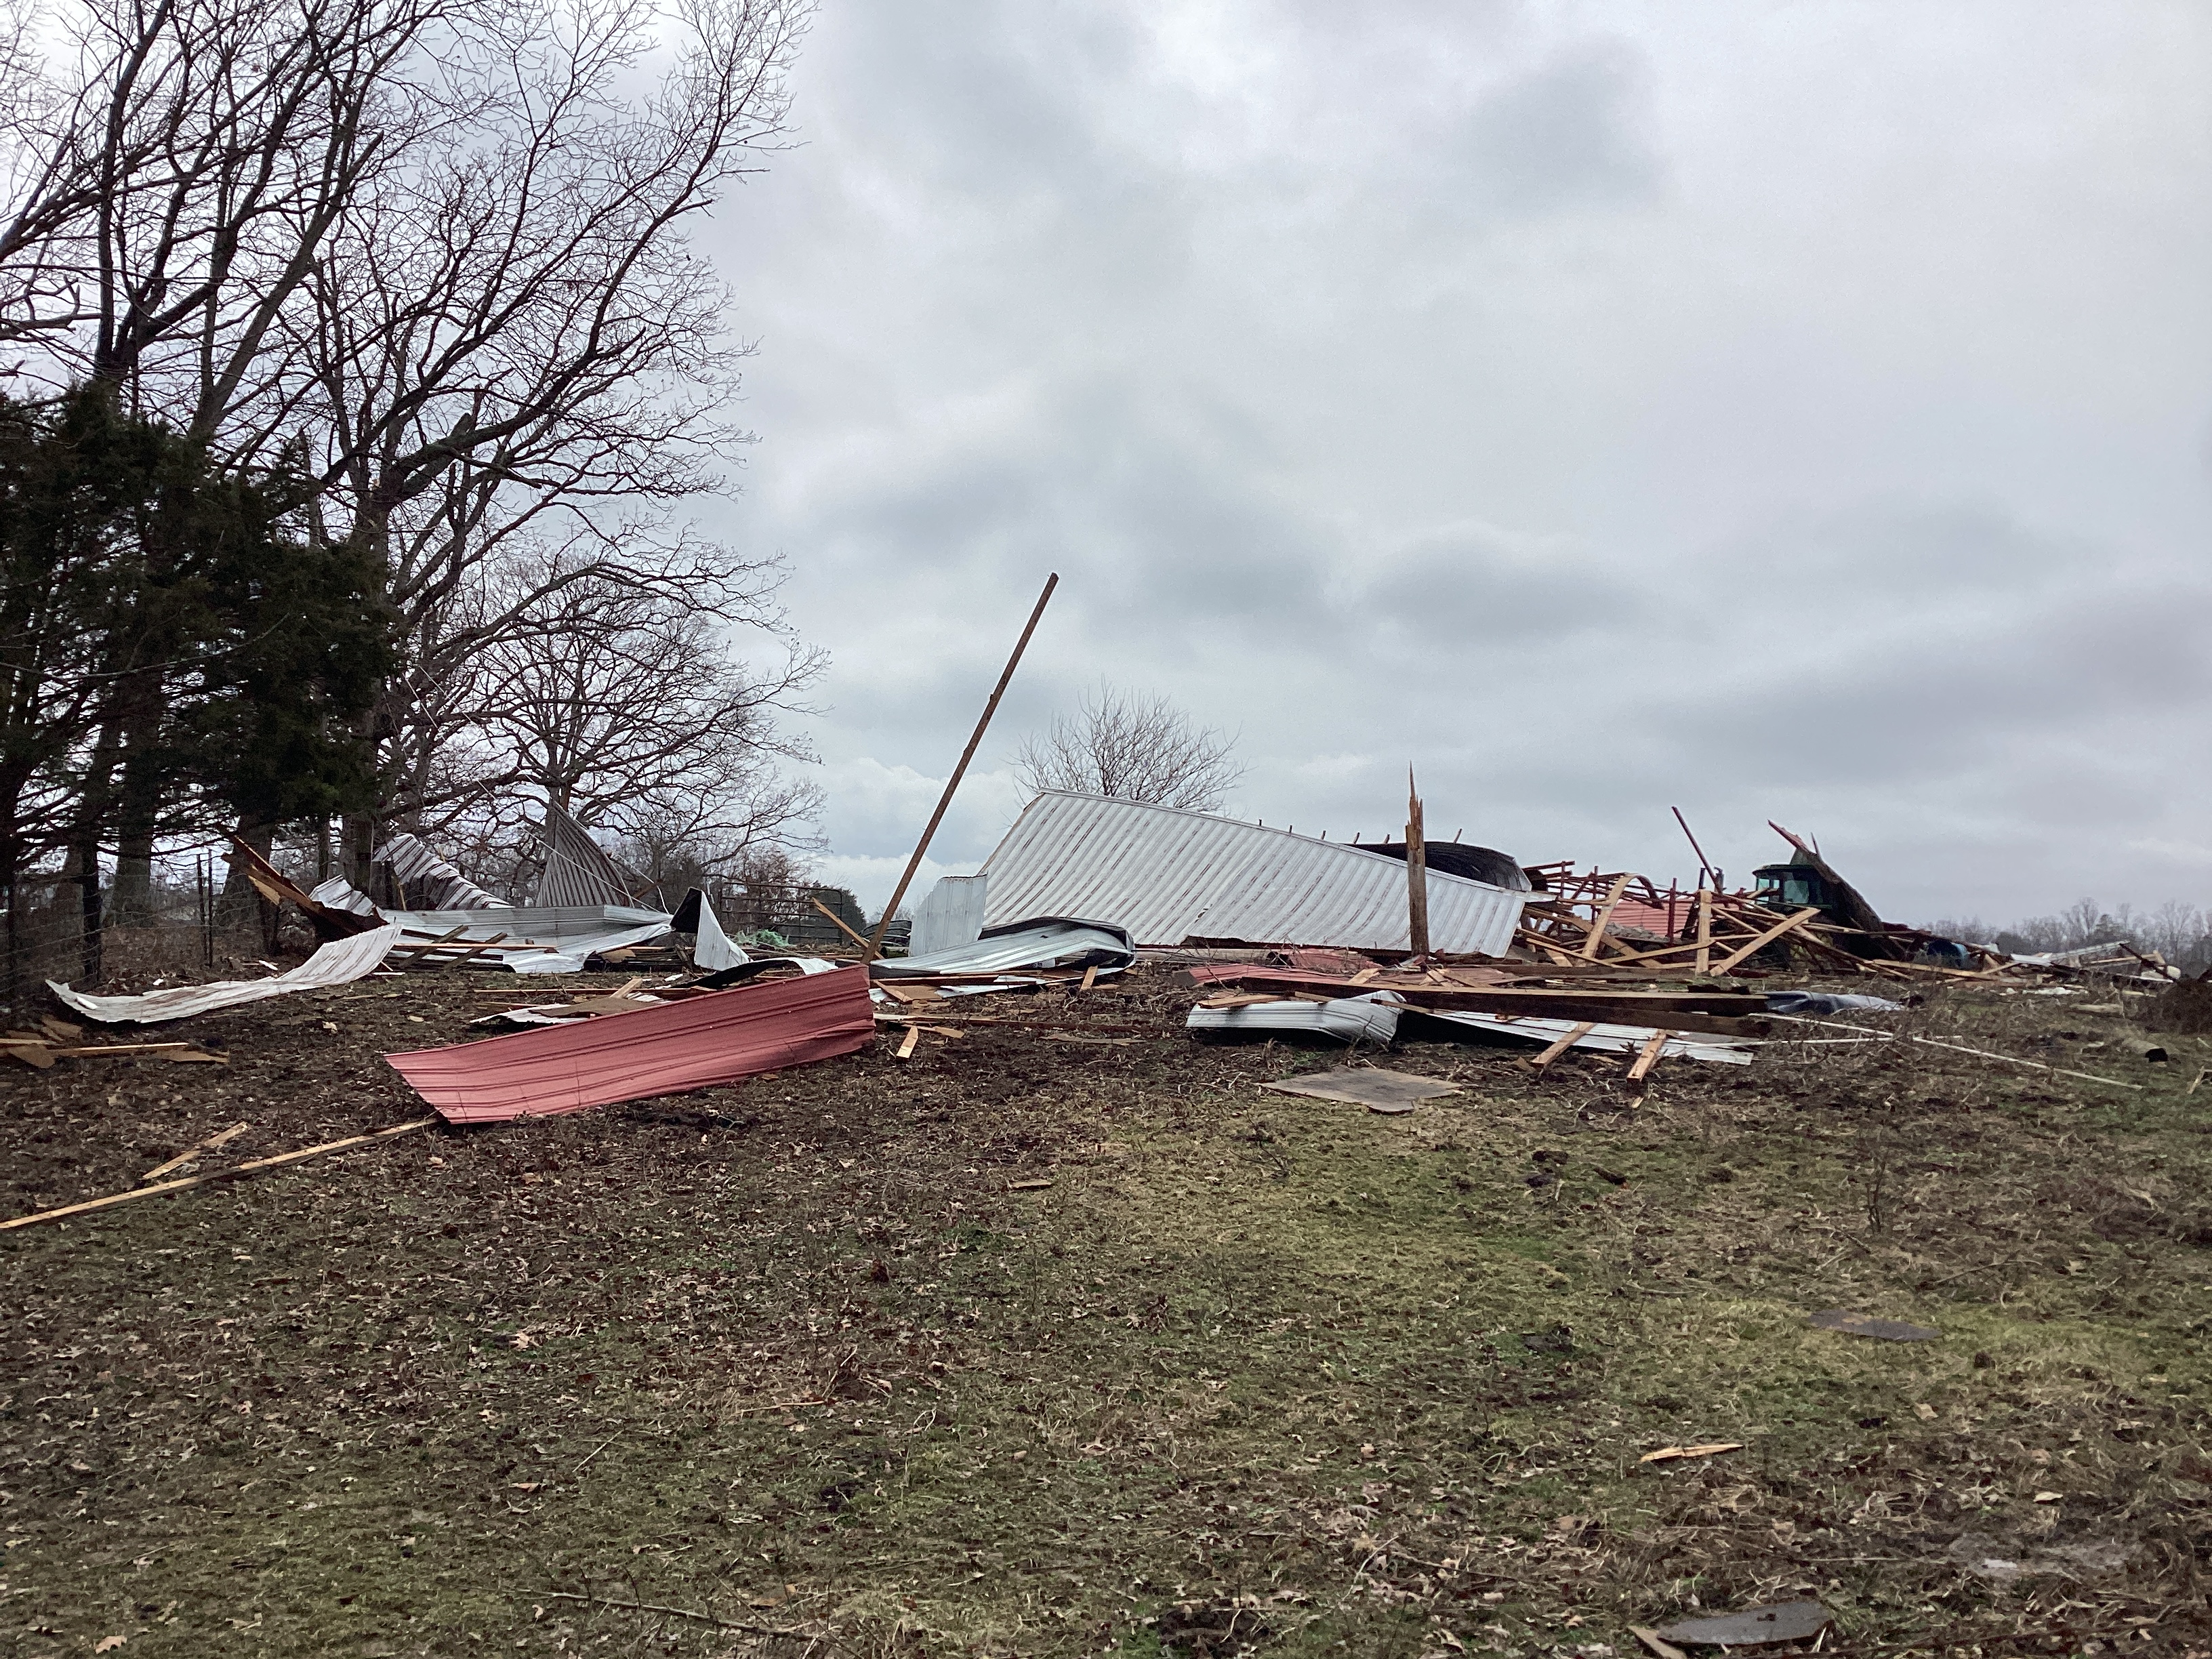
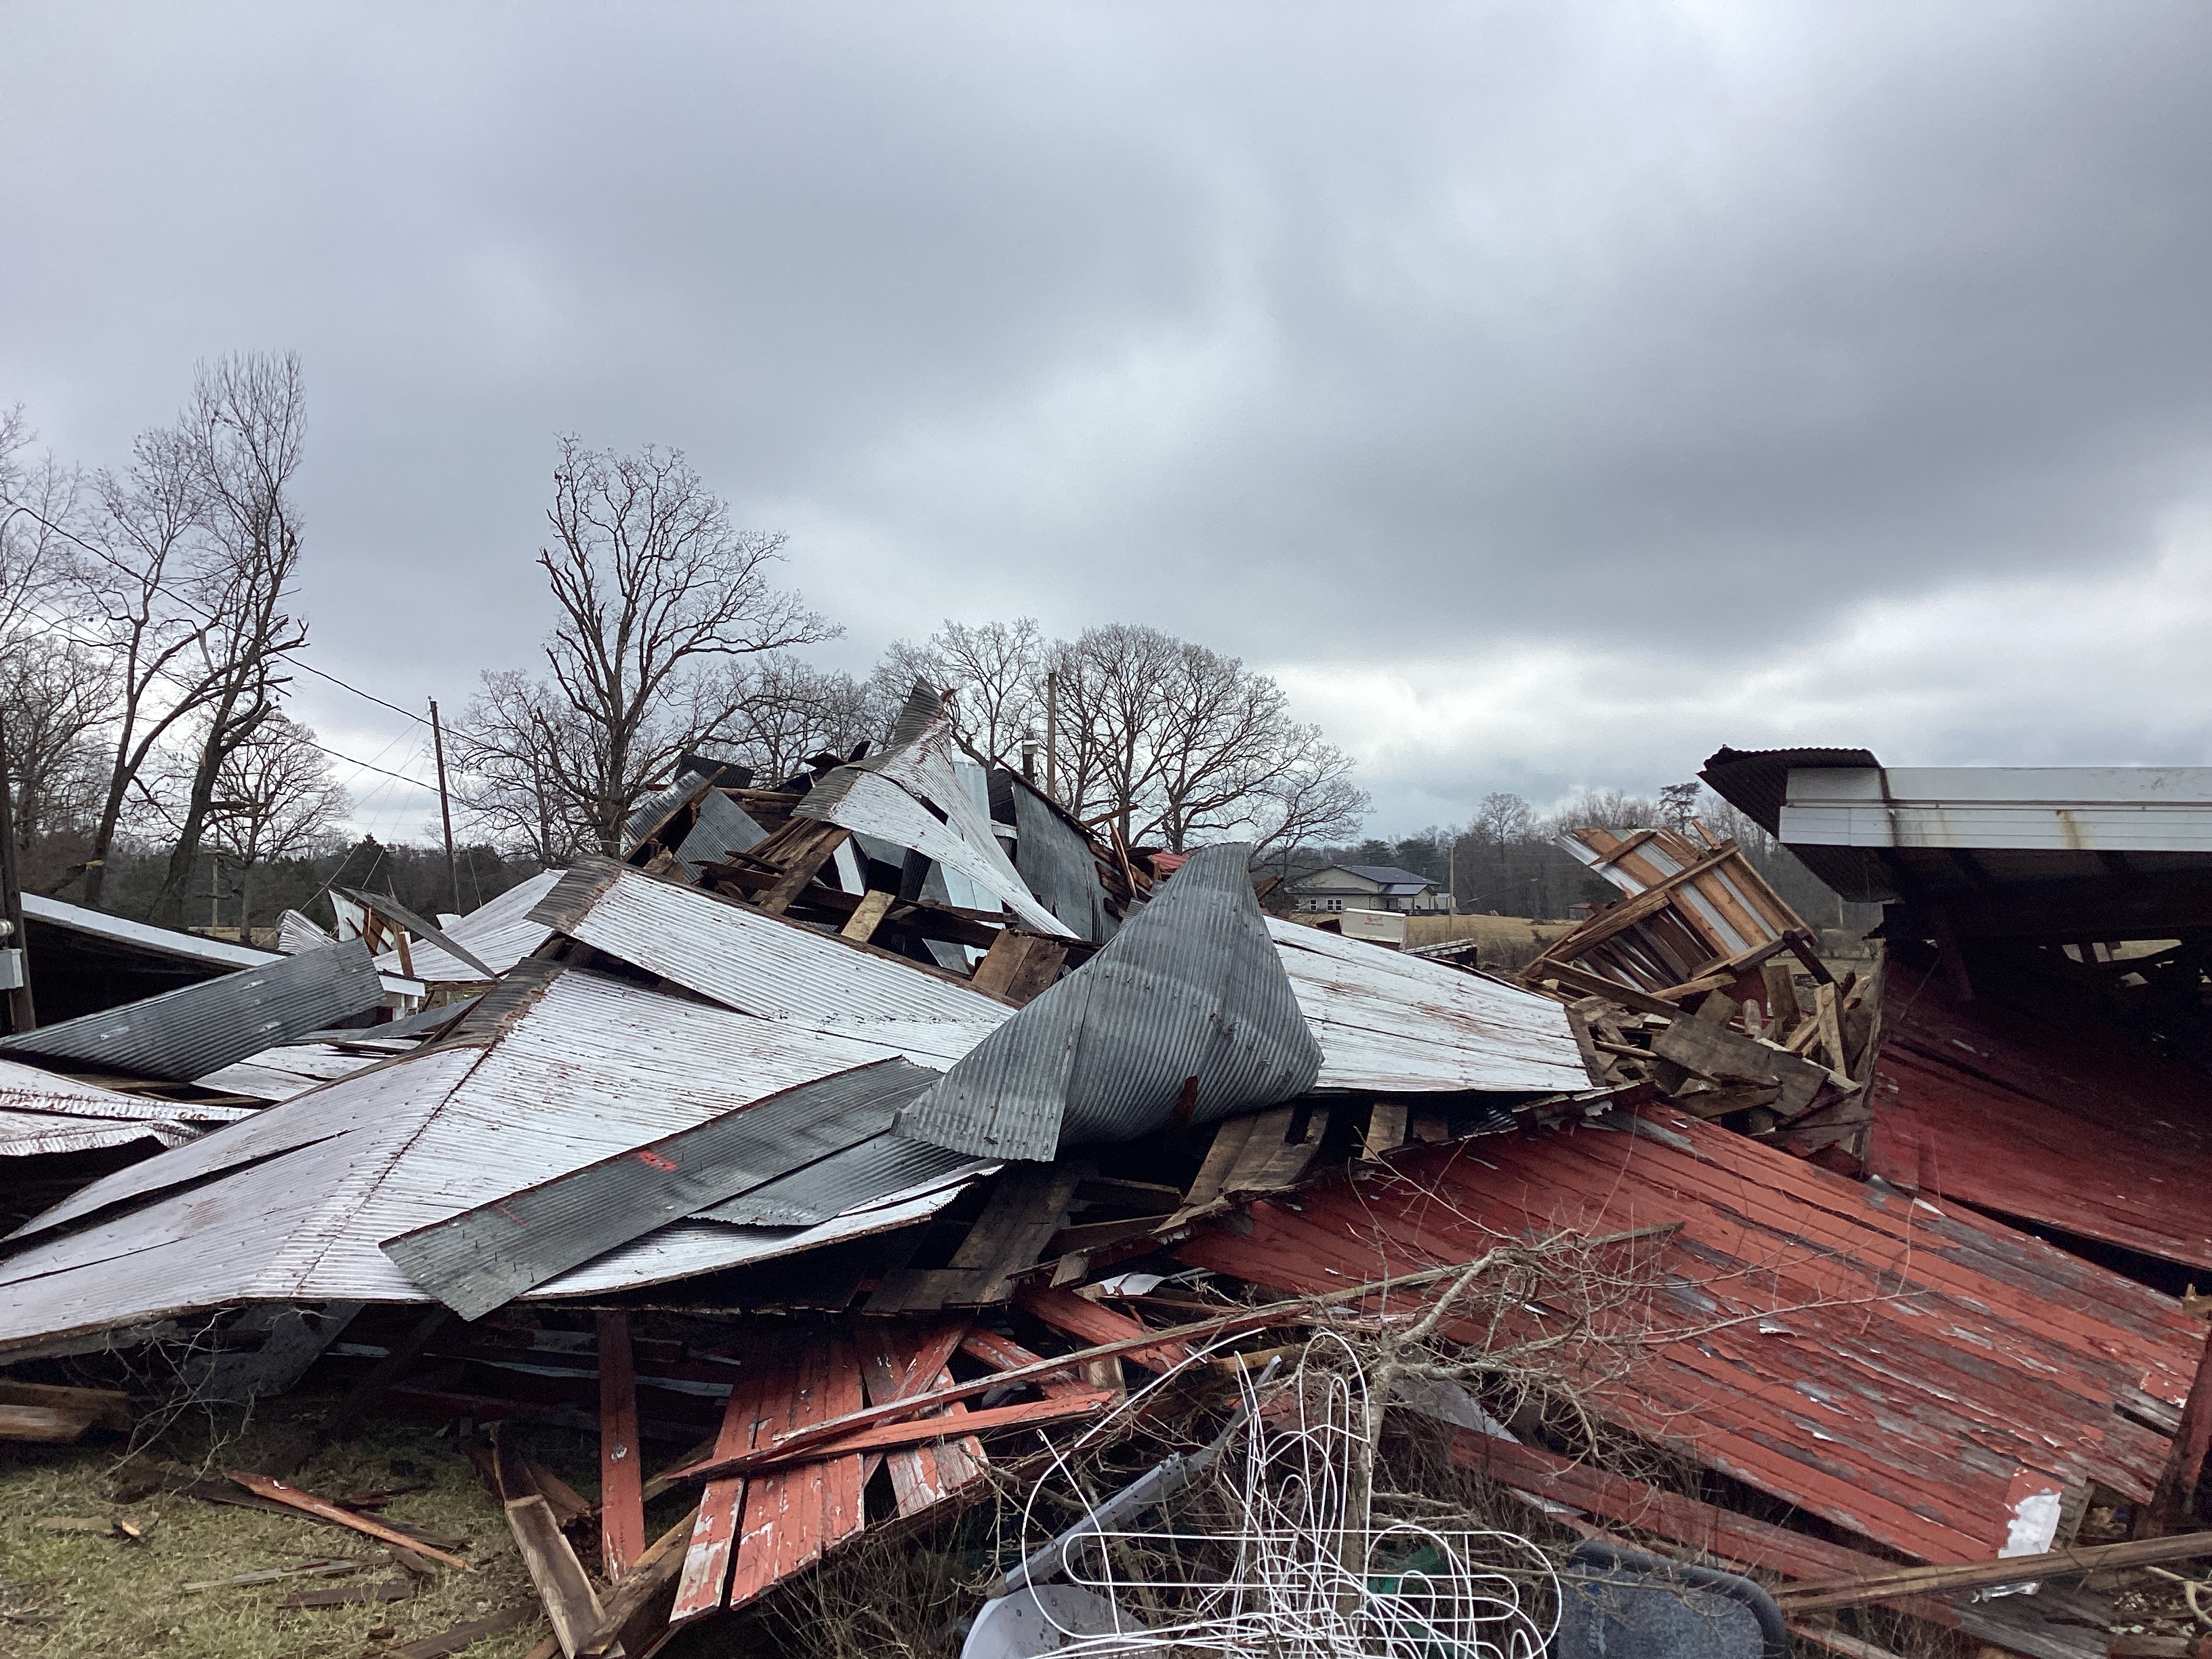
| Straight-Line Wind Damage in eastern Washington County, Indiana | Straight-Line Wind Damage near Underwood, Indiana | Straight-Line Wind Damage near Marysville, Indiana | Straight-Line Wind Damage in Trimble County, Kentucky |
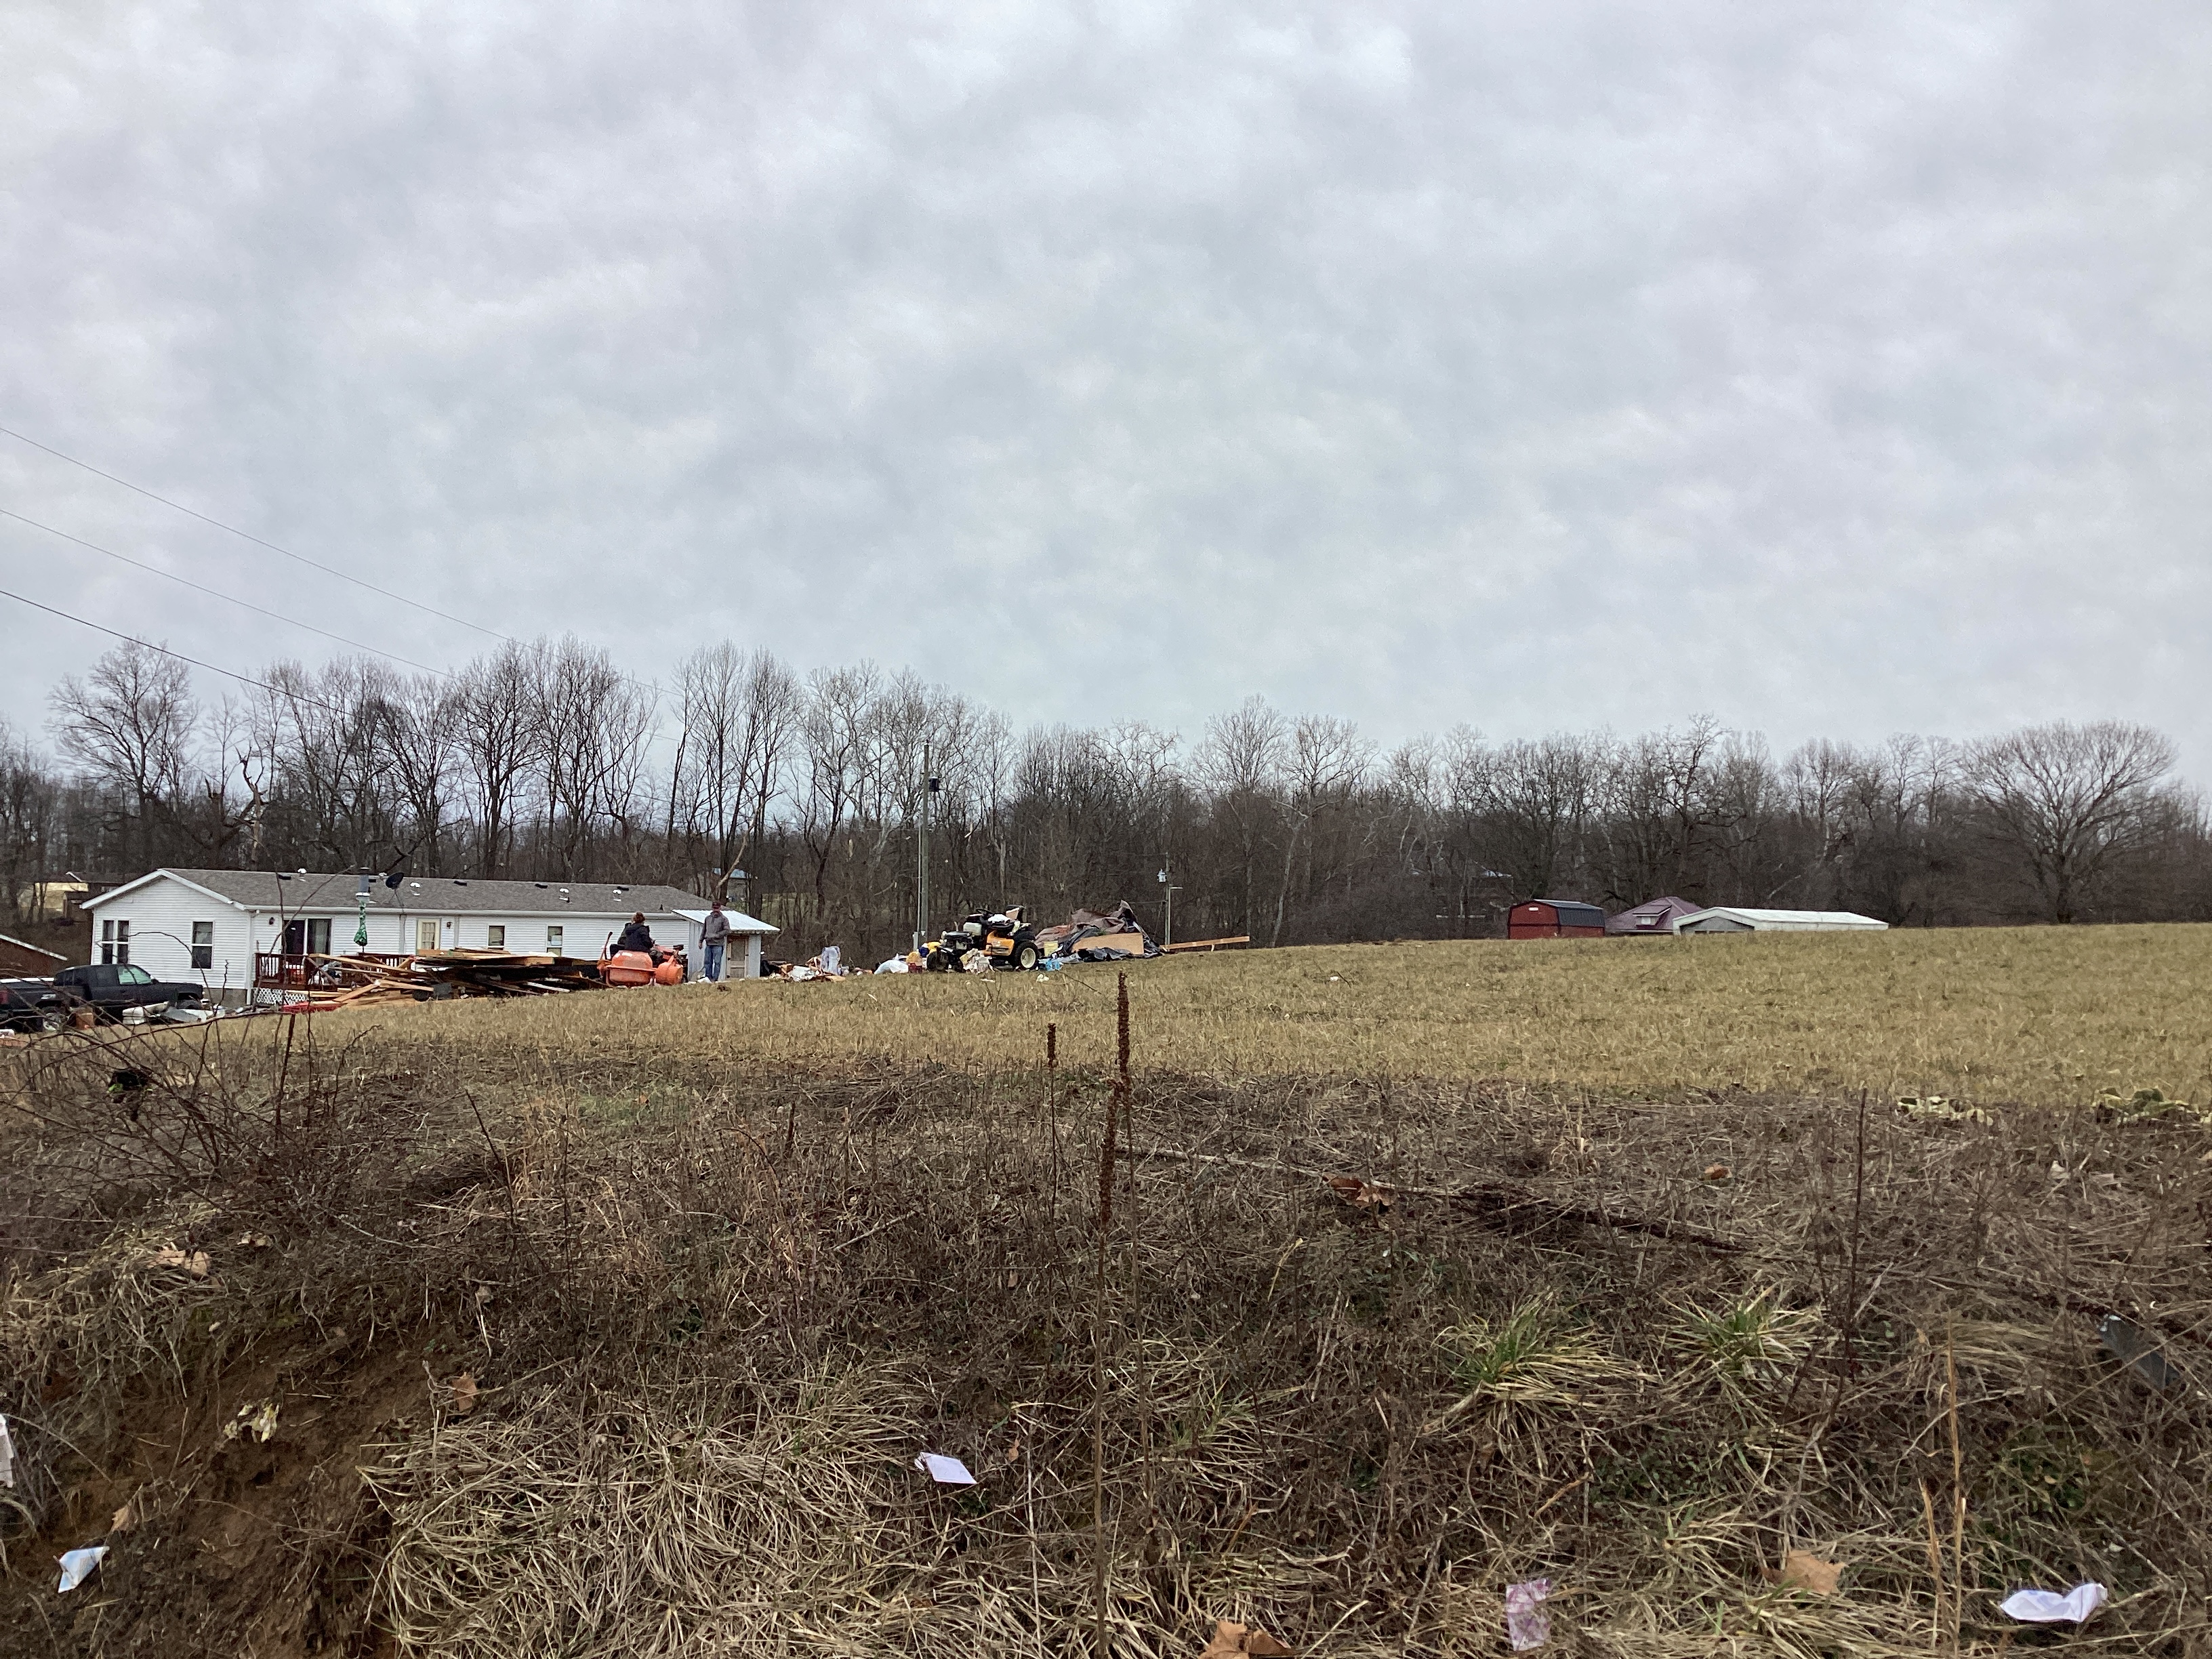
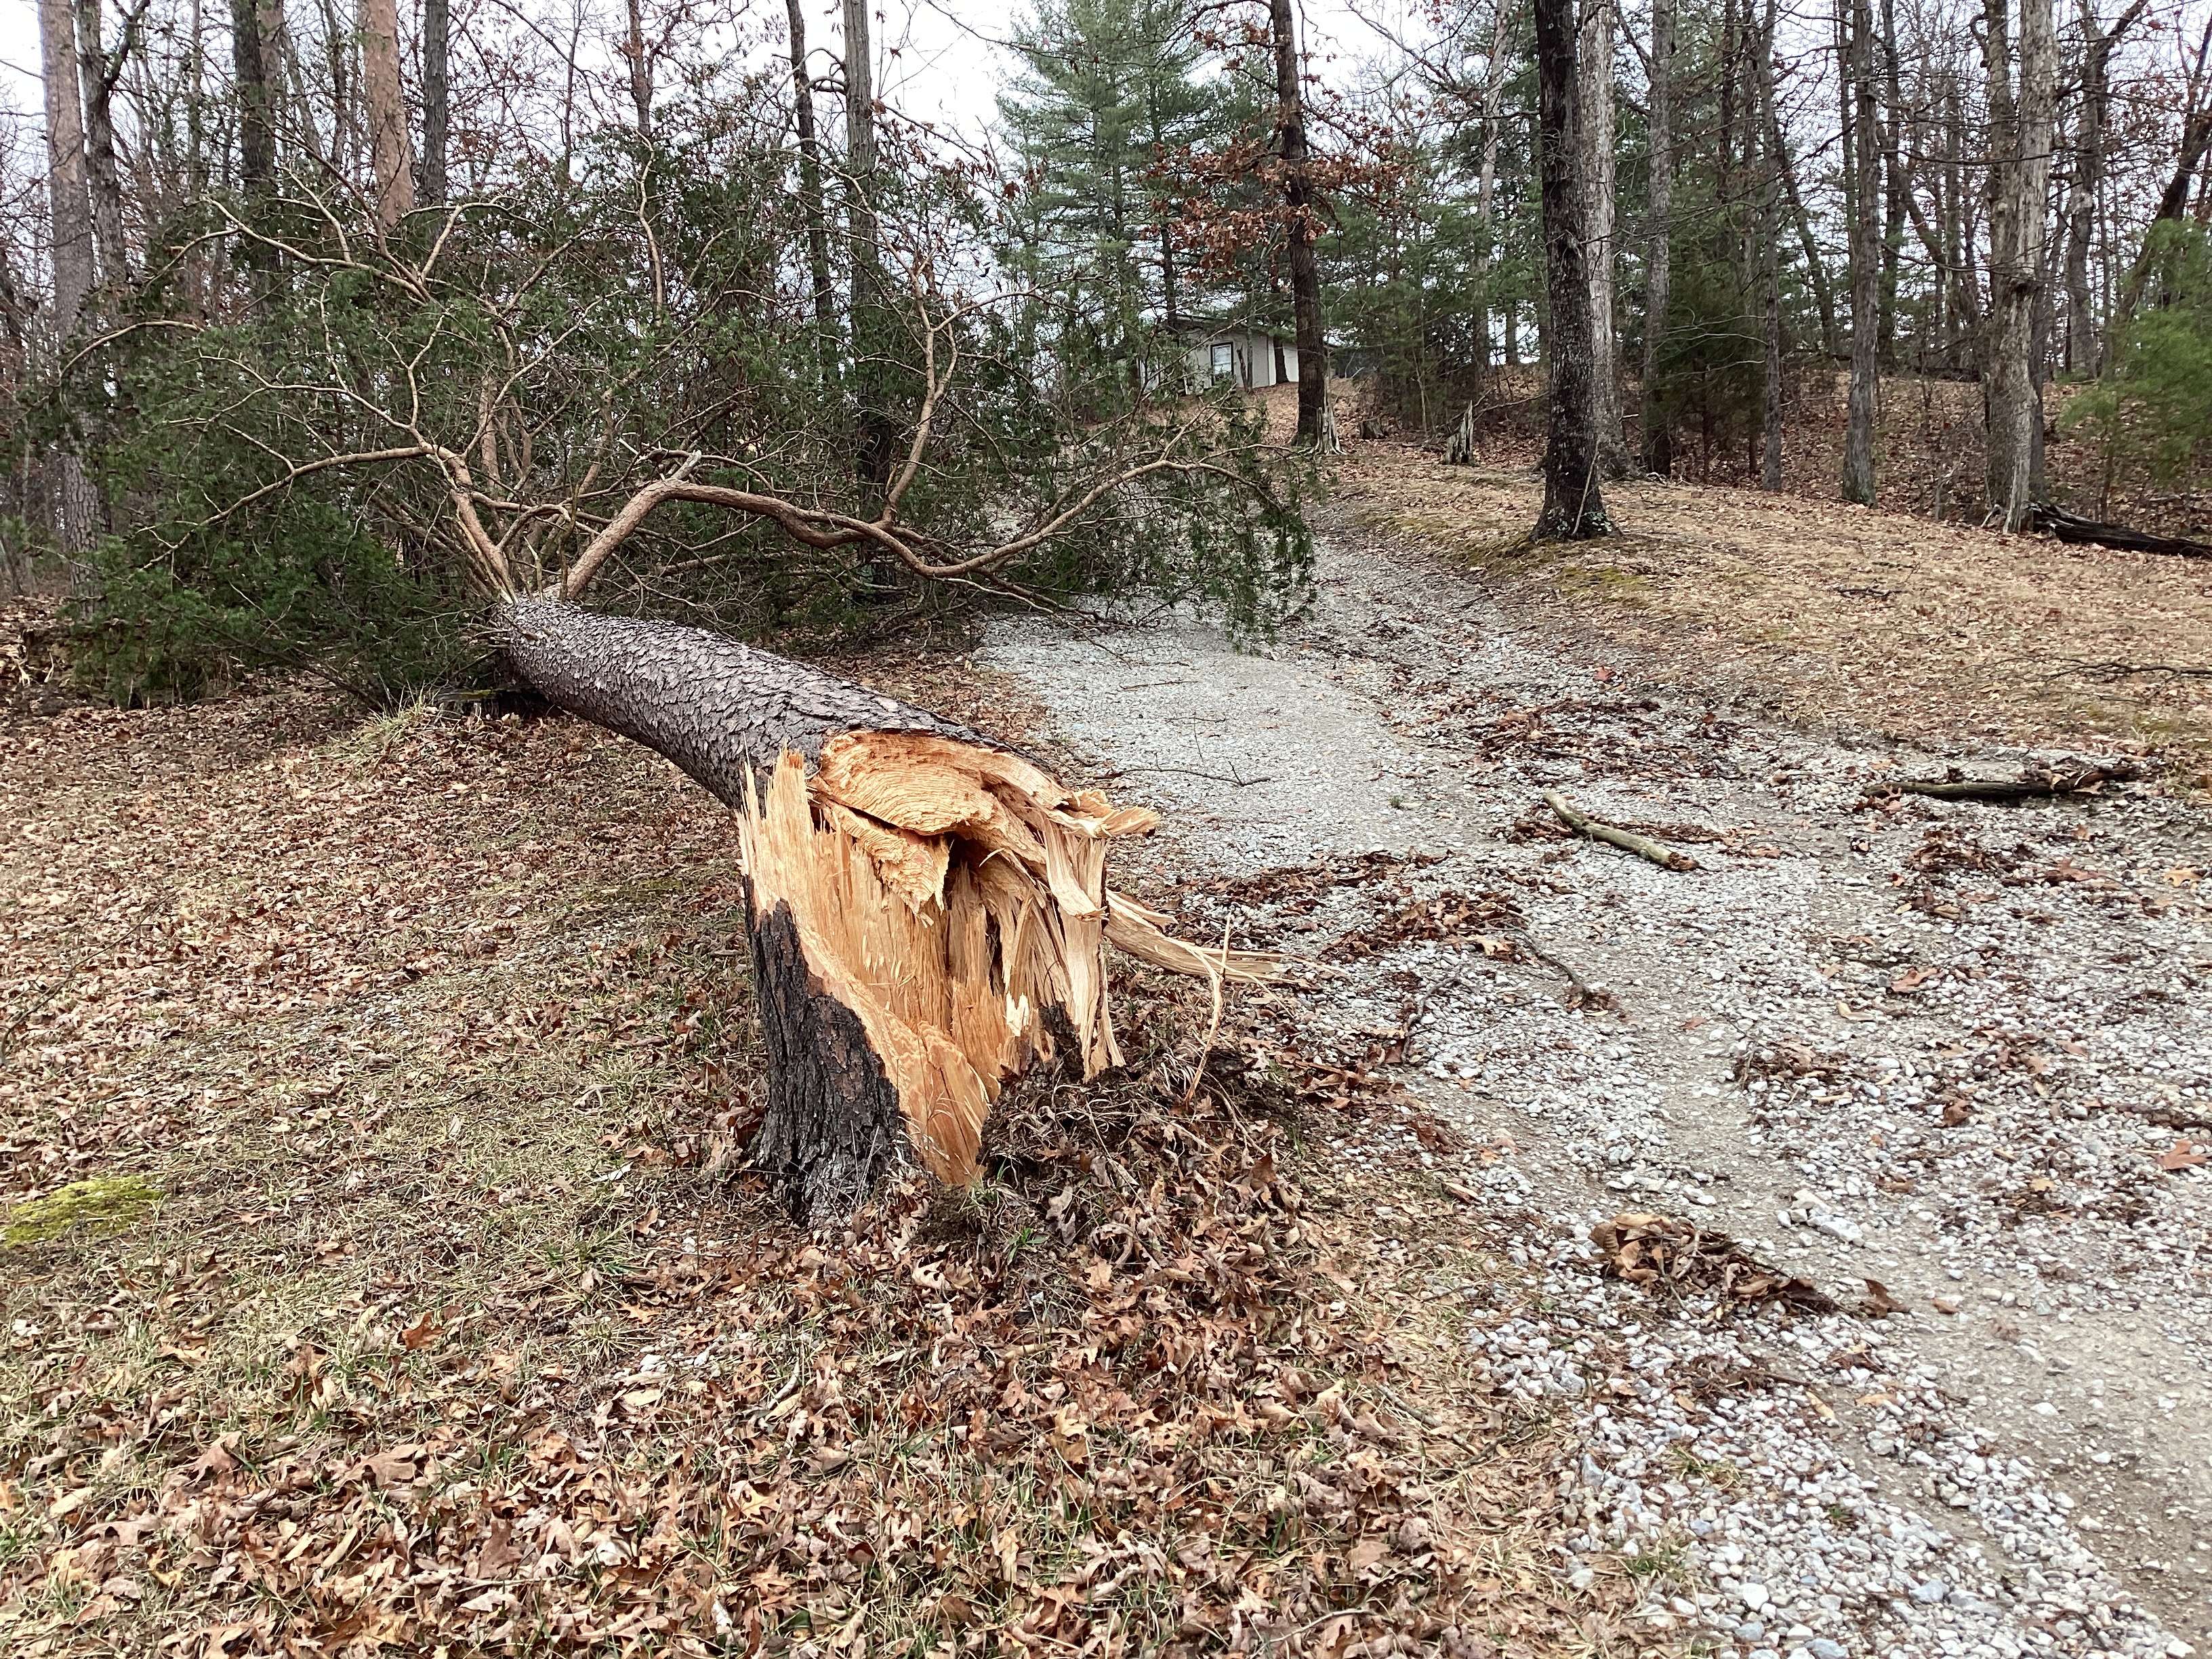
Photos & Video
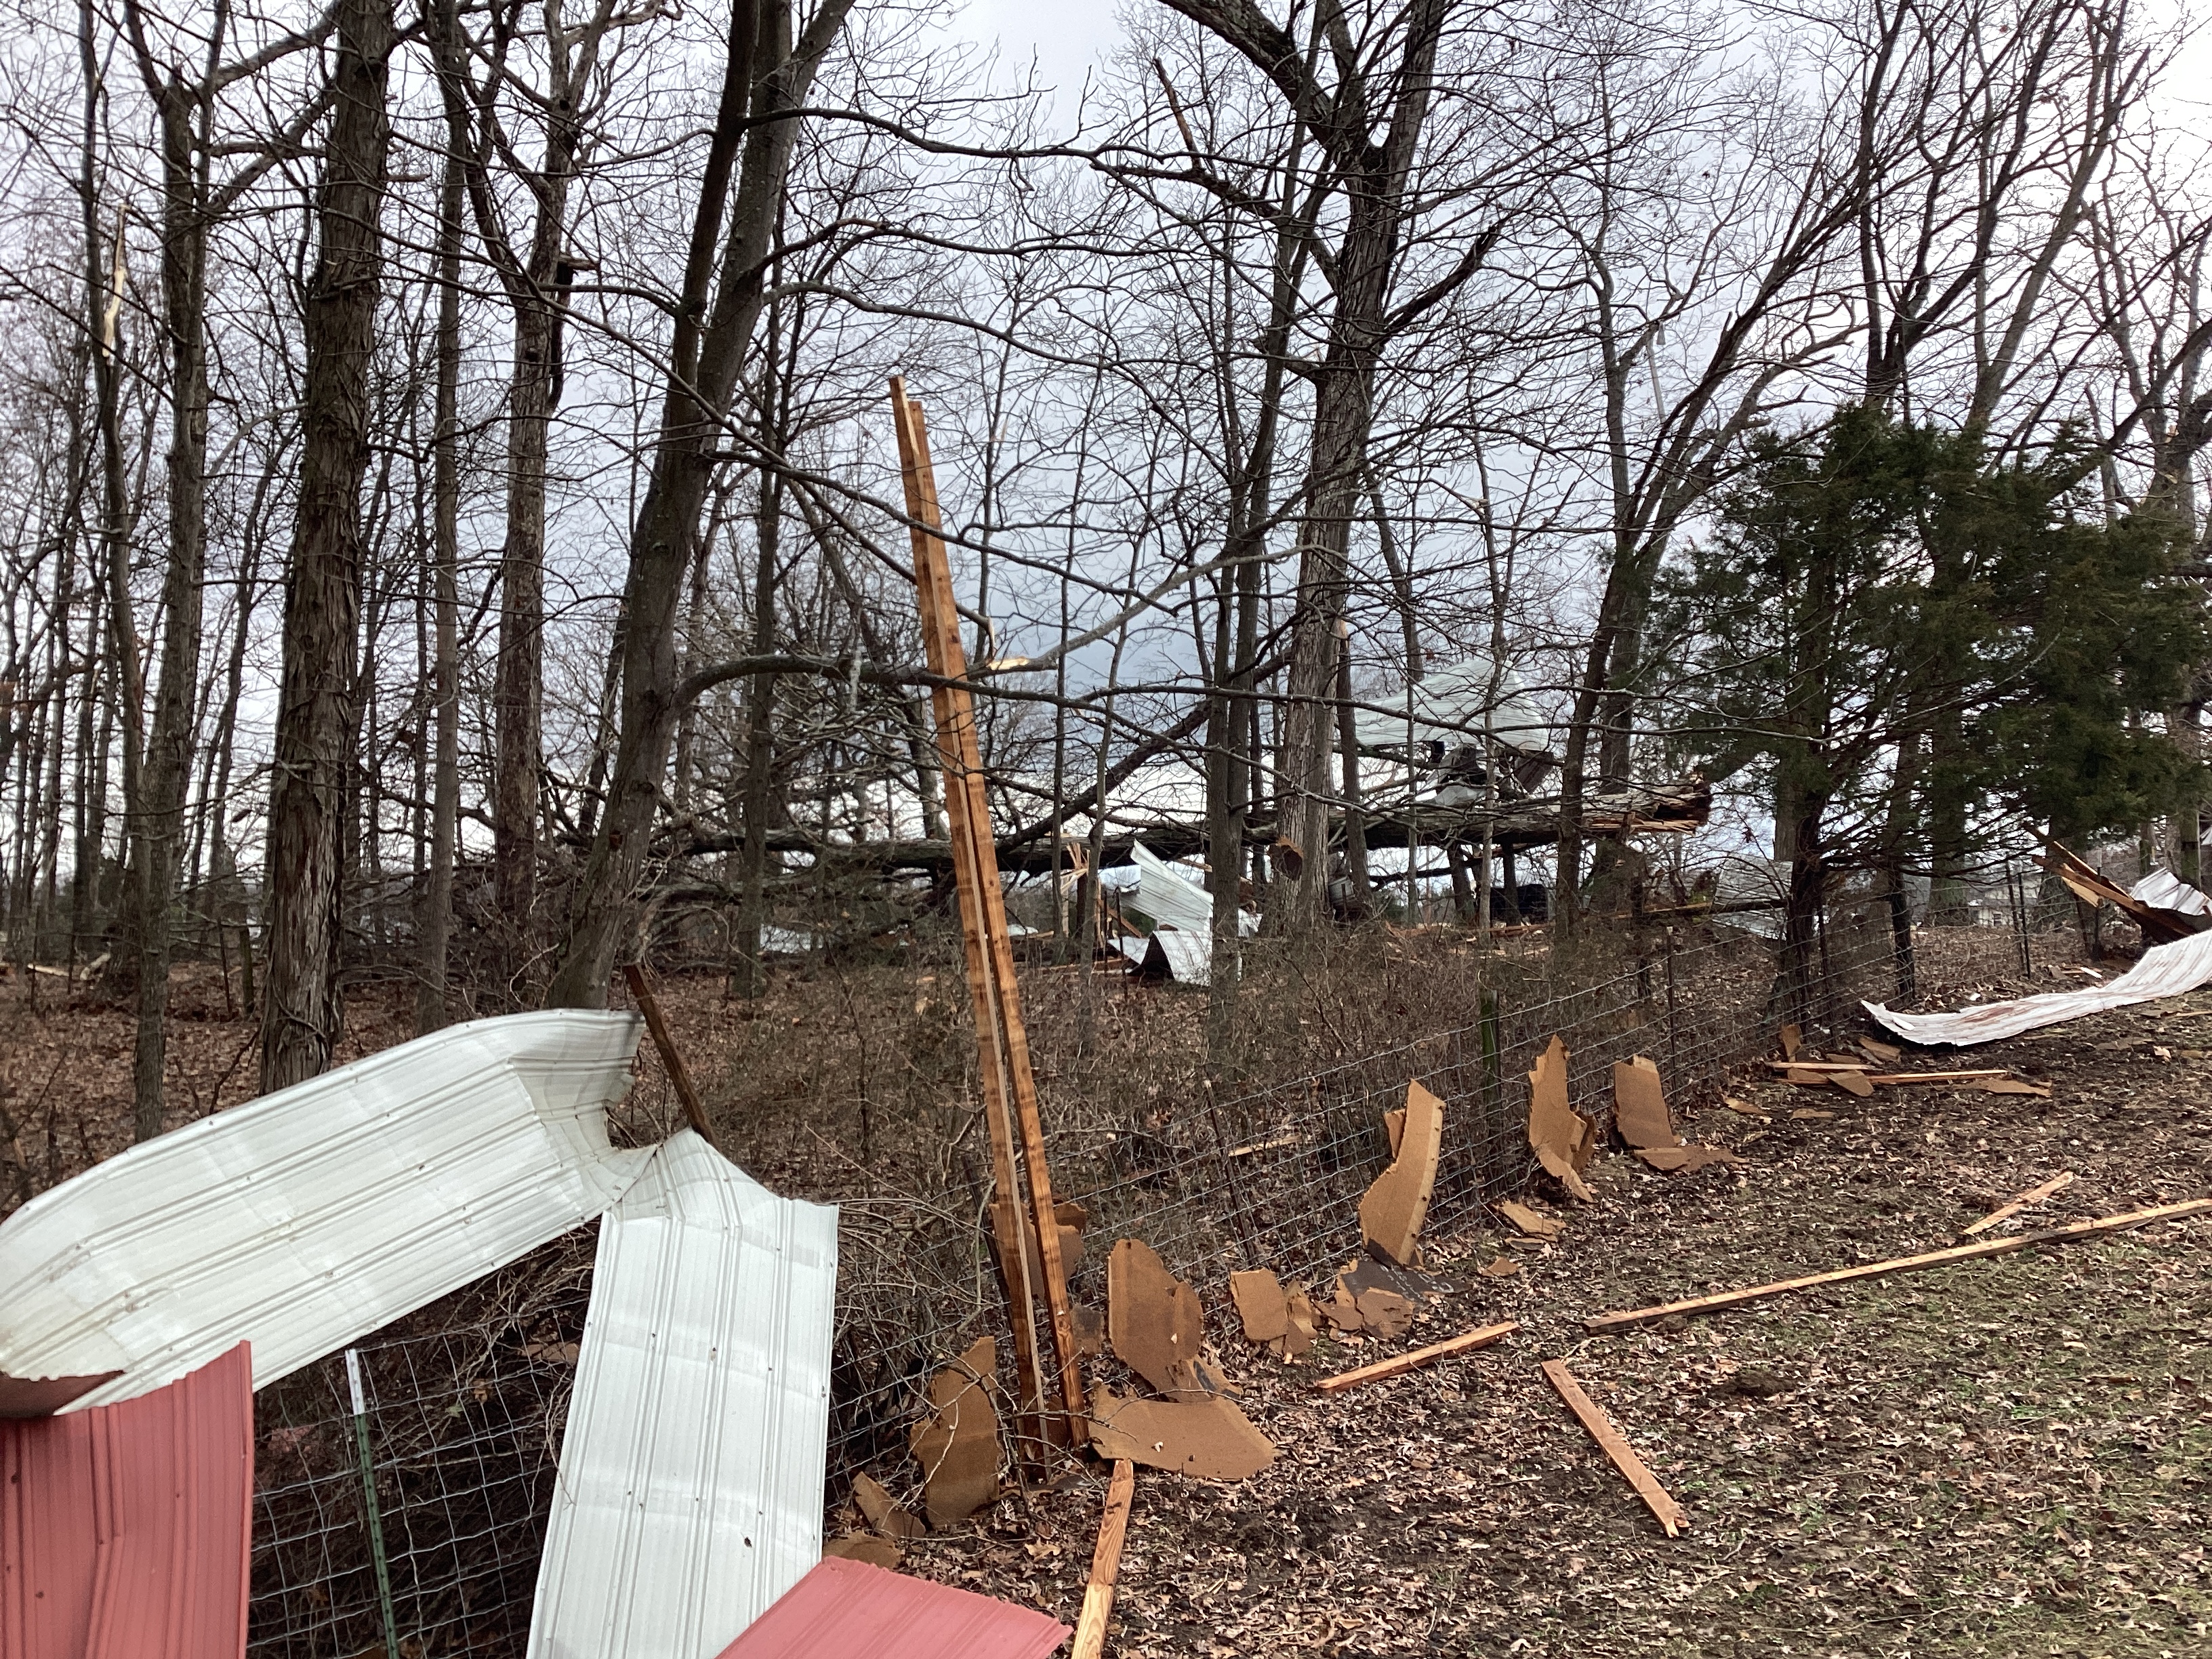
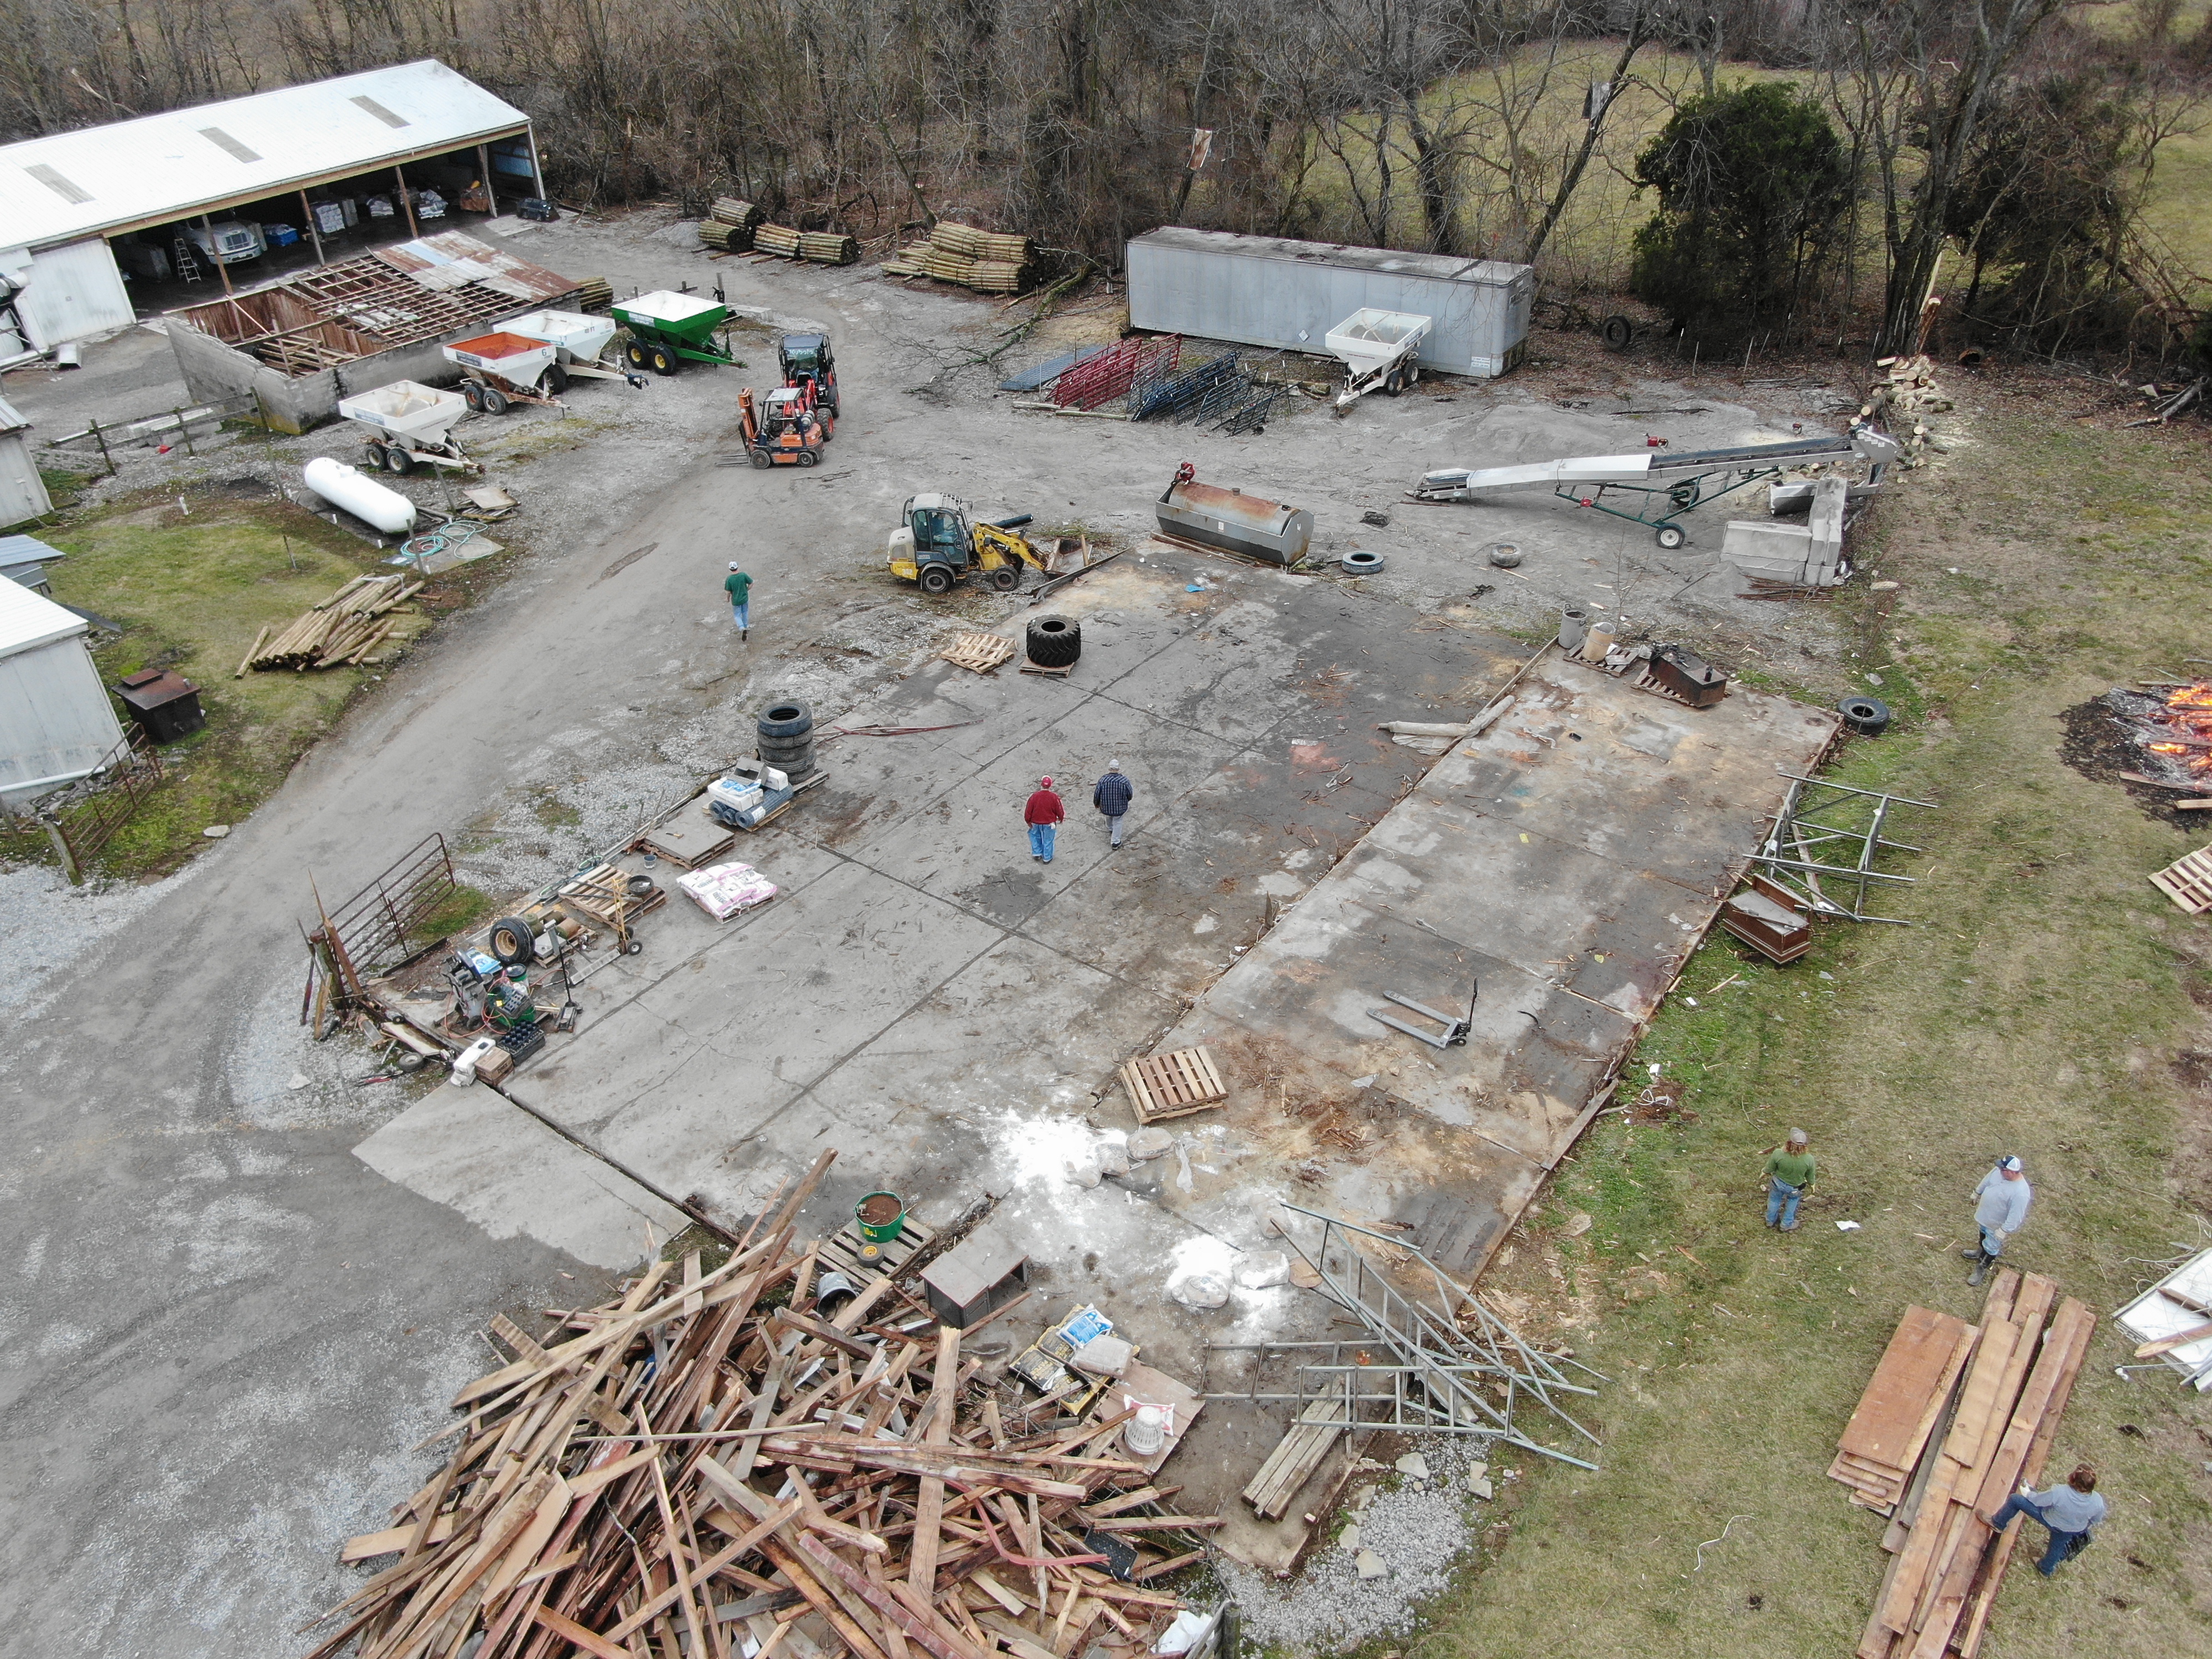
Underwood, IN EF-1 Tornado
 |
 |
 |
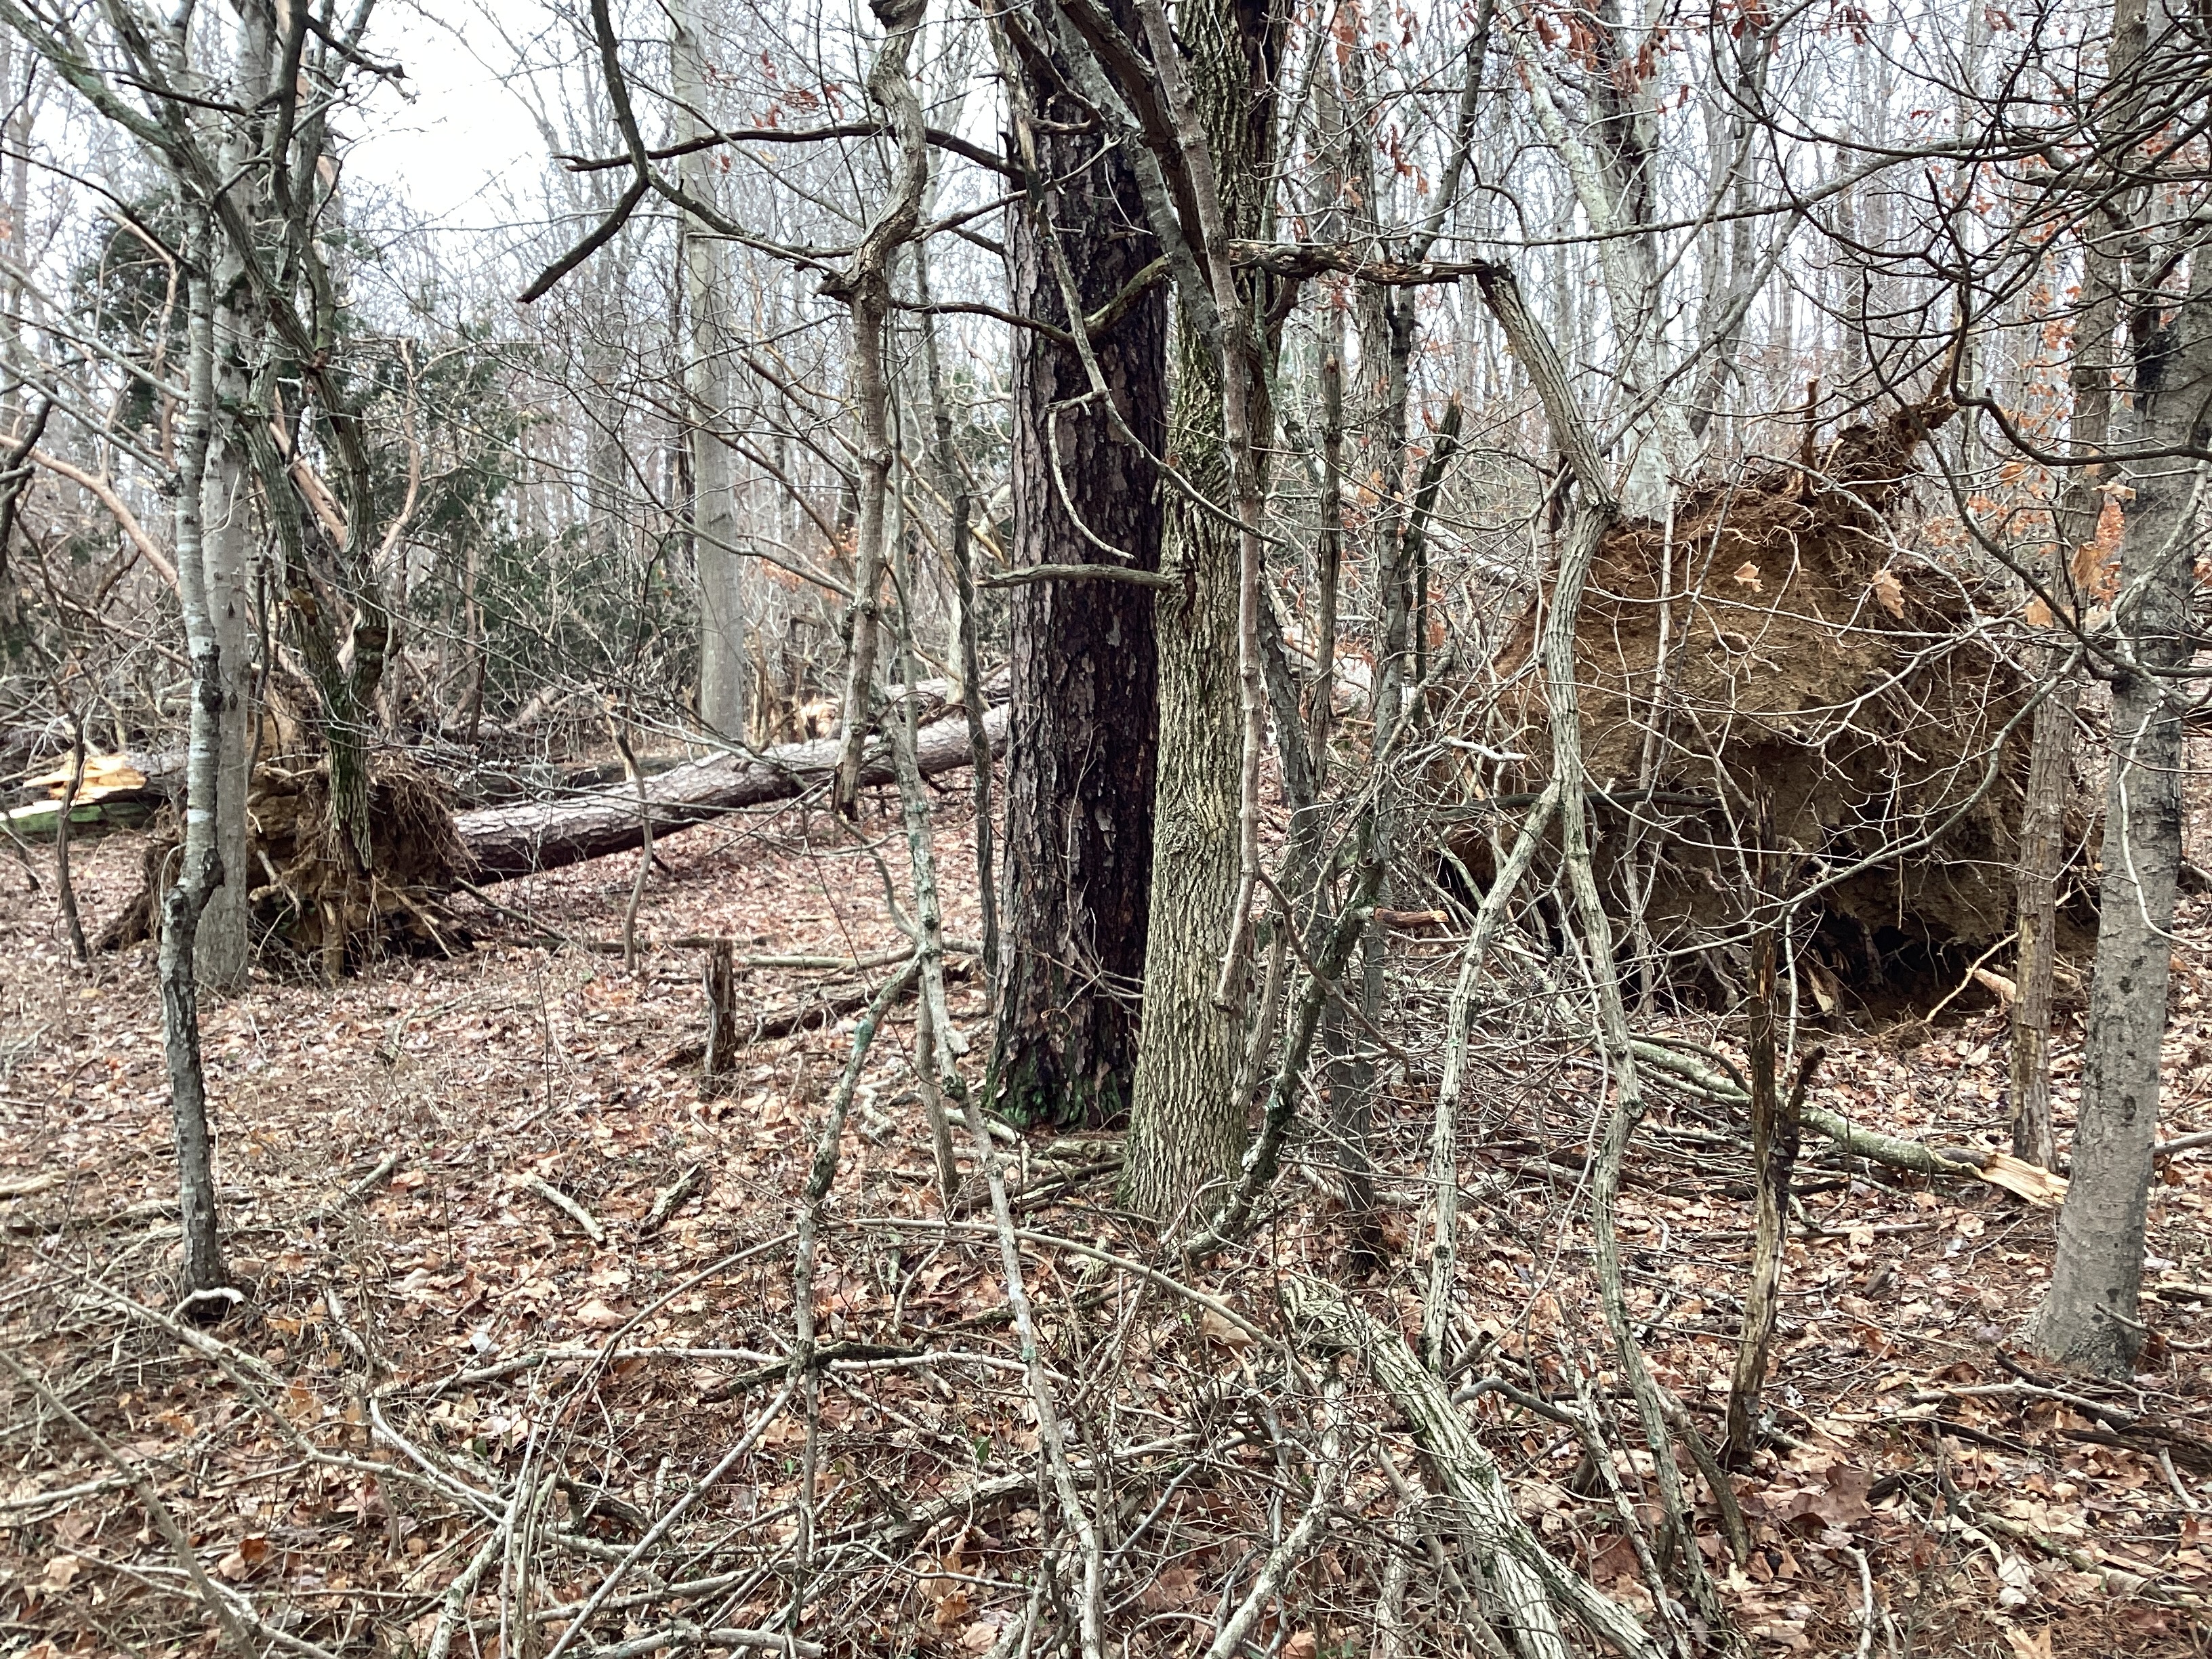 |
| EF-1 Tornado Damage (NWS Storm Survey) |
EF-1 Tornado Damage (NWS Storm Survey) |
EF-1 Tornado Damage (NWS Storm Survey) |
EF-1 Tornado Damage (NWS Storm Survey) |
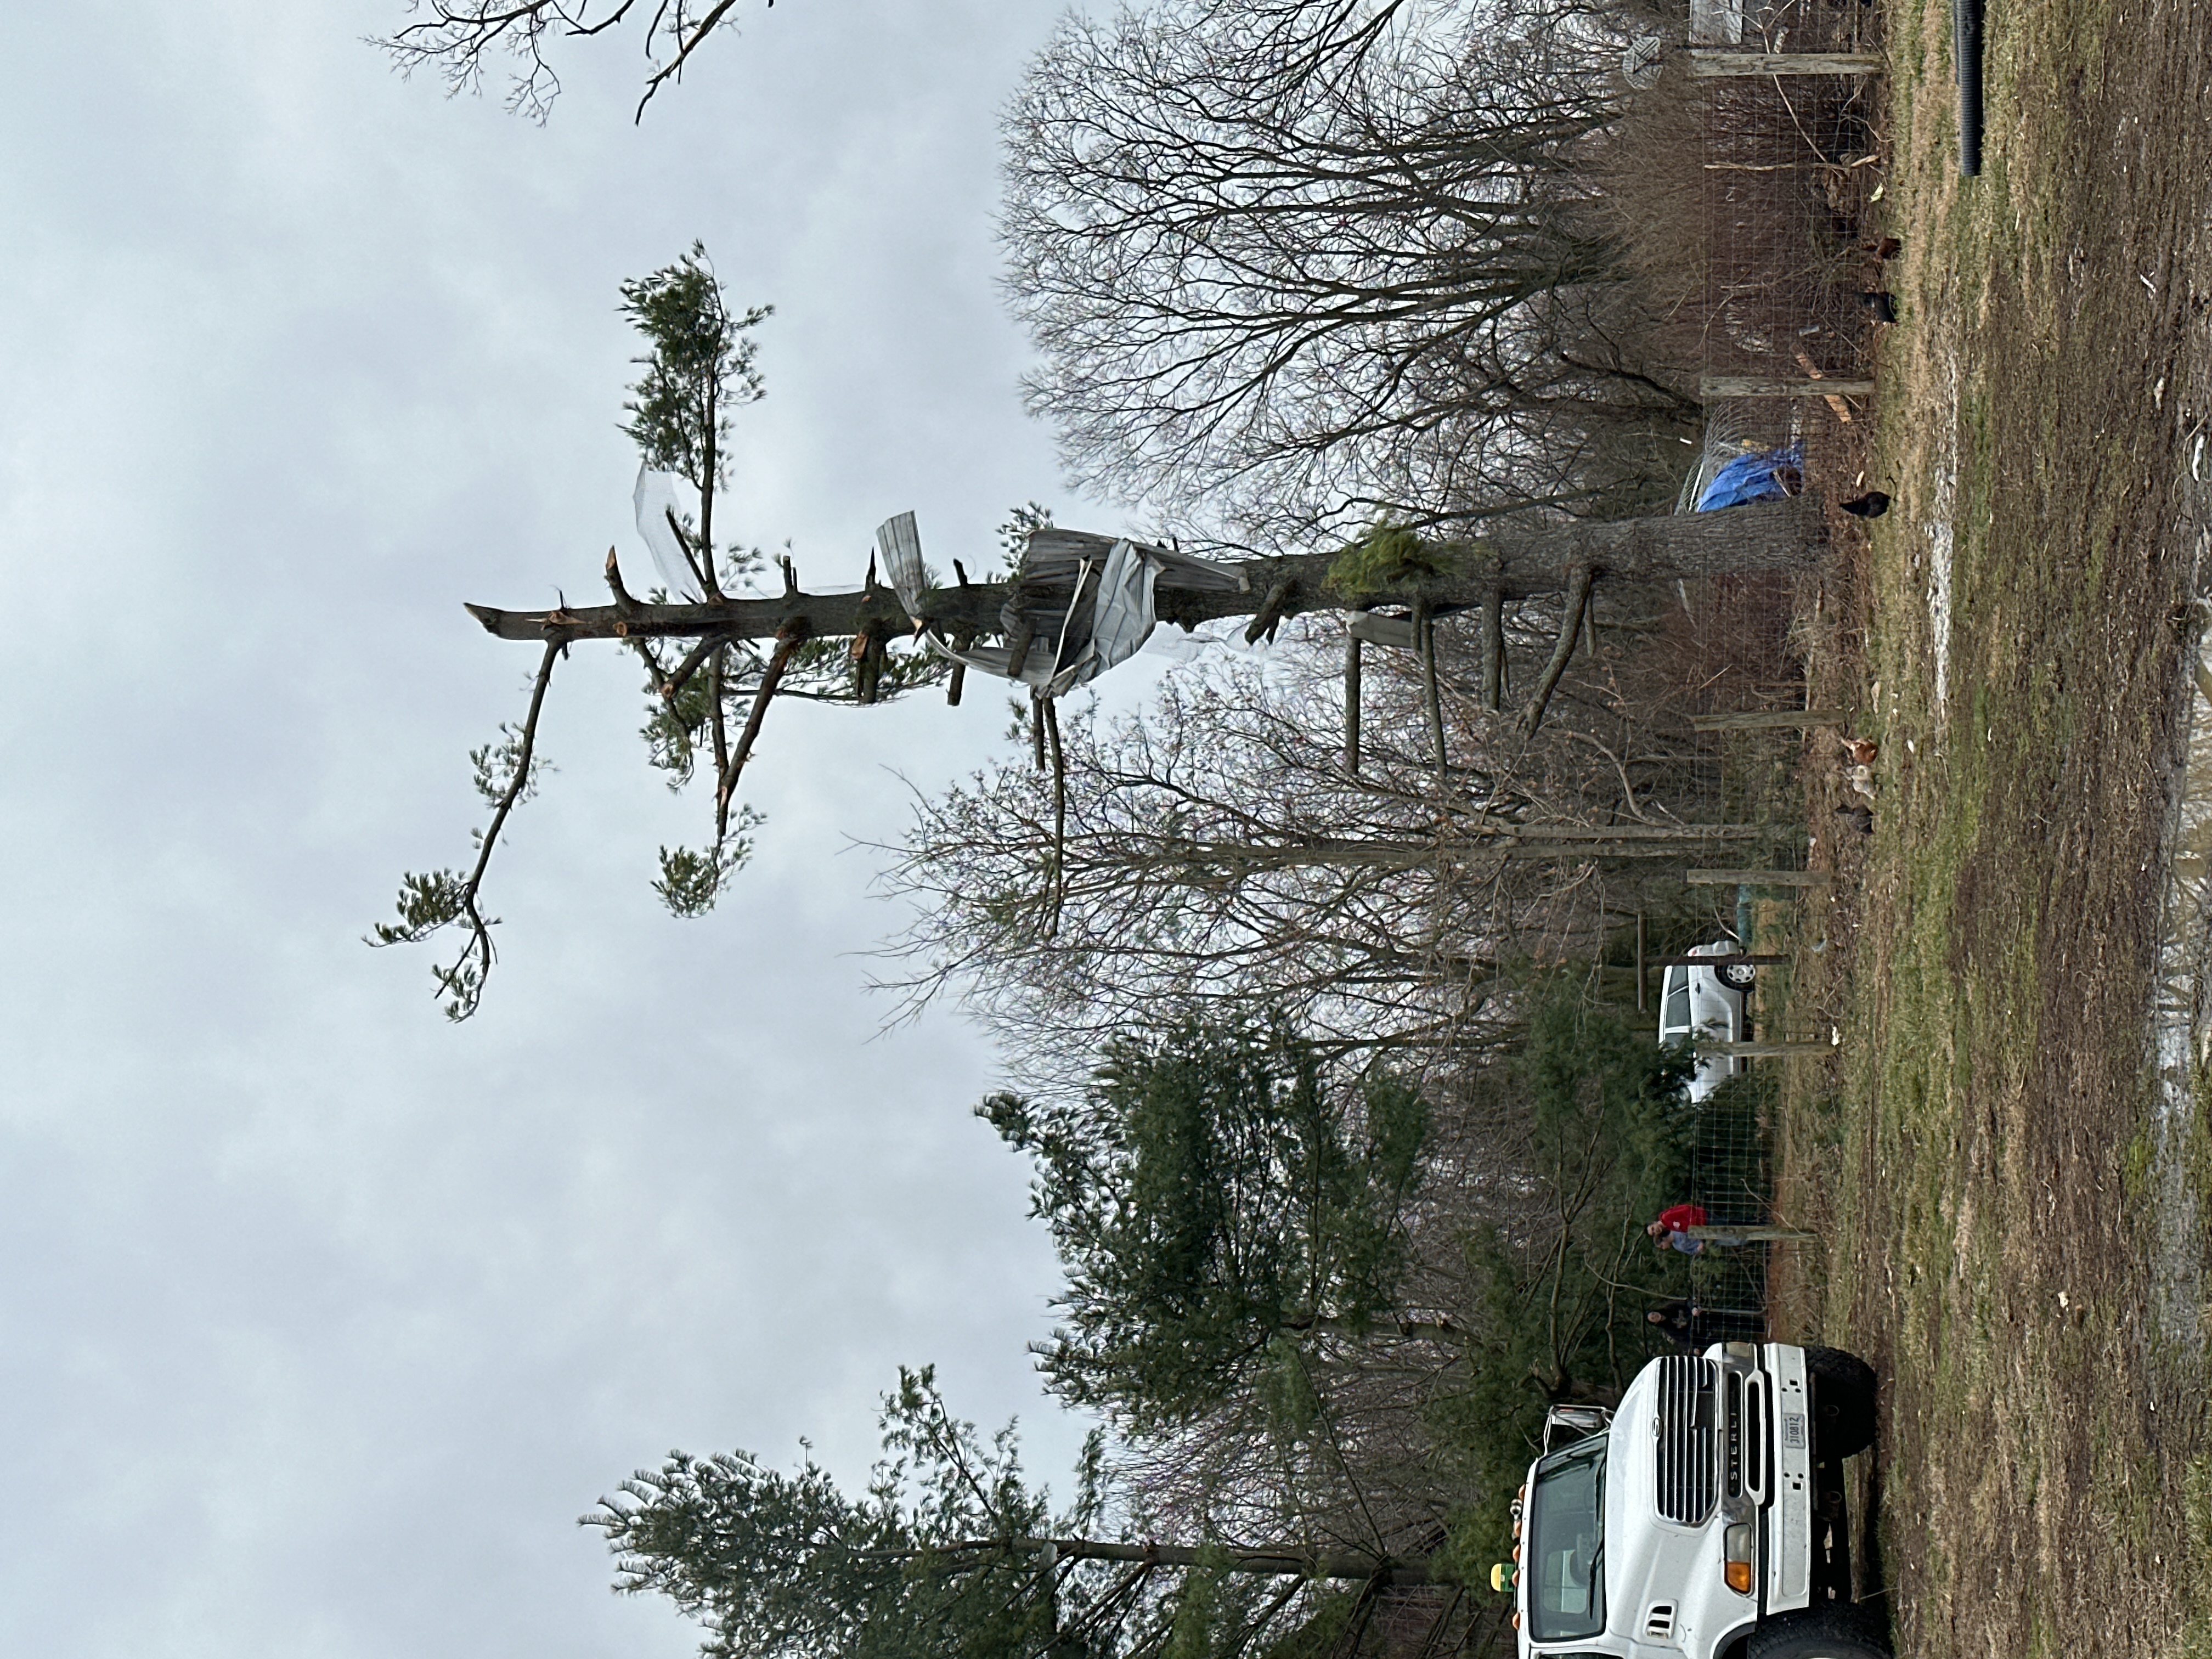
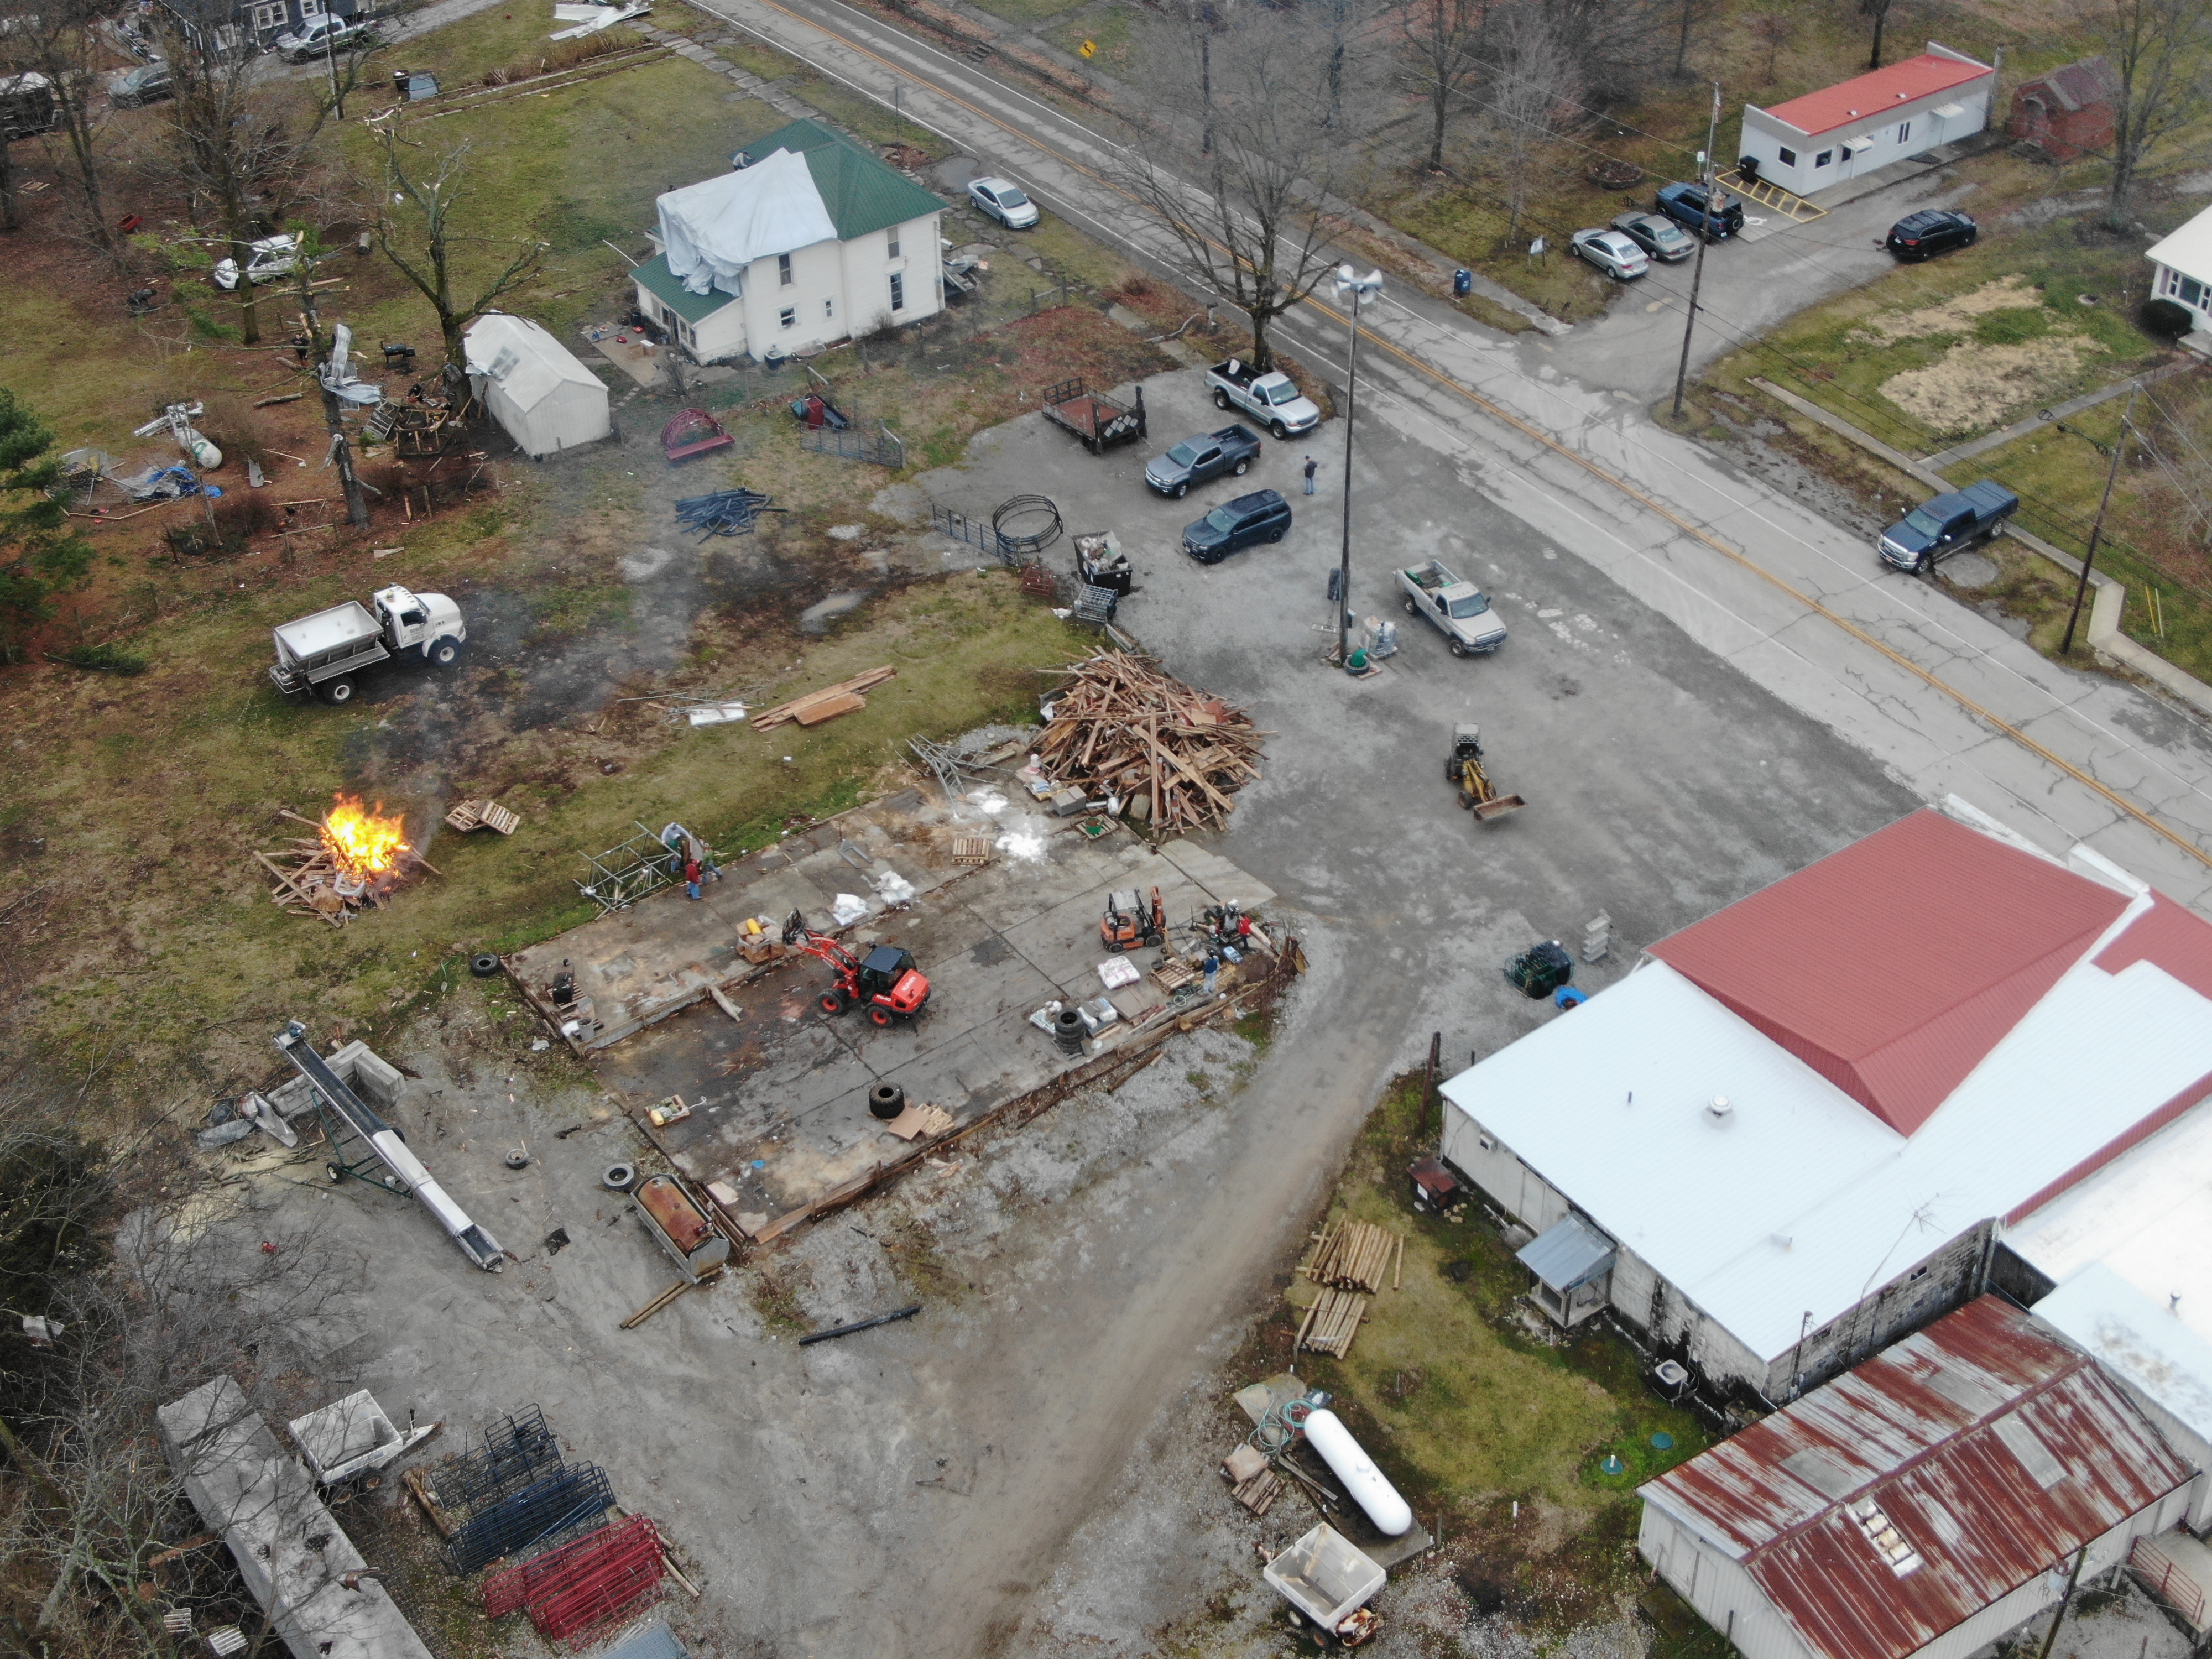
Port Royal, KY EF-1 Tornado
 |
 |
 |
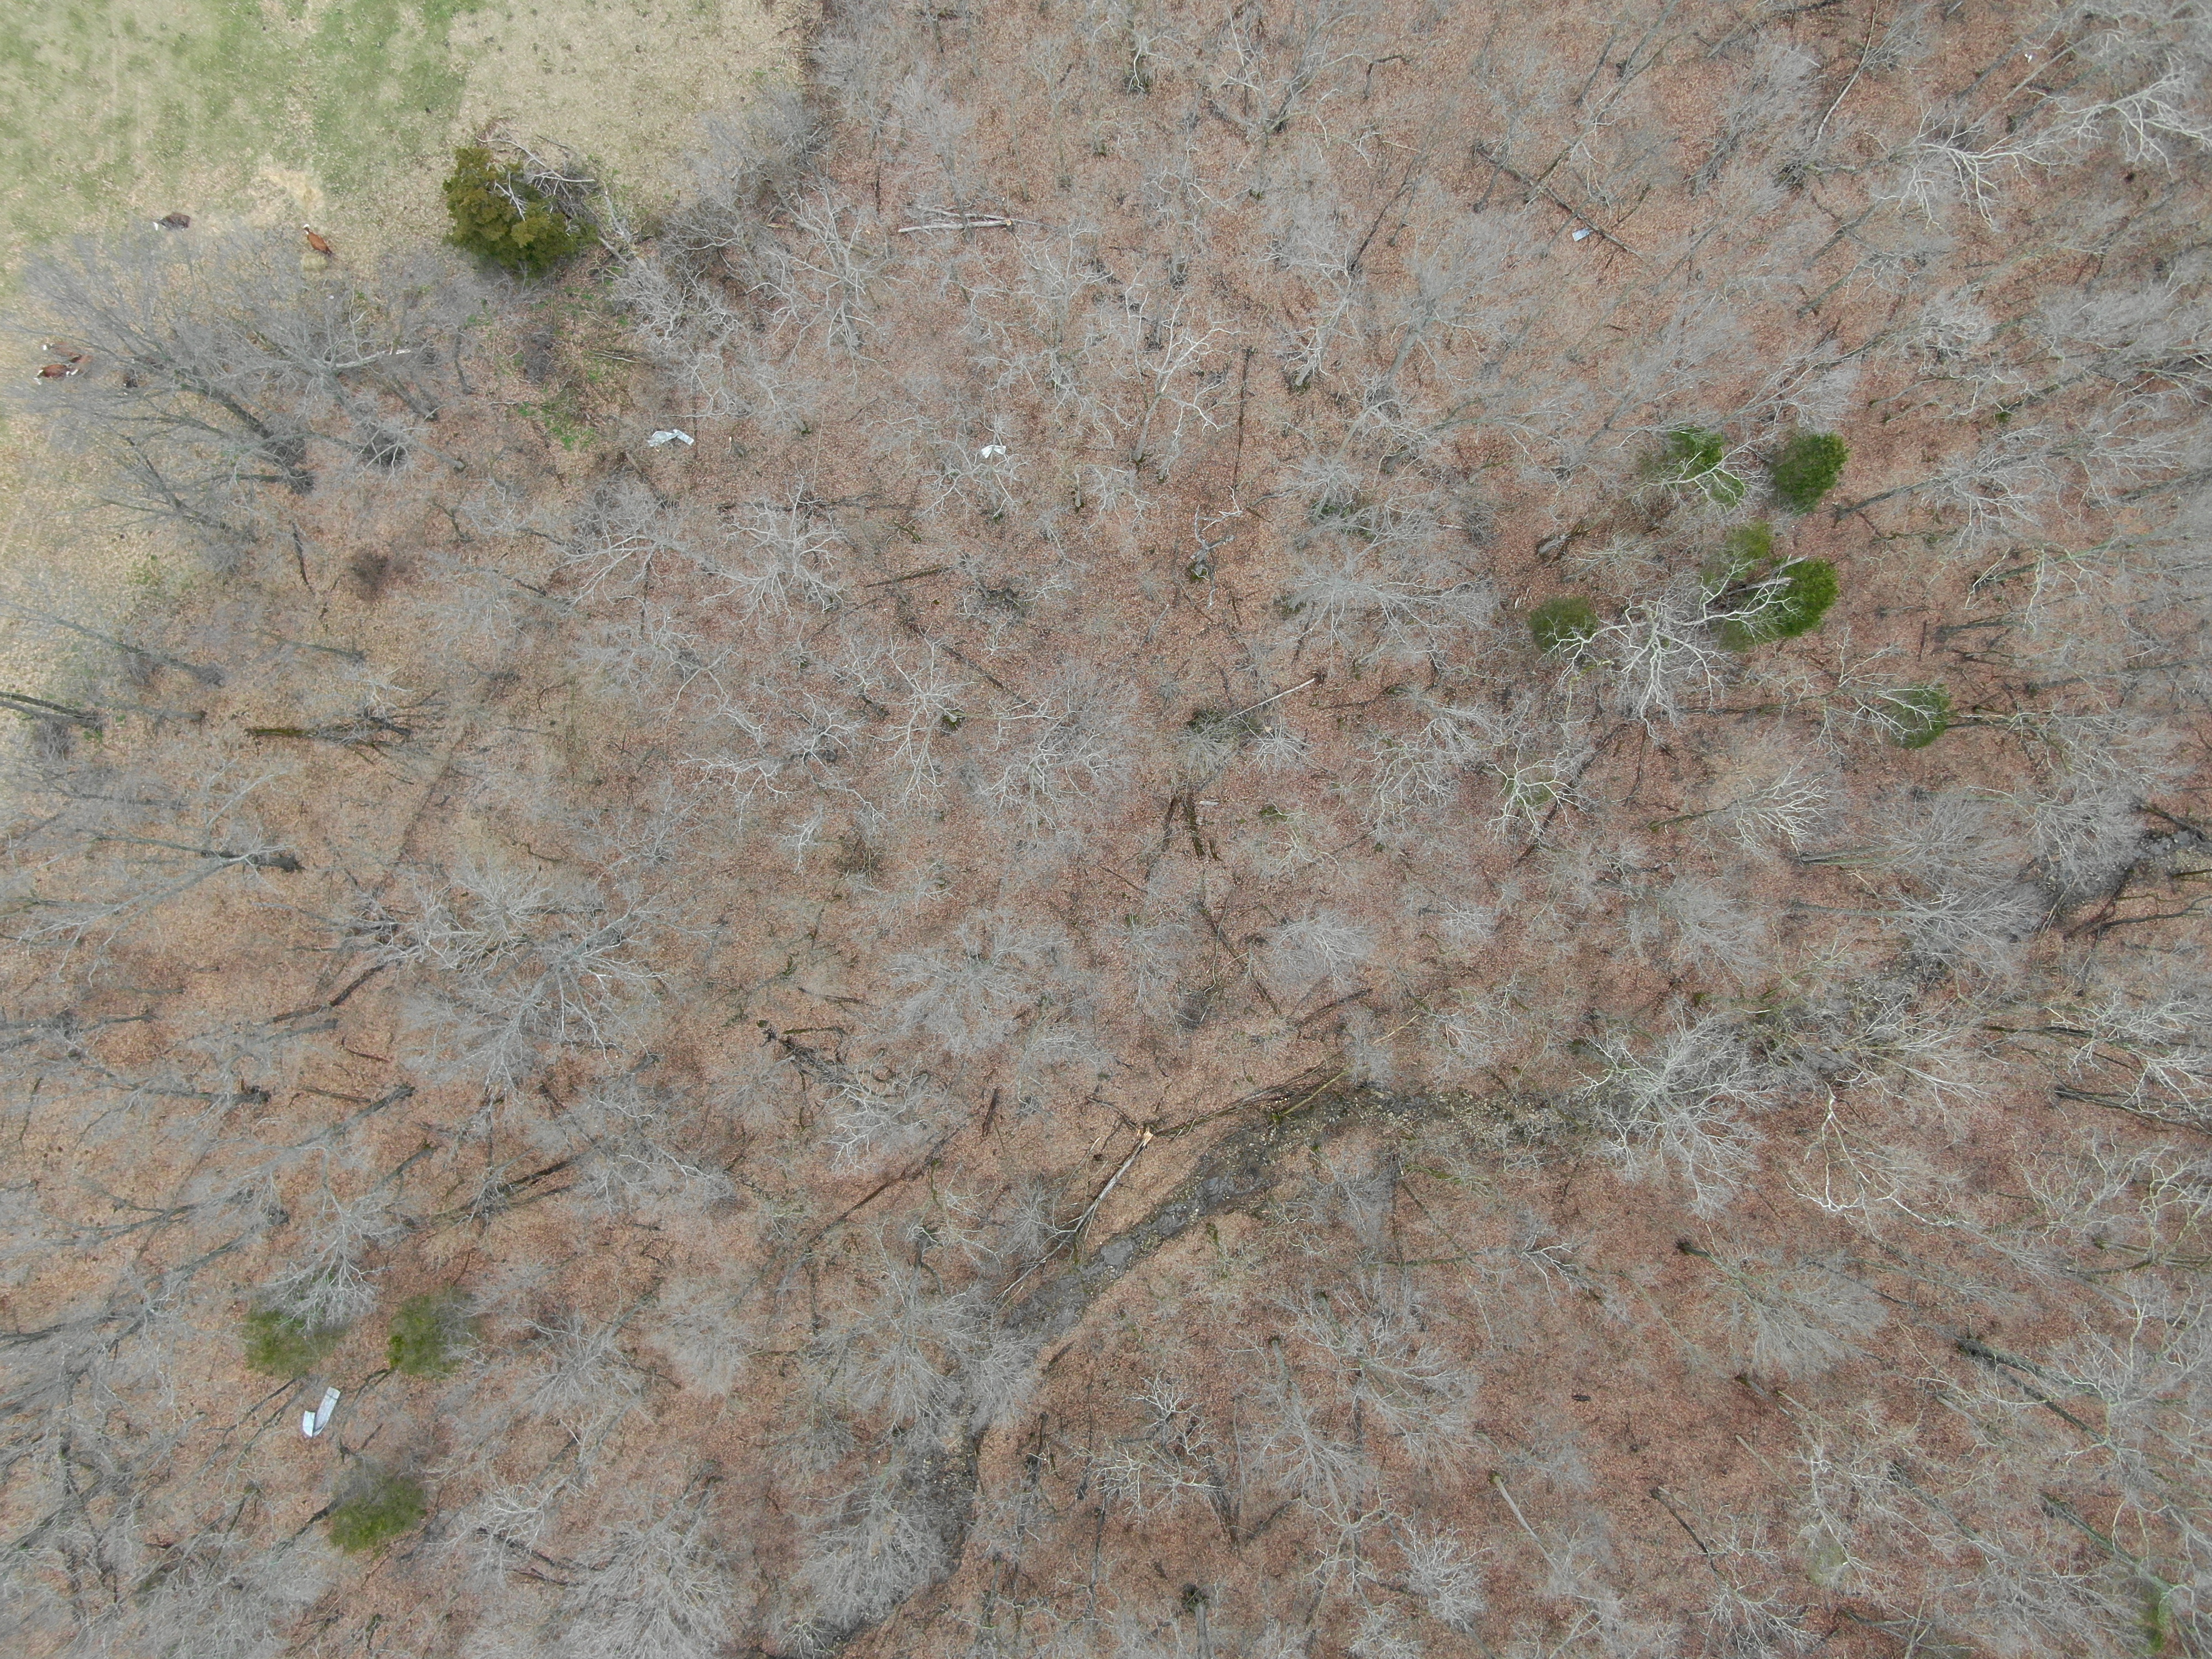 |
| EF-1 Tornado Damage (NWS Storm Survey) |
EF-1 Tornado Damage (NWS Storm Survey) |
EF-1 Tornado Damage (NWS Storm Survey) |
Drone Imagery of Snapped Trees and Barn Debris (NWS Storm Survey) |
Radar
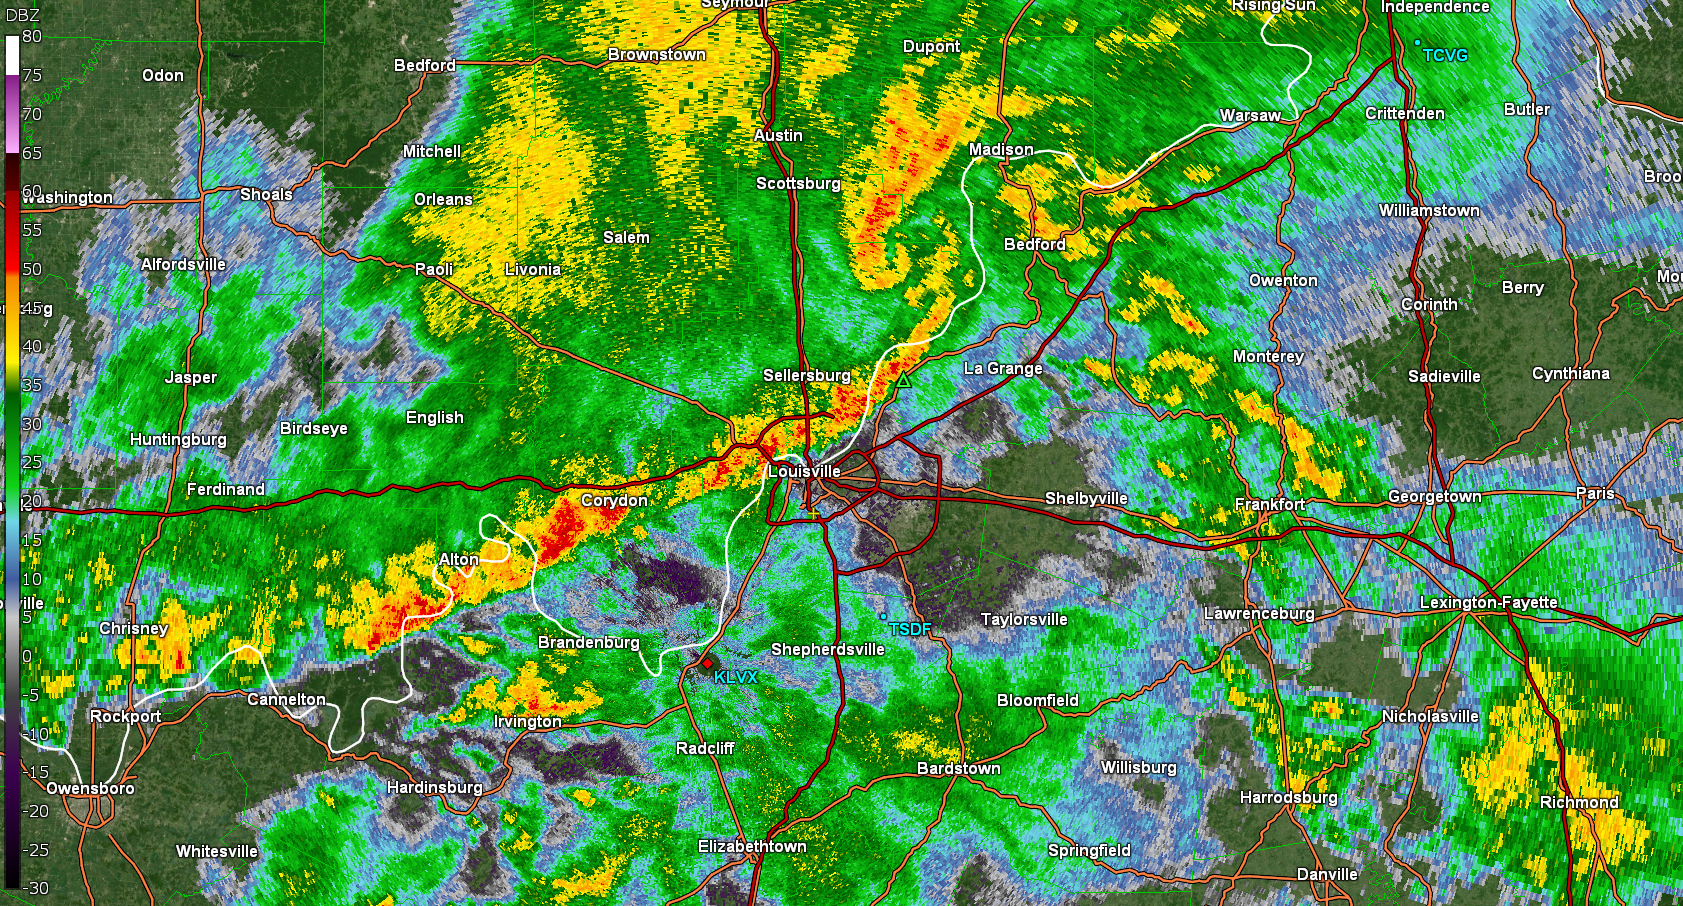 |
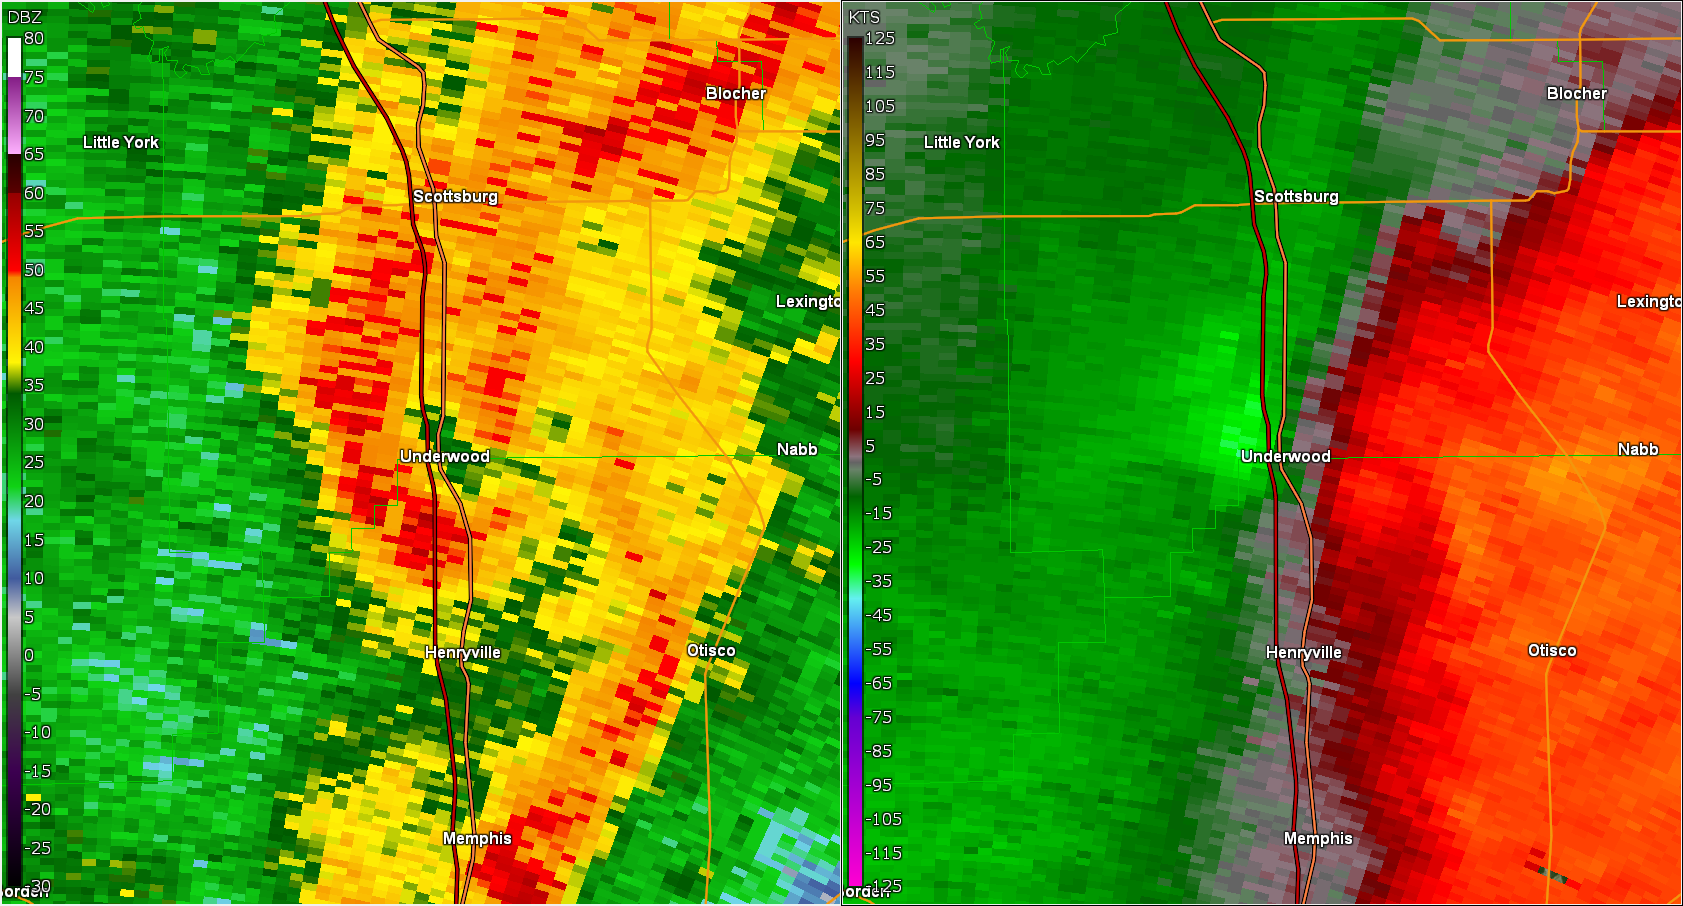 |
 |
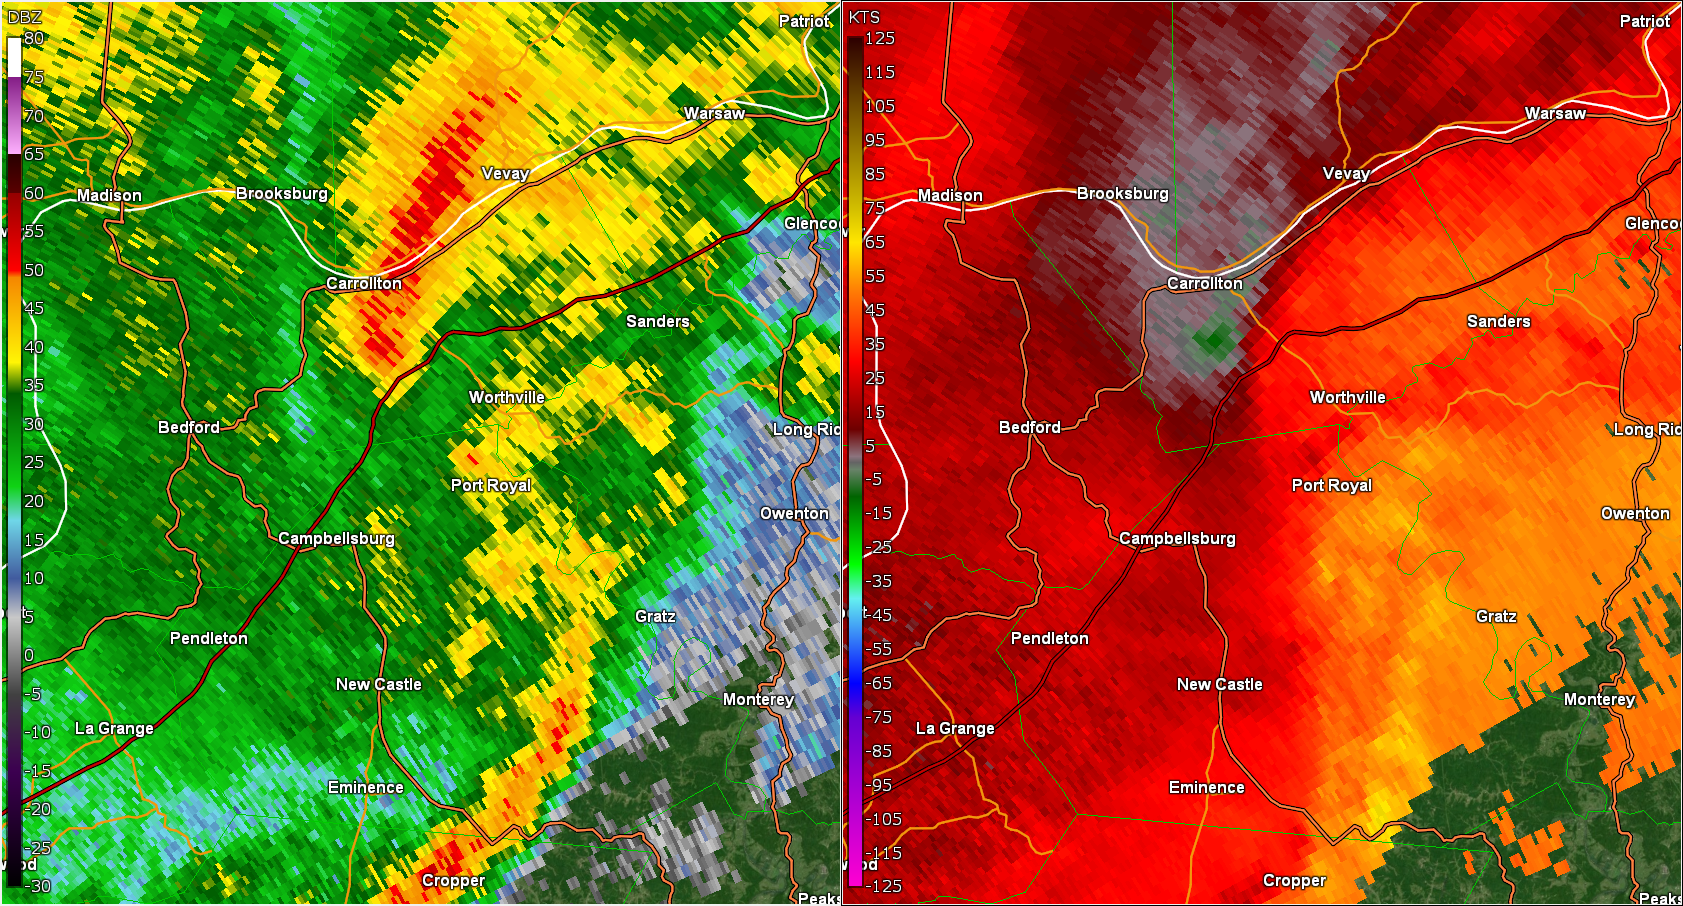 |
| KLVX 0.5° Base Reflectivity at 5 AM EST 2/10/2024 | KLVX 0.5° Base Reflectivity and Storm Relative Velocity at 4:49 AM EST 2/10/2024 | KLVX 0.5° Base Reflectivity, Storm Relative Velocity, Differential Reflectivity, and Correlation Coefficient at 4:50 AM EST 2/10/2024 | KLVX 0.5° Base Reflectivity and Storm Relative Velocity at 5:32 AM EST 2/10/2024 |
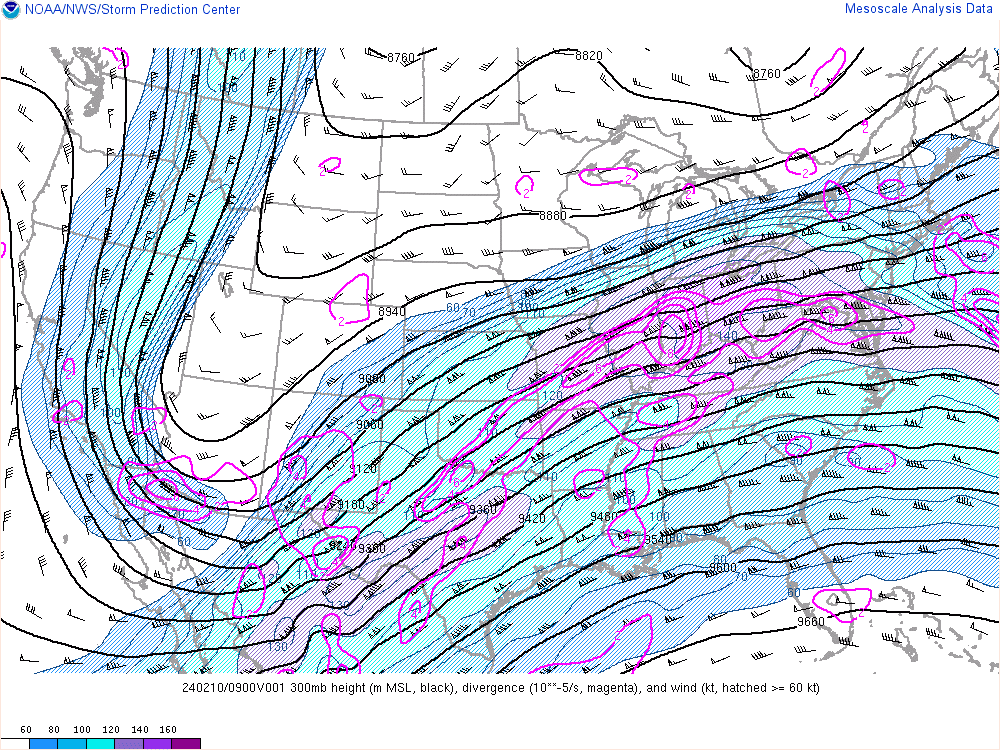
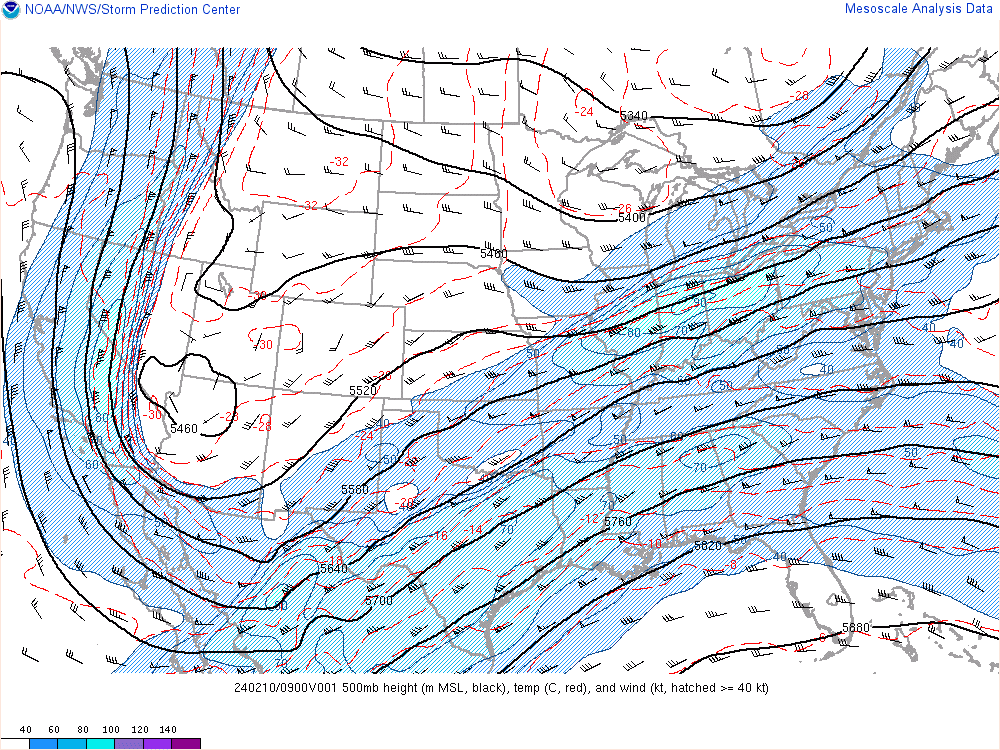
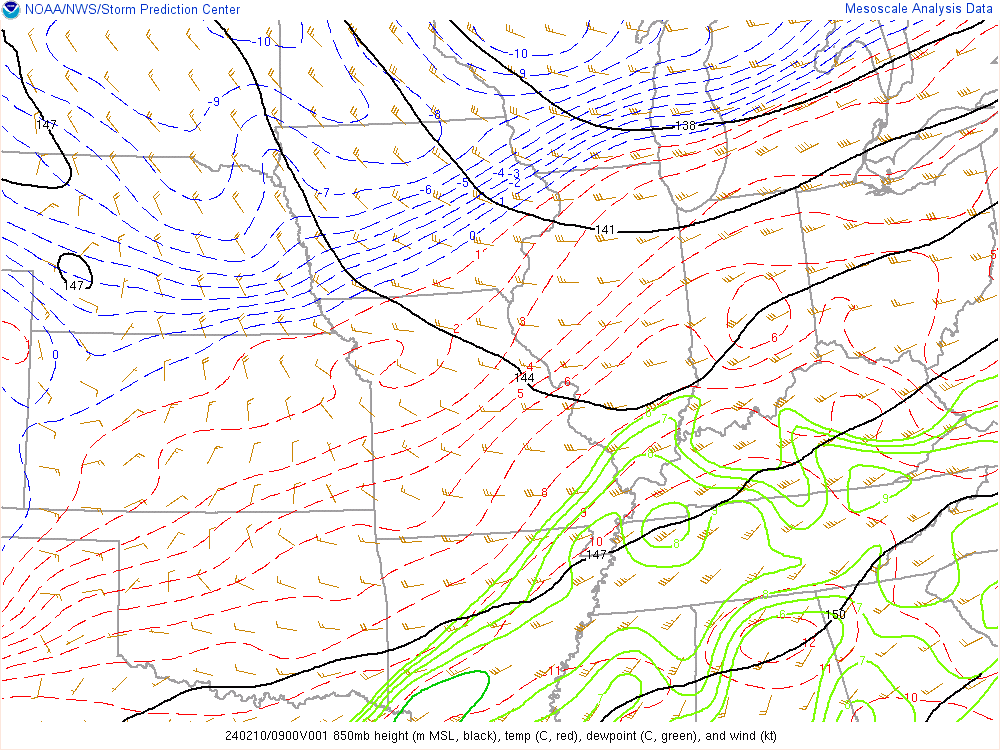
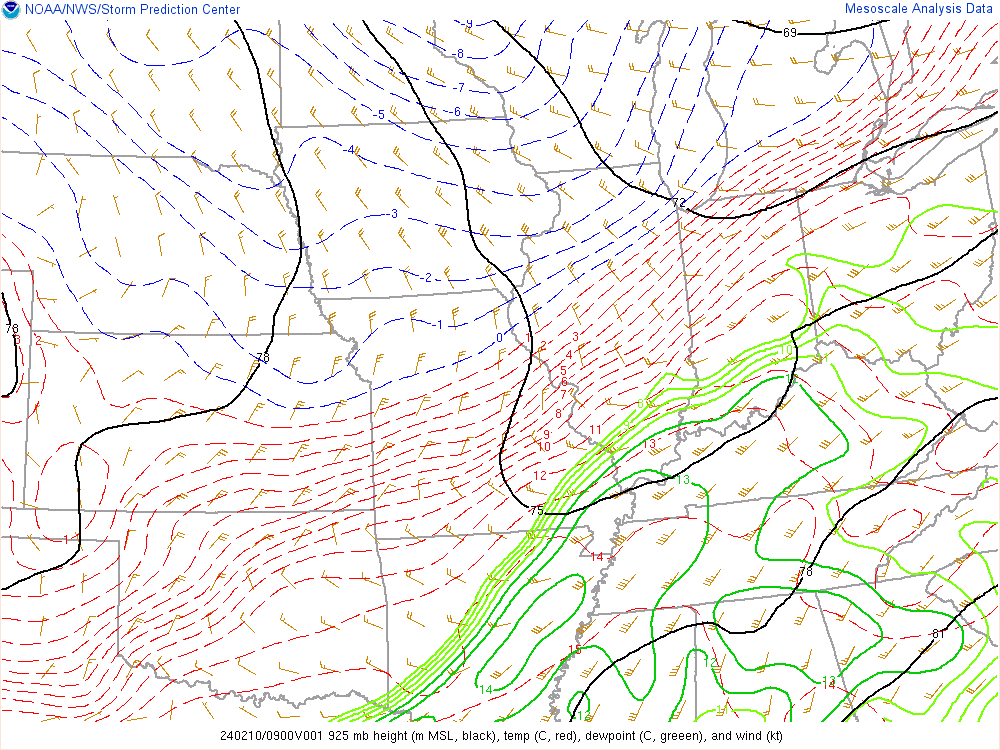
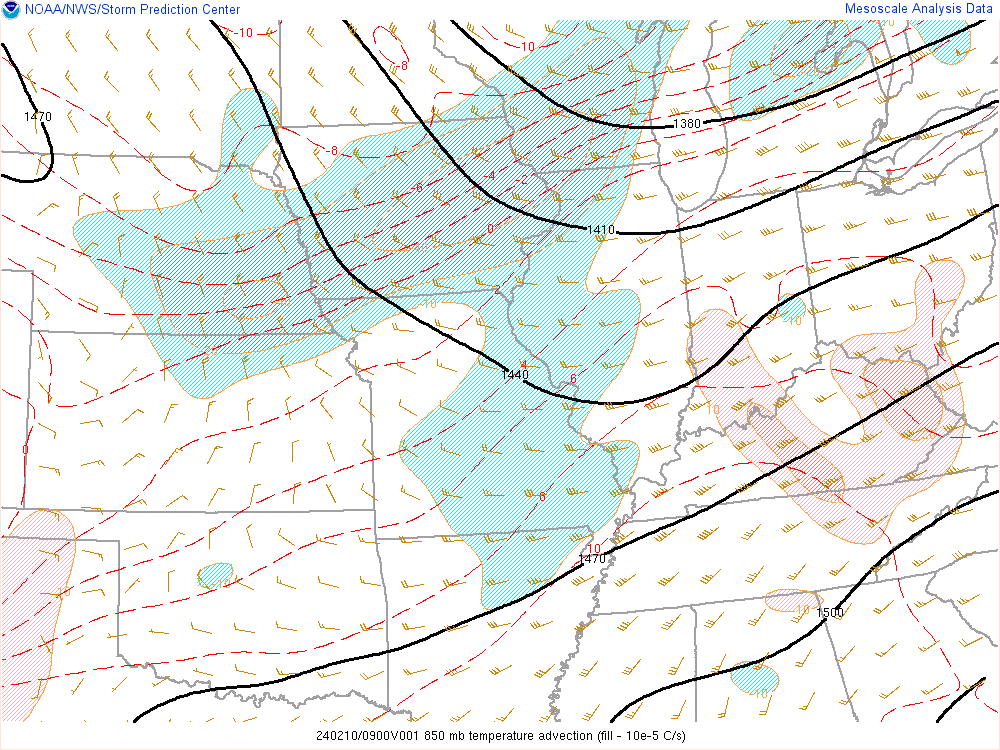
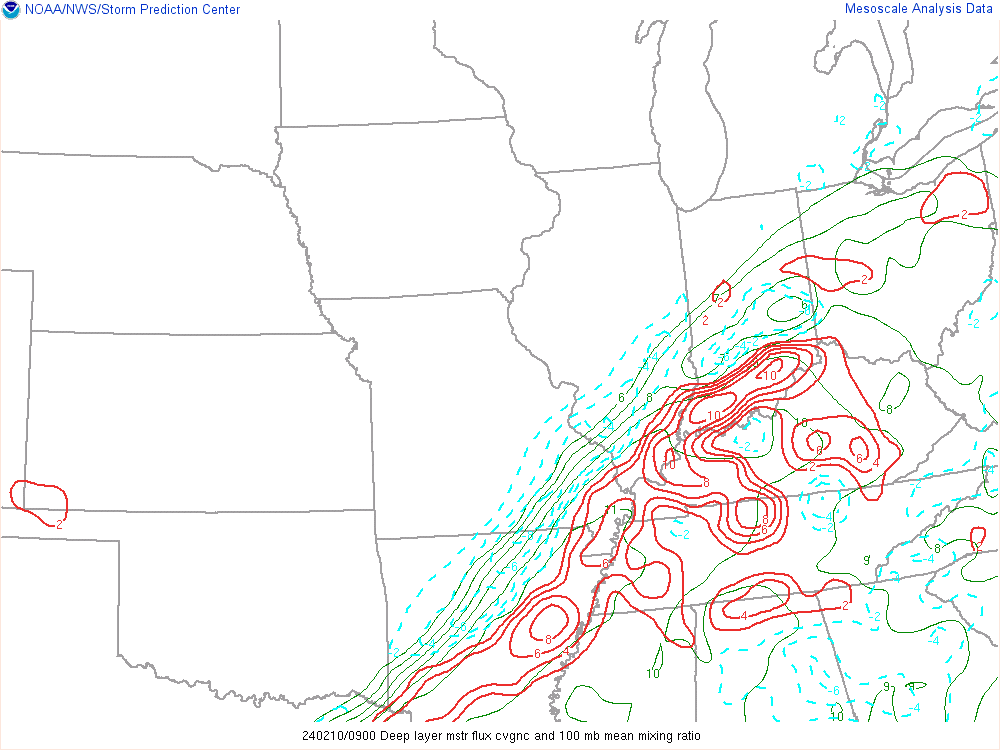
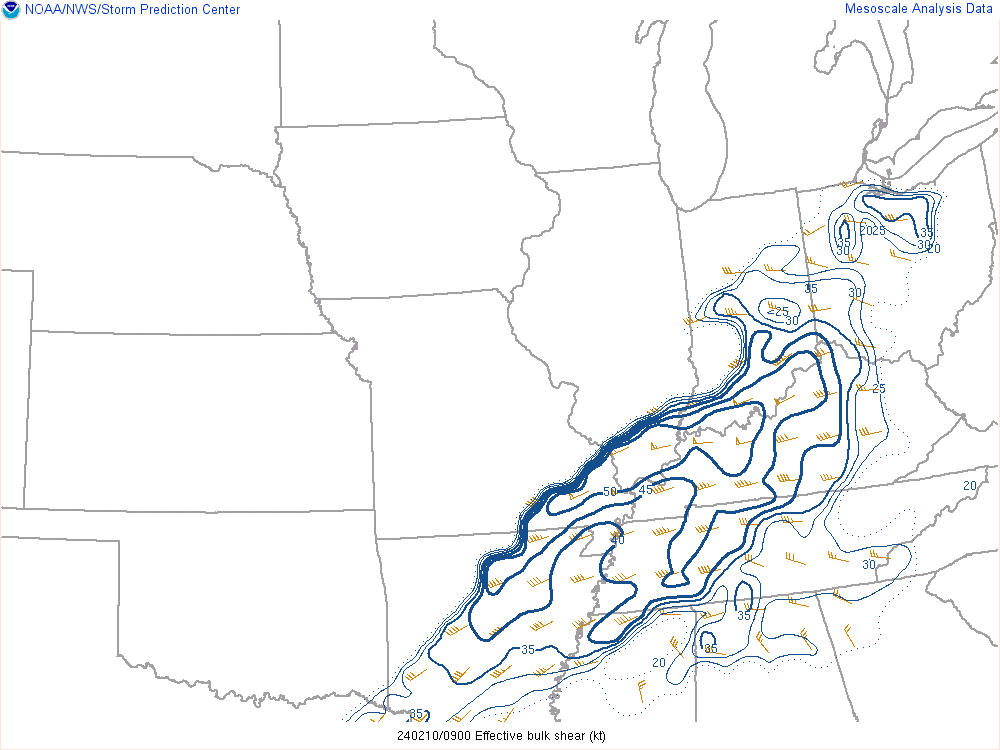
Environment
All environmental parameters are from 09z (4 am EST) on February 10, 2024.
 |
 |
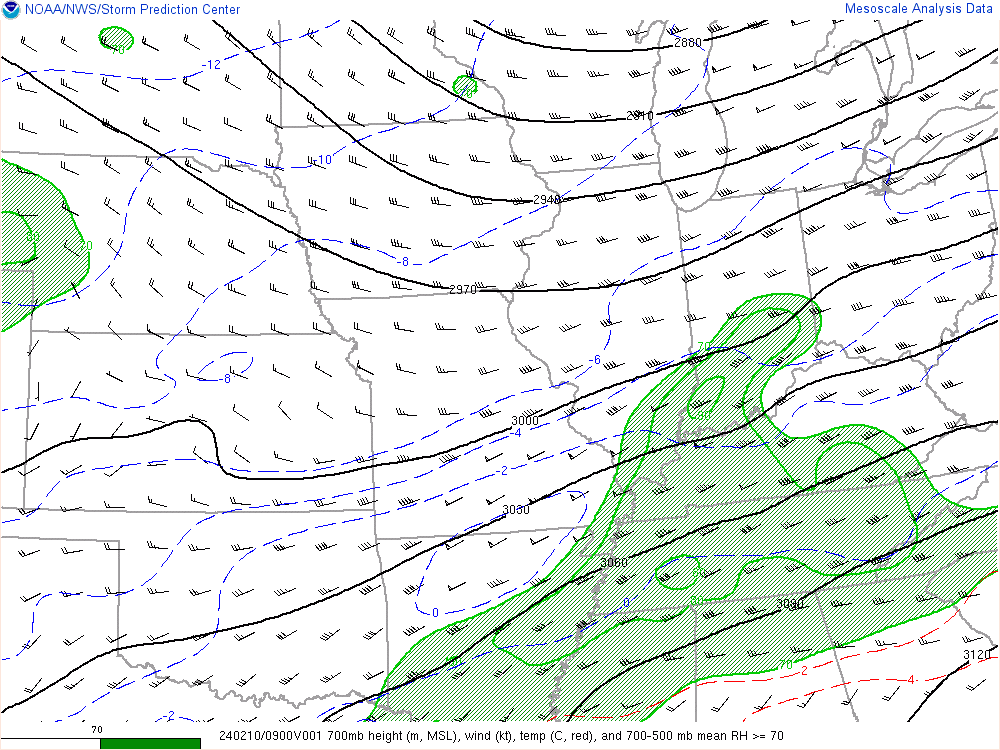 |
| Figure 1: 300 mb | Figure 2: 500 mb | Figure 3: 700 mb |
 |
 |
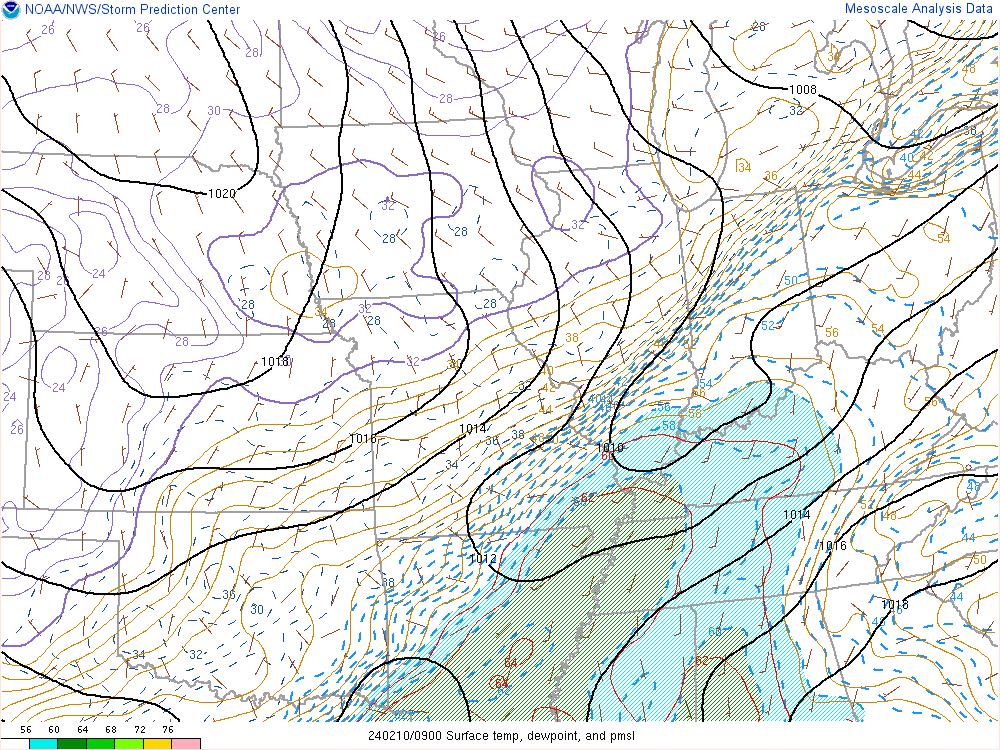 |
| Figure 4: 850 mb | Figure 5: 925 mb | Figure 6: Surface chart |
 |
 |
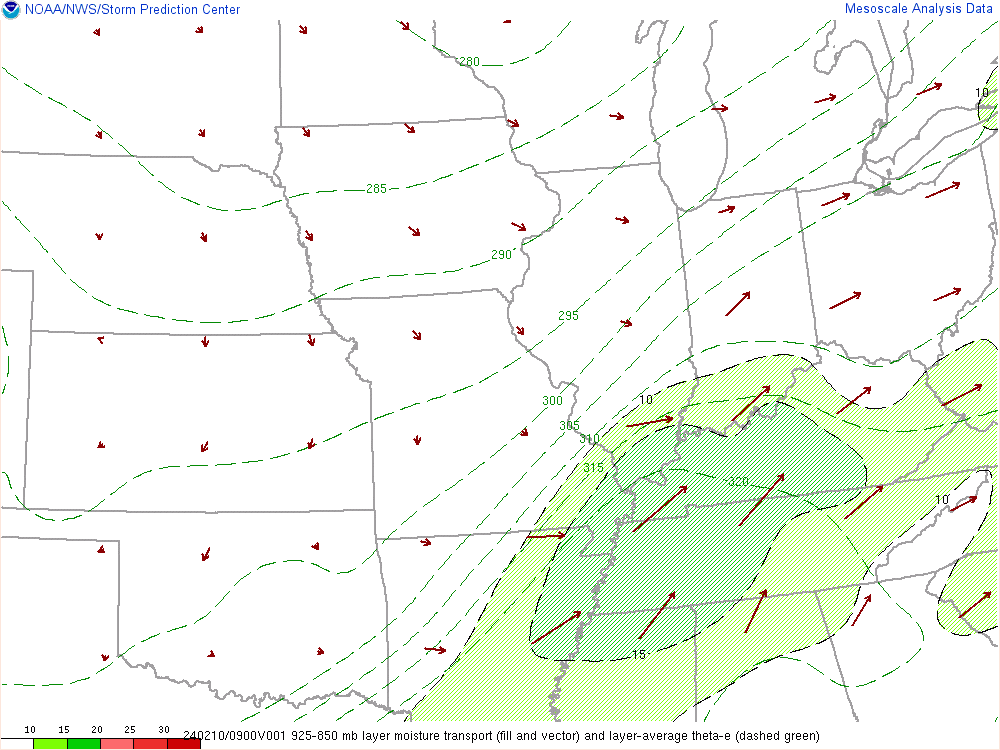 |
| Figure 7: 850 mb Temperature Advection | Figure 8: Deep Layer Moisture Convergence | Figure 9: 925-850 mb Moisture Transport |
 |
 |
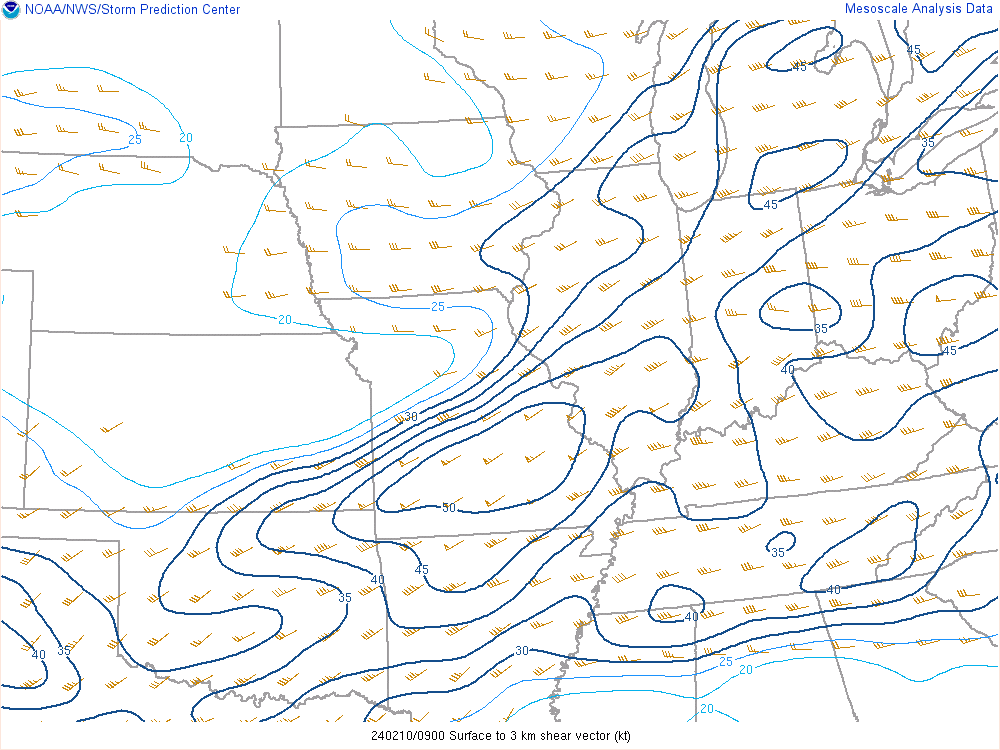 |
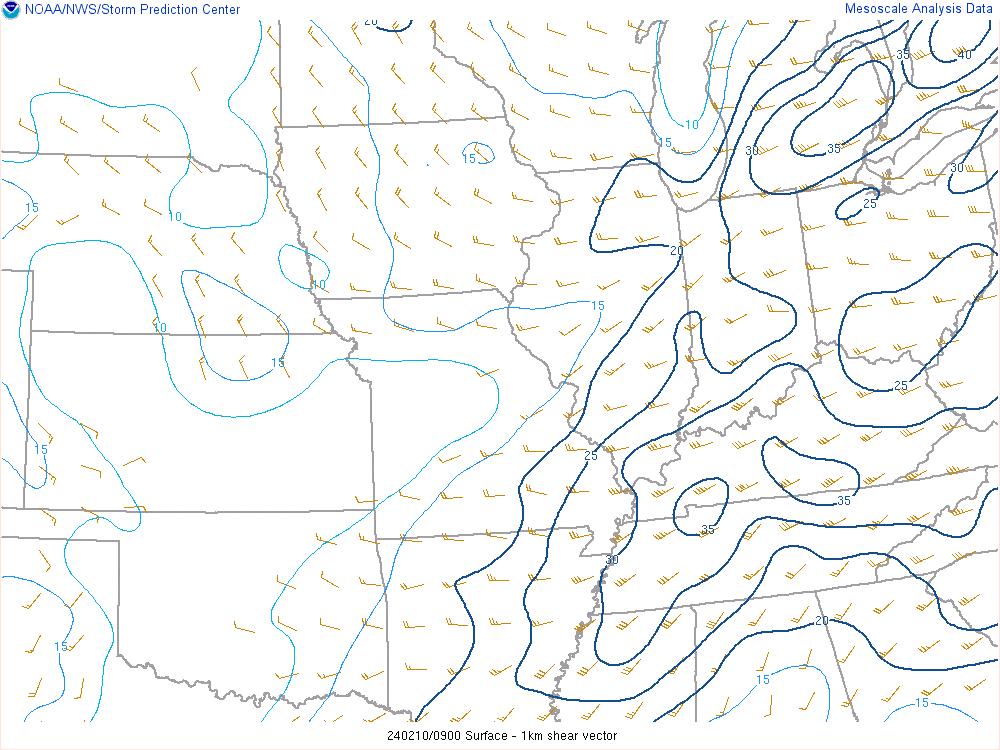
| Figure 10: Effective Bulk Shear (kts) | Figure 11: 0-1 km Shear | Figure 12: 0-3 km Shear |
 |
 |
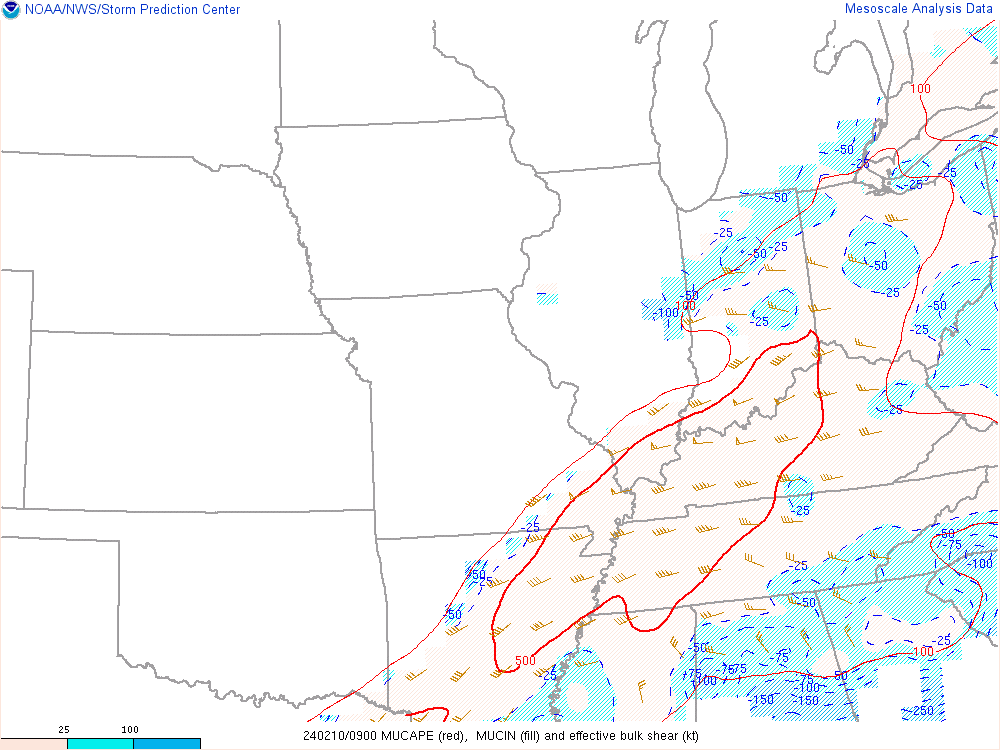 |
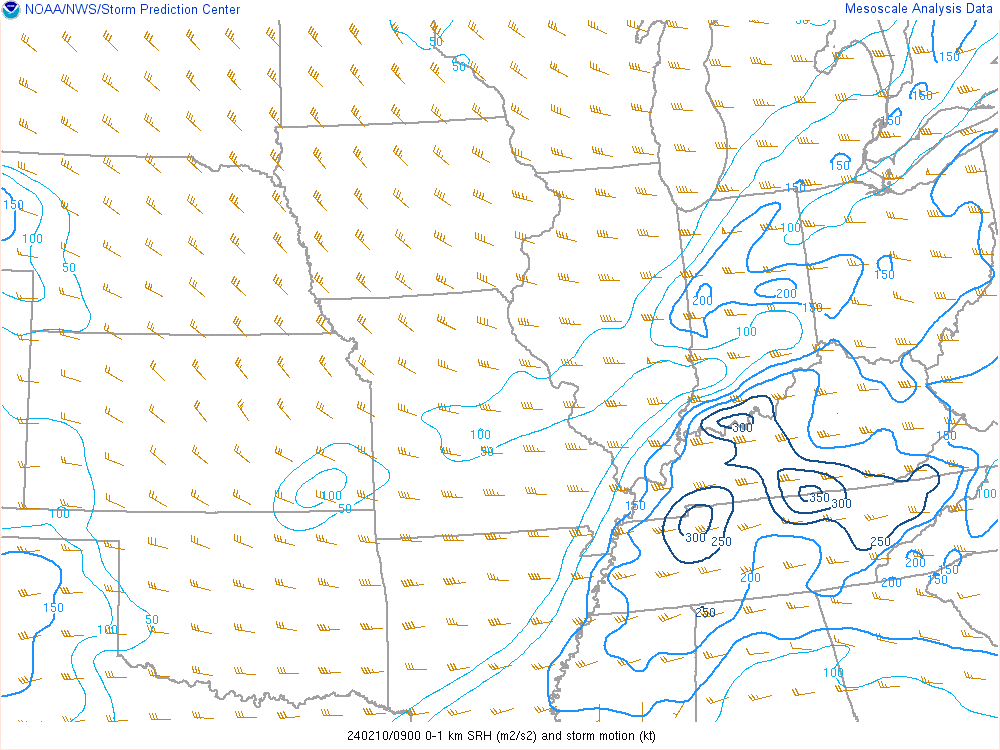
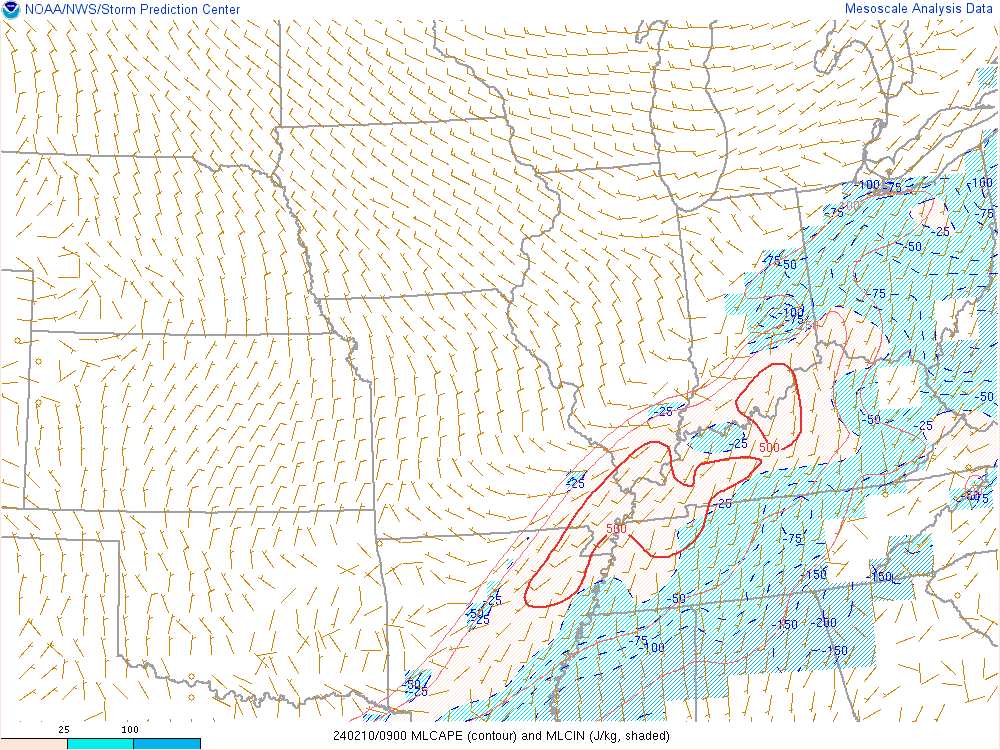
| Figure 13: 0-1 km Storm Relative Helicity | Figure 14: MLCAPE and MLCIN | Figure 15: Most Unstable CAPE |
 |
Media use of NWS Web News Stories is encouraged! Please acknowledge the NWS as the source of any news information accessed from this site. |
|


 Weather Story
 Weather Map
 Local Radar