Overview
|
An MCS moved across the Ohio Valley on the night of June 17th, 2026 and the morning of June 18th, 2026. Supercells congealed into a line of storms as it moved south into southern Indiana and northern Kentucky. These storms brought severe winds and a few tornadoes to the area. Additionally, long residence time of heavy rainfall lead to flash flooding that lasted through most of the day on June 18th, 2026. |
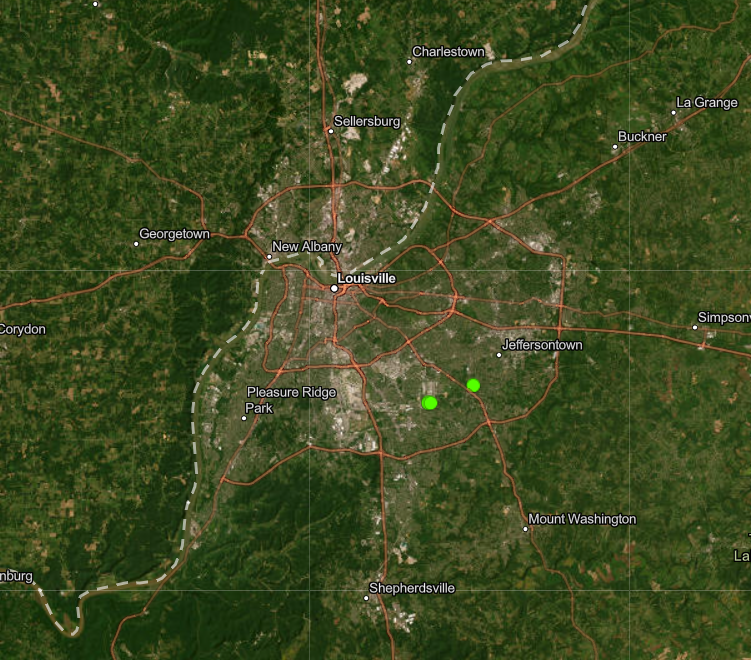 Straight-line Wind Damage near Fern Creek in the Louisville Metro area. |
Tornadoes
Select a tornado from the table to zoom into the track and view more information. The default table view is limited to 8 tracks, but can be scrolled by a mouse wheel or dynamically expanded. Additionally, the table can fill the entire window by clicking the small circular expanding arrow icon at the very top right of the table and returned to its original size by clicking the button again. The side information panel that opens over the map can be closed using the "X" on the upper right corner of the pop-up. Zoom into the map and click damage points to see detailed information and pictures from the surveys.
|
NOTE: times shown below are local to your device's time zone. |

The Enhanced Fujita (EF) Scale classifies tornadoes into the following categories:
| EF0 Weak 65-85 mph |
EF1 Moderate 86-110 mph |
EF2 Significant 111-135 mph |
EF3 Severe 136-165 mph |
EF4 Extreme 166-200 mph |
EF5 Catastrophic 200+ mph |
 |
|||||
| Tornadoes that fail to impact any ratable damage indicators on the EF-Scale are rated EF-Unknown (EF-U) | |||||
Radar
Scott County IN - Jefferson County IN - Trimble County KY Tornado
 |
 |
 |
| Reflectivity - 0715Z | Storm Relative Motion - 0720Z | Correlation Coefficient - 0721Z |
Rain Reports
 |
| Rainfall from June 17-18, 2026 |
Storm Reports
 |
| Storm Reports from June 17-18, 2026 |
Photos & Video
 |
 |
 |
| Jefferson County, Indiana | Jefferson County, Indiana | Jefferson County, Indiana |
Environment
 |
 |
 |
| Figure 1: 500mb | Figure 2: 850mb | Figure 3: Moisture Advection |
 |
 |
 |
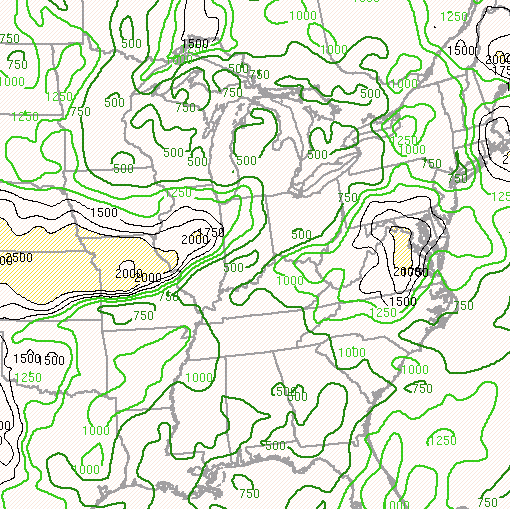
| Figure 4: 0-6km Shear | Figure 5: 0-1km Shear | Figure 6: 0-1km Storm Relative Helicity |
 |
 |
 |
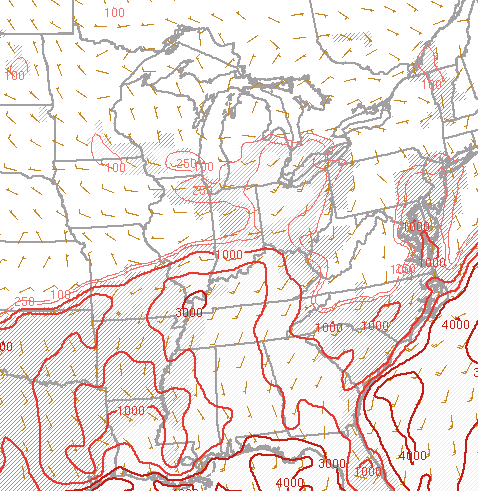
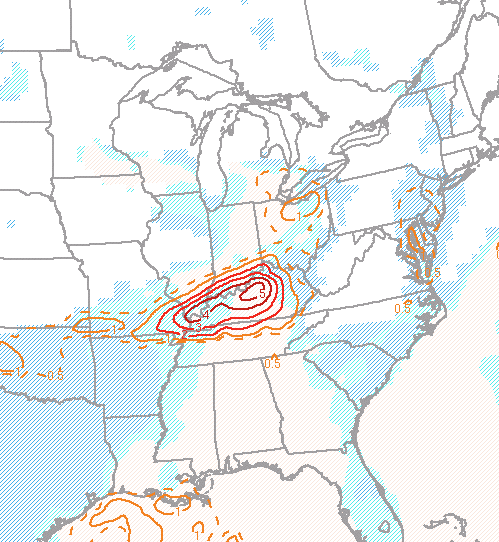
| Figure 7: Surface-Based CAPE | Figure 8: Significant Tornado Parameter | Figure 9: LCL |
Additional Information
The Forecast
 |
 |
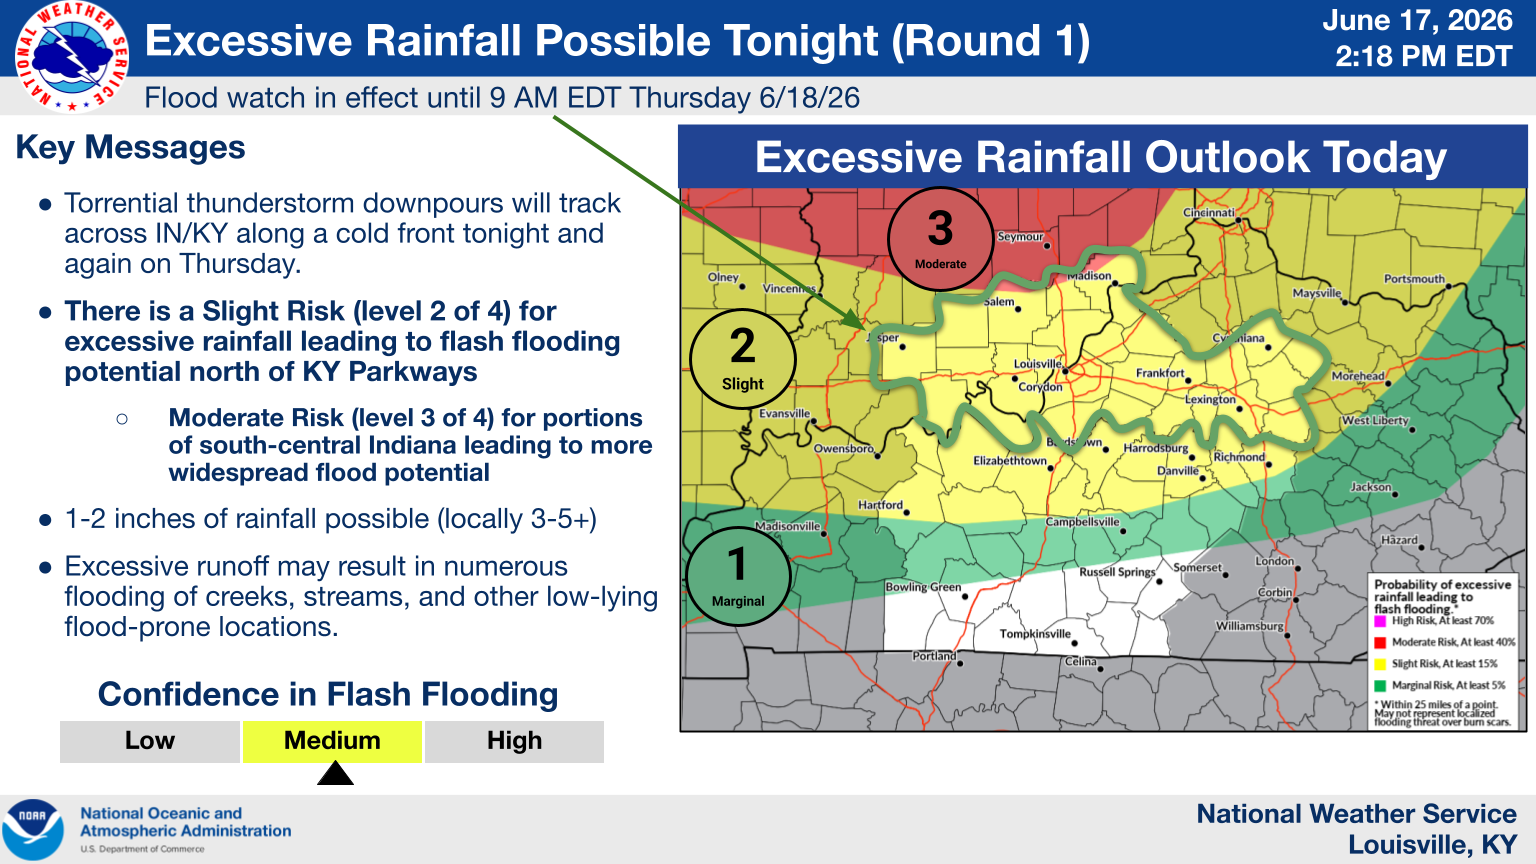 |
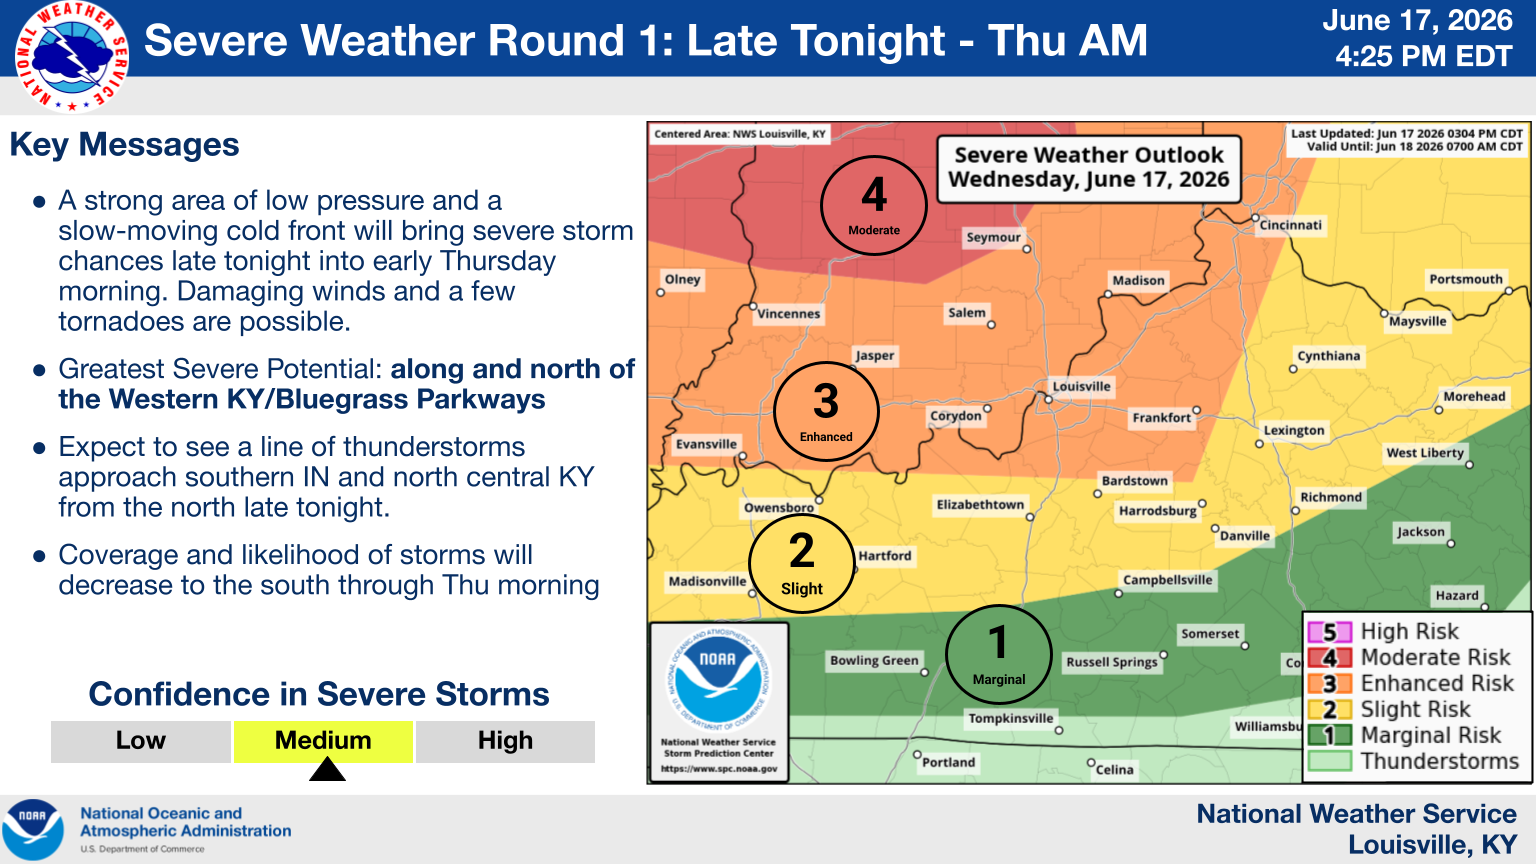
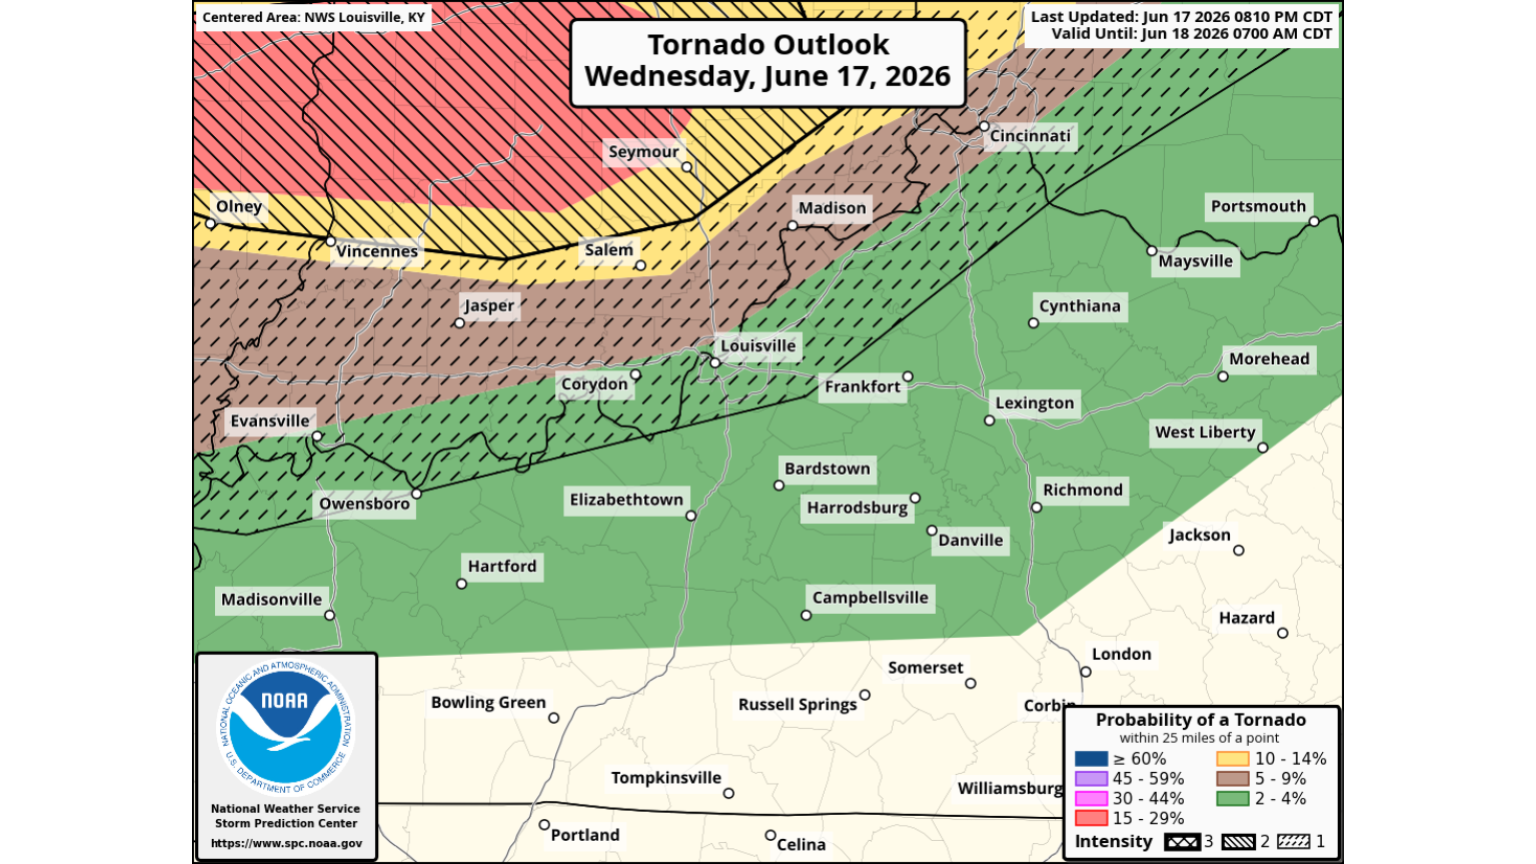
| SPC Day 1 Categorical Outlook | SPC Day 1 Probabilistic Outlook | WPC Day 1 Categorical Outlook |
 |
Media use of NWS Web News Stories is encouraged! Please acknowledge the NWS as the source of any news information accessed from this site. |
|


 Weather Story
 Weather Map
 Local Radar