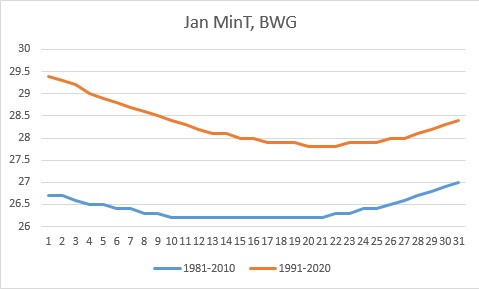
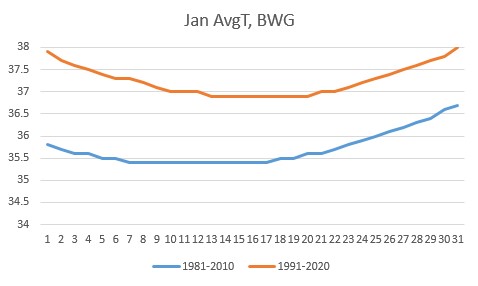
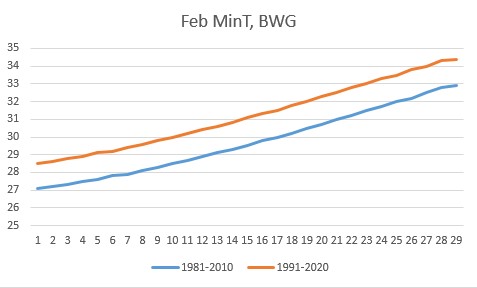
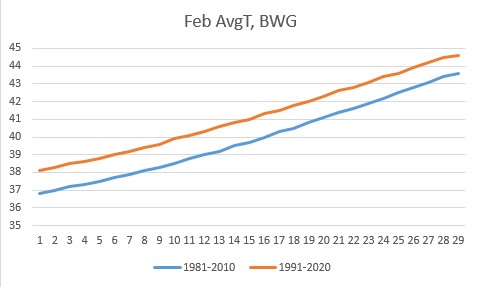
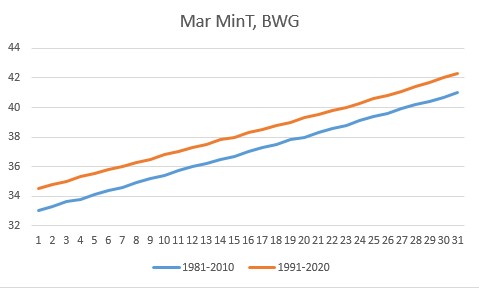
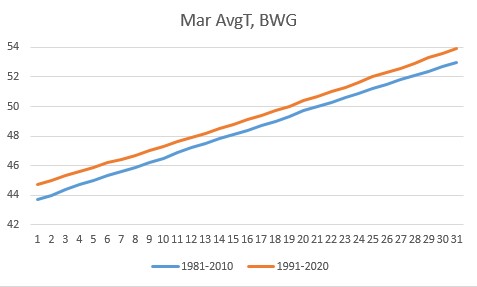
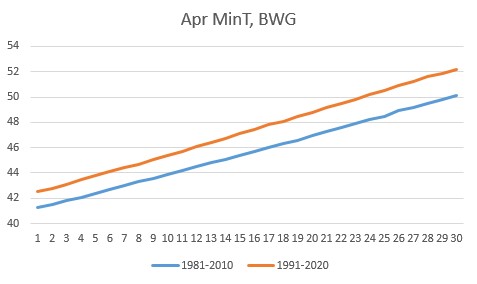
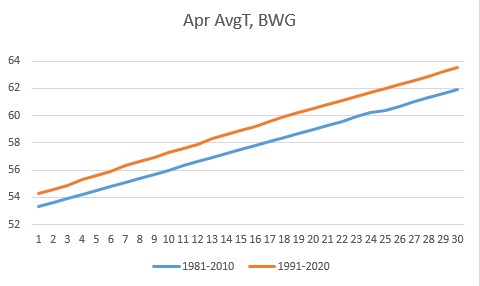
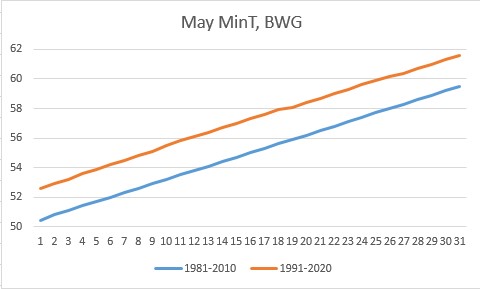
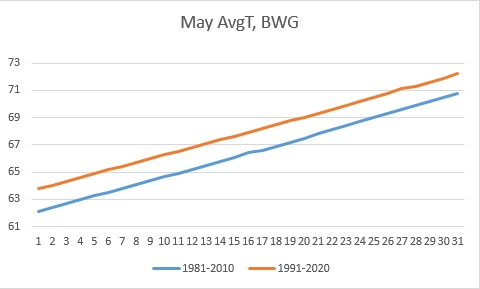
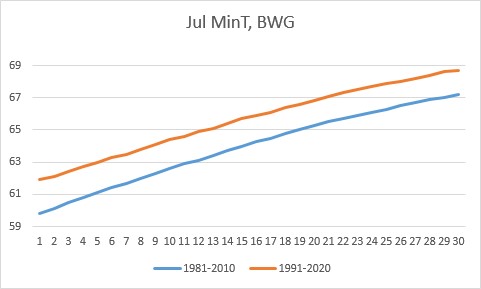
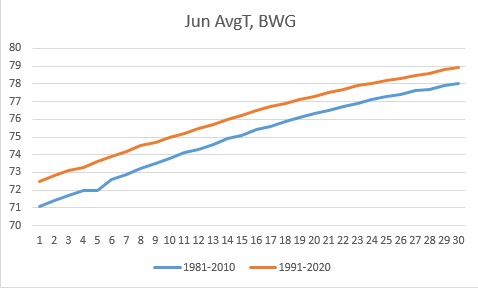
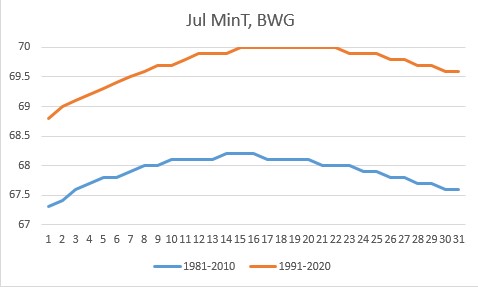
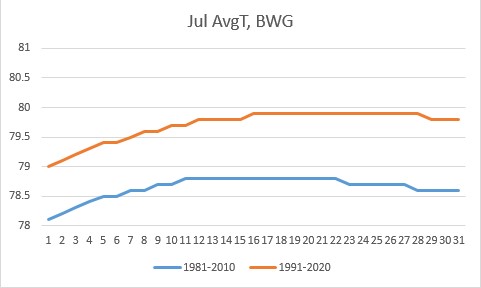
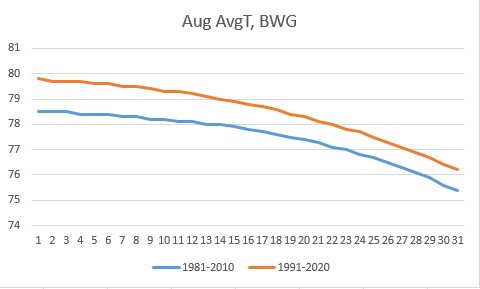
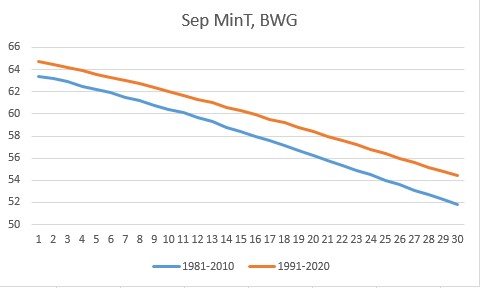
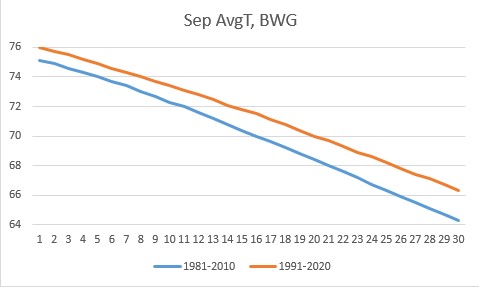
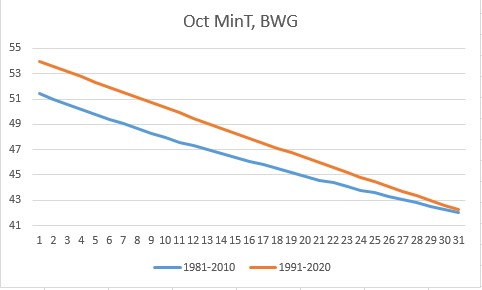
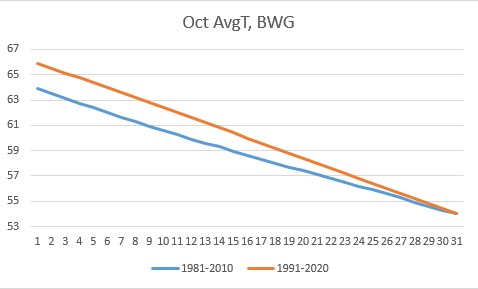
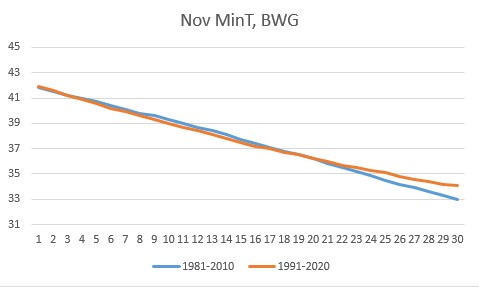
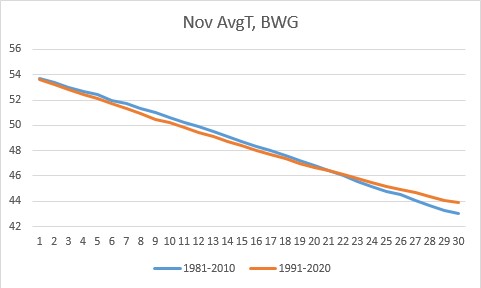
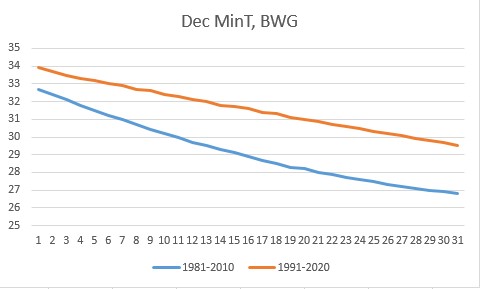
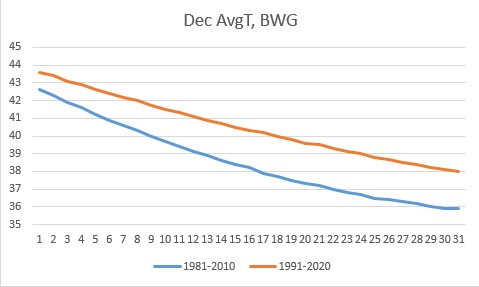
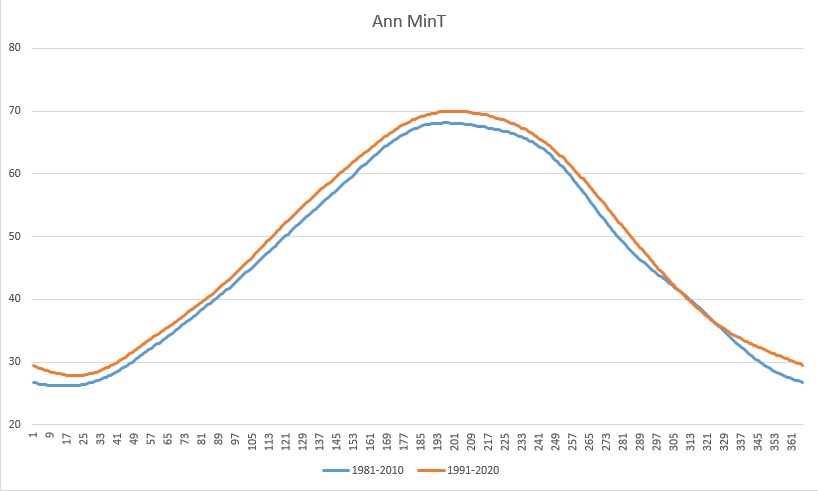
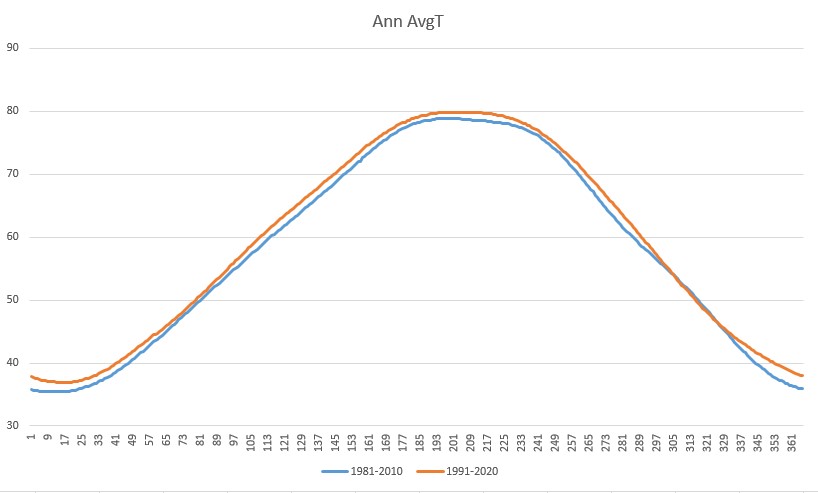
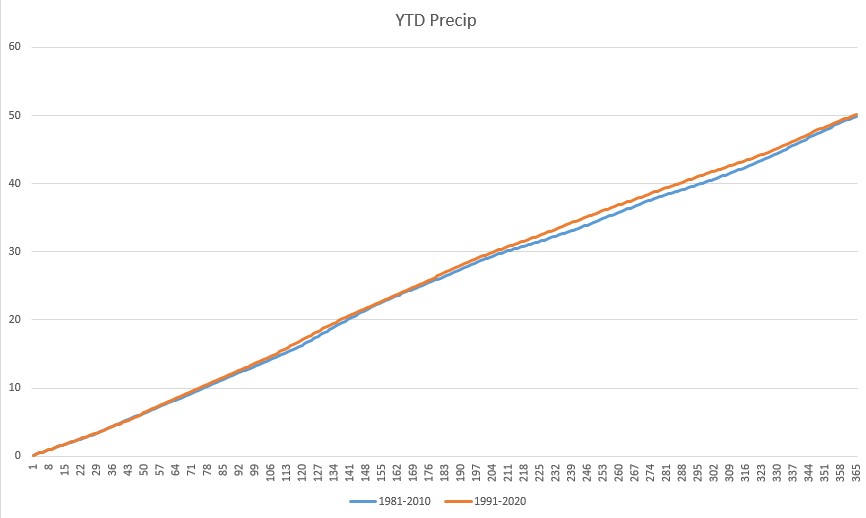
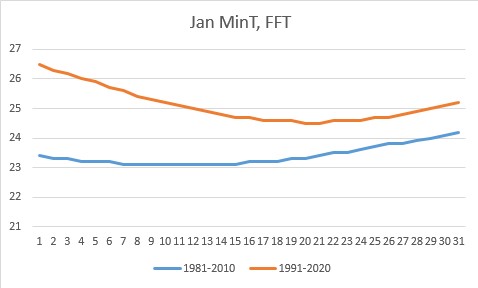
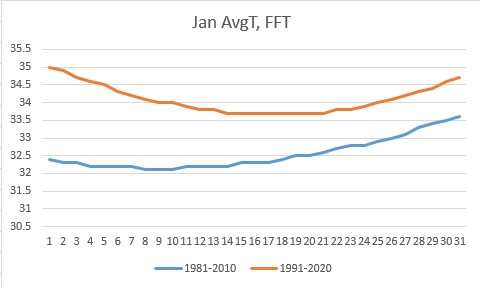
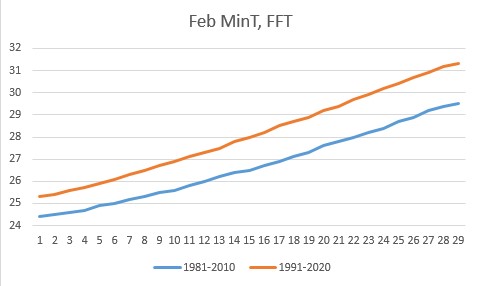
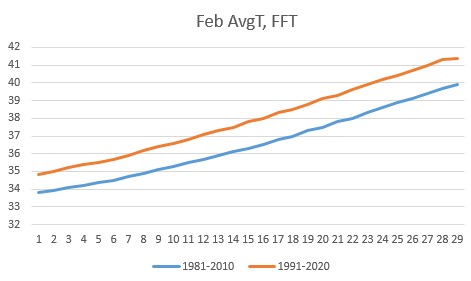
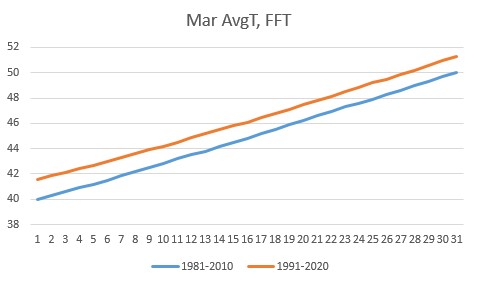
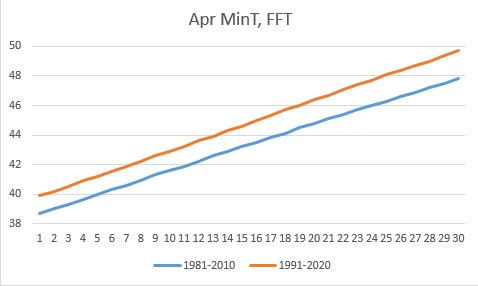
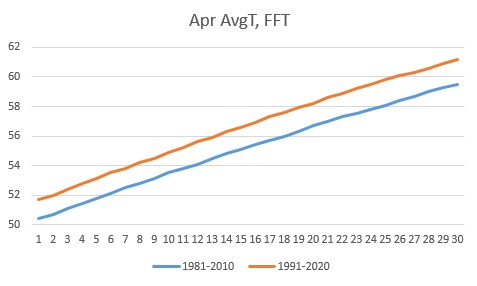
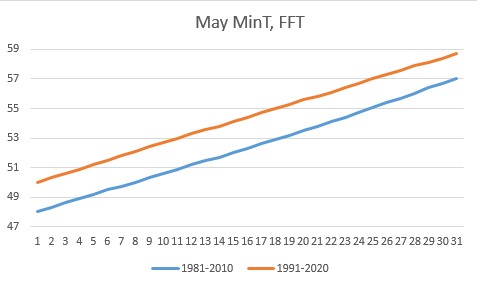
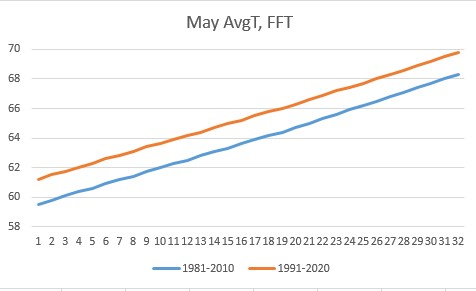
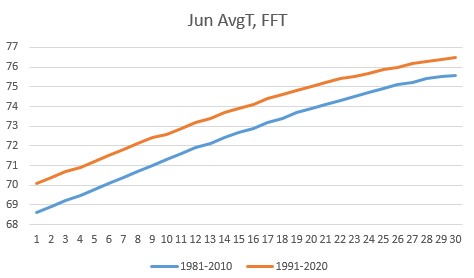
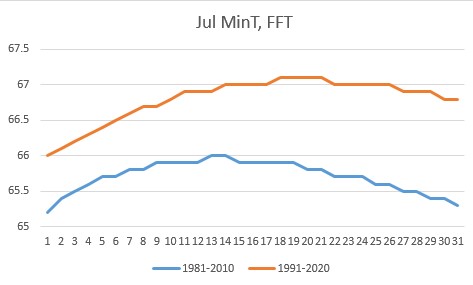
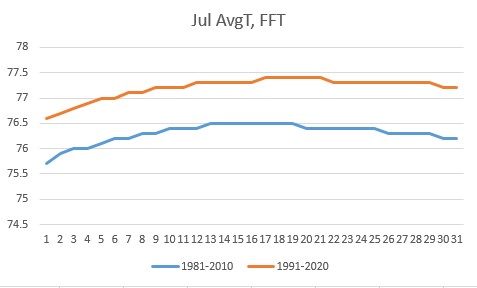
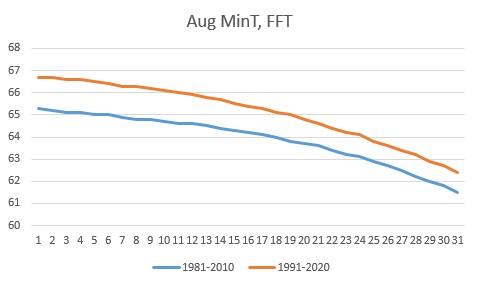
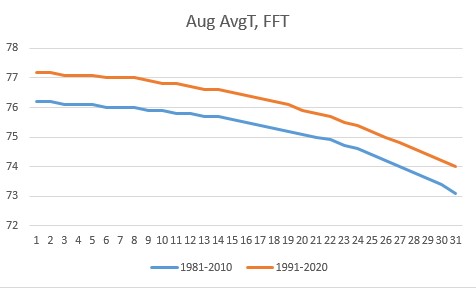
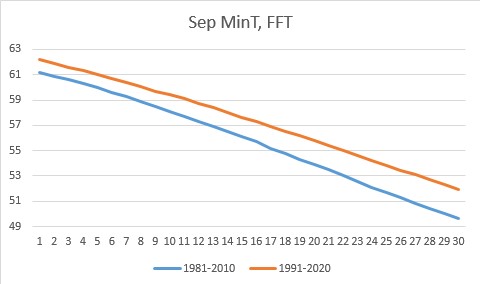
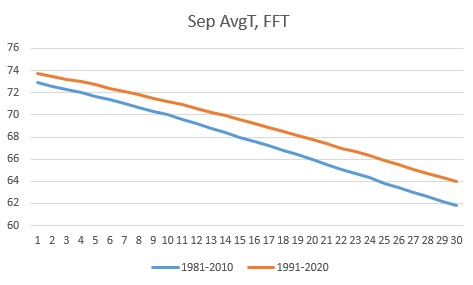
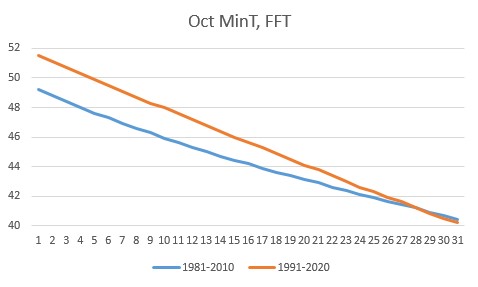
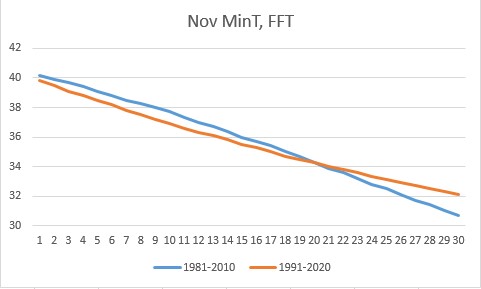
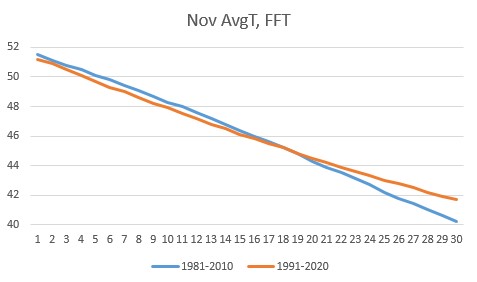
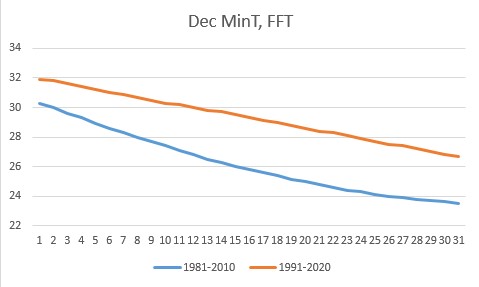
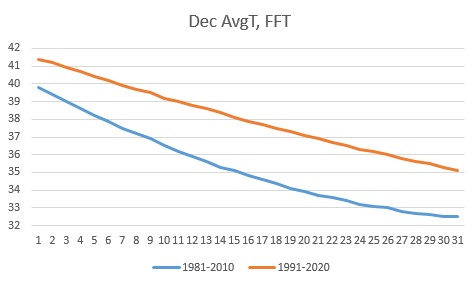
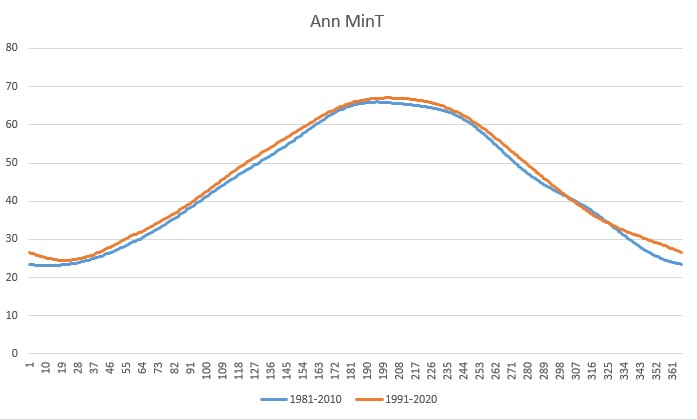
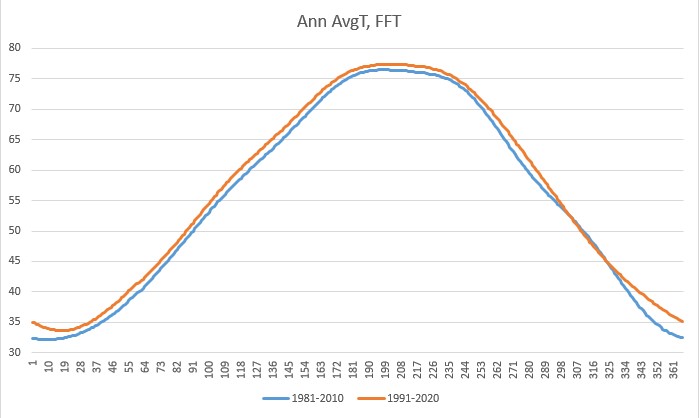
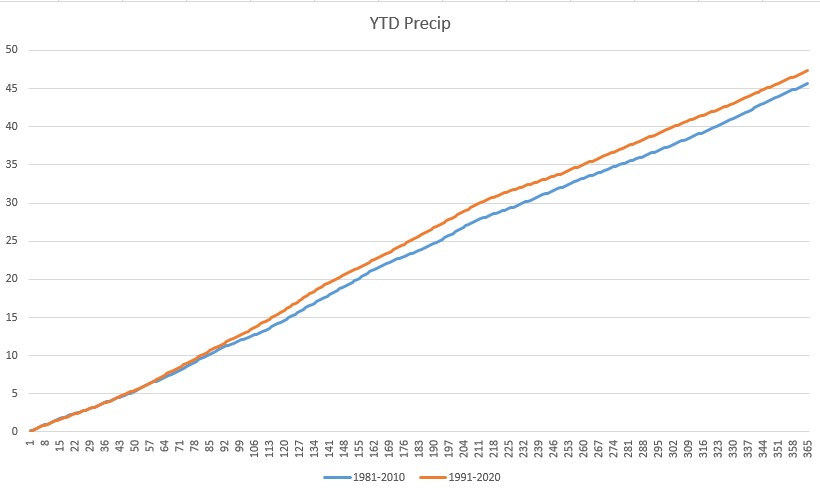
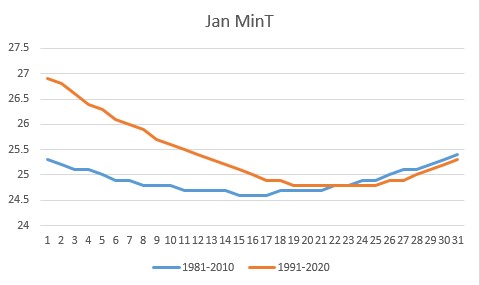
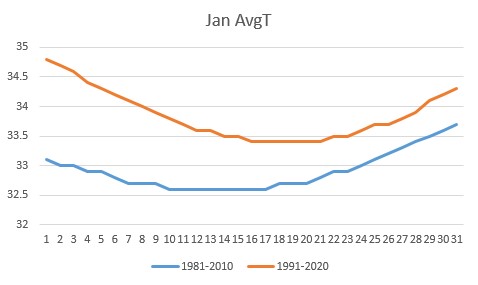
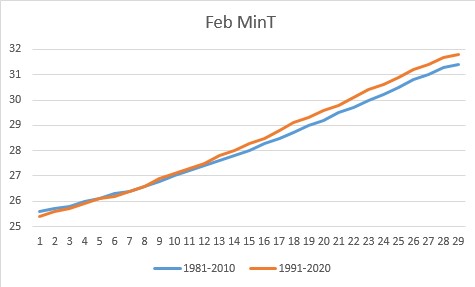
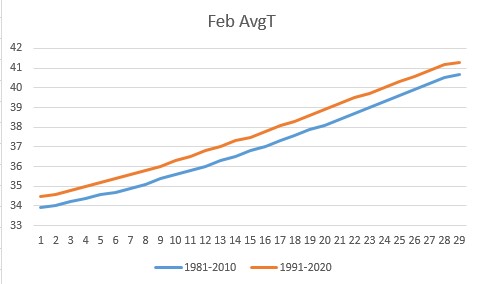
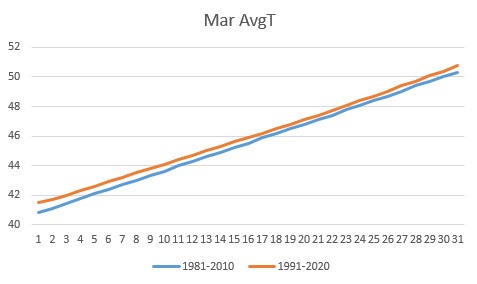
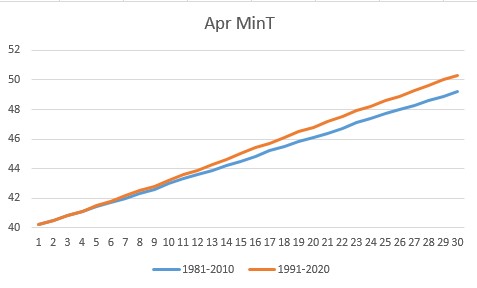
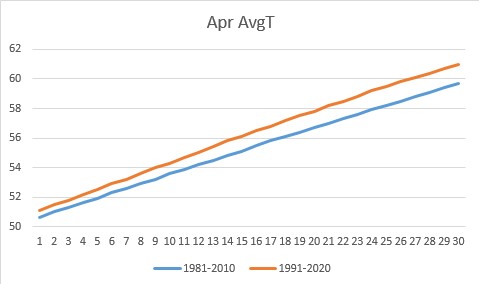
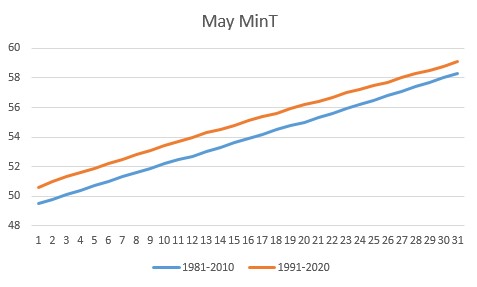
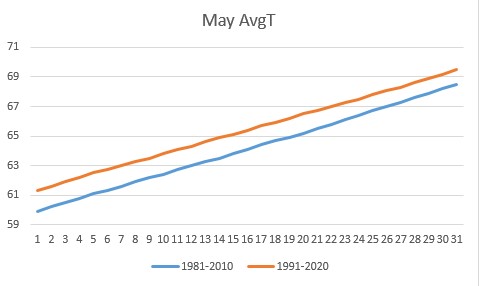
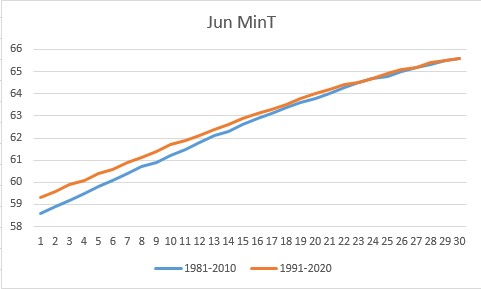
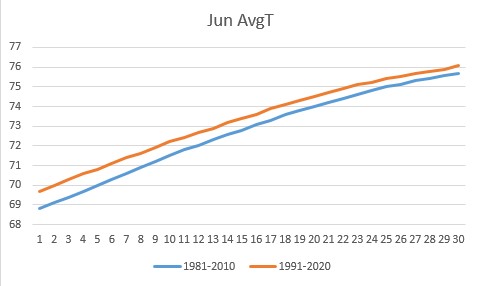
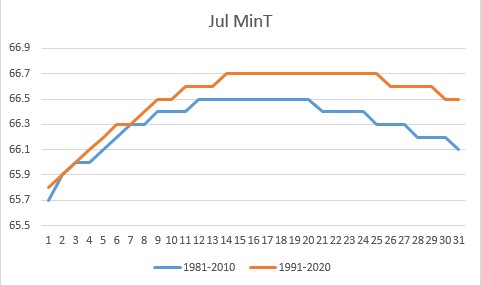
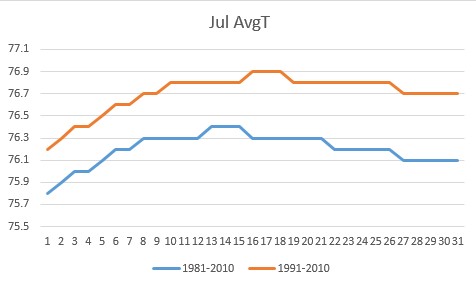
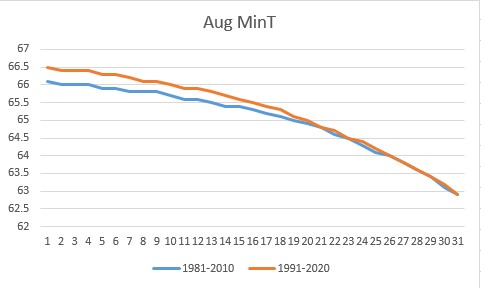
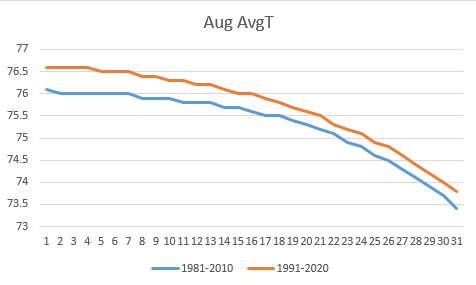
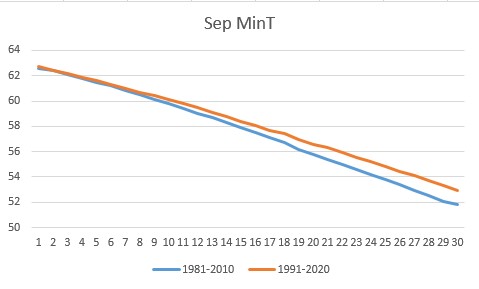
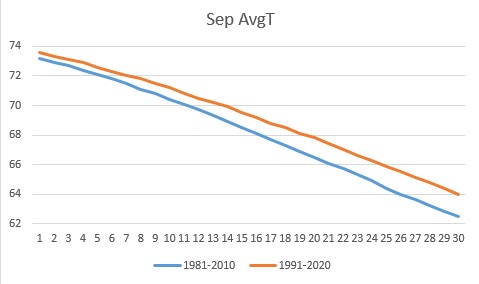
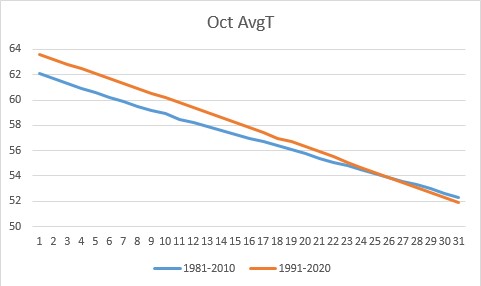
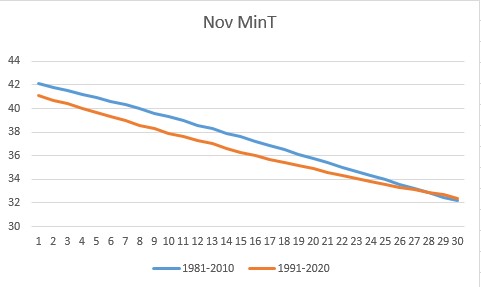
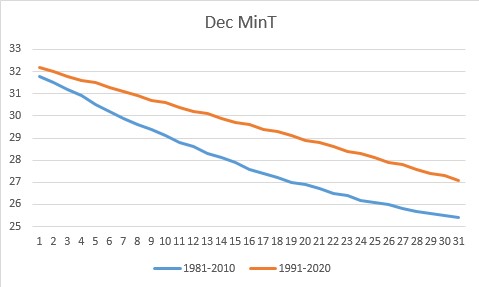
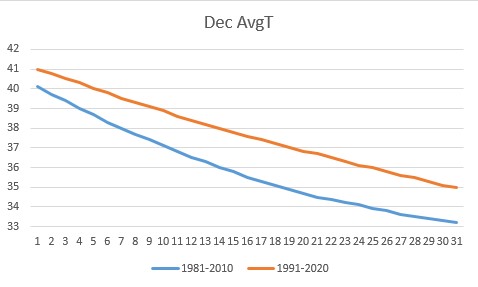
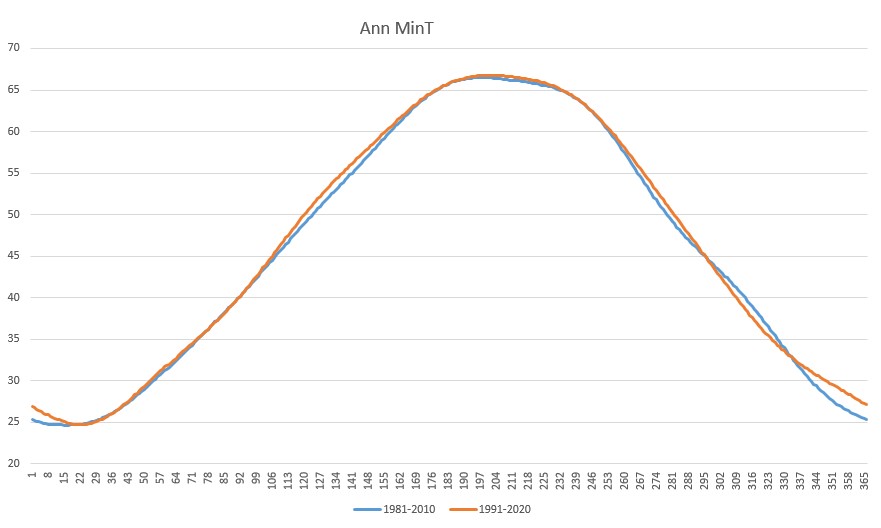
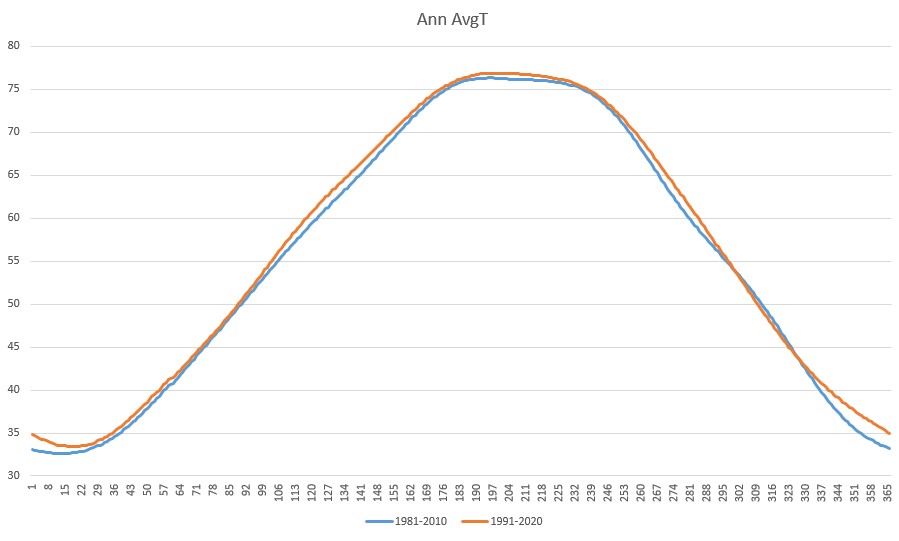
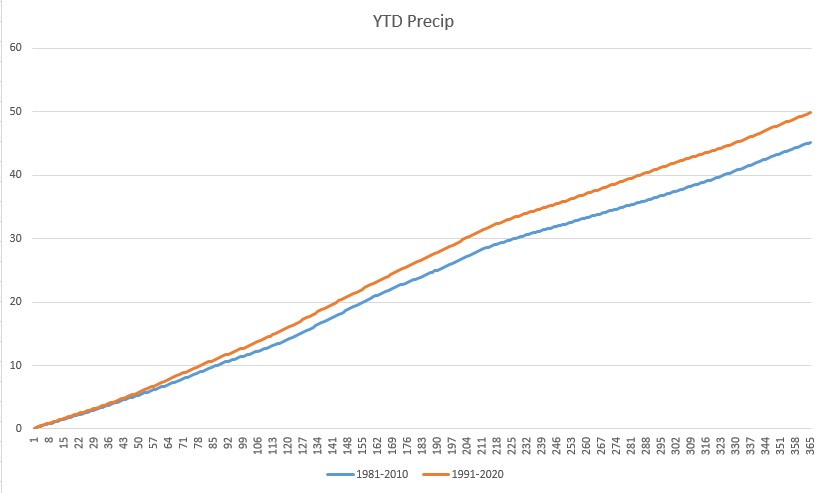
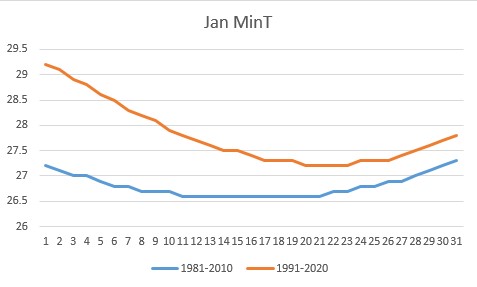
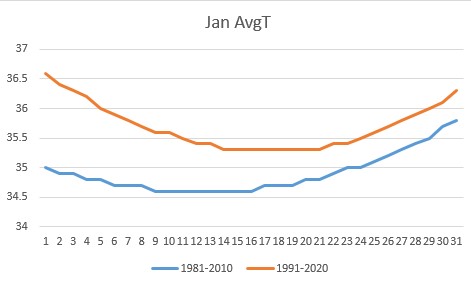
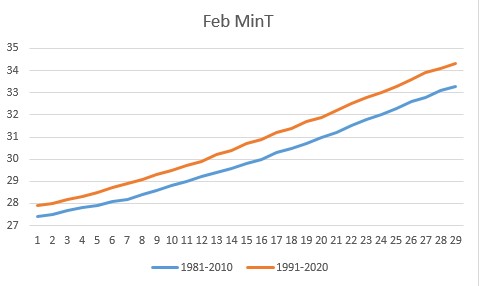
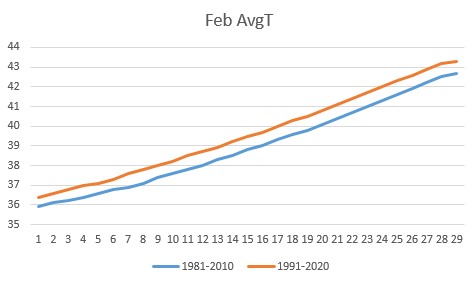
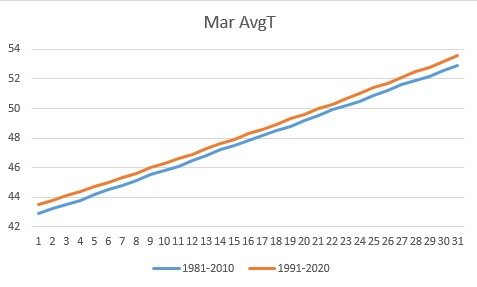
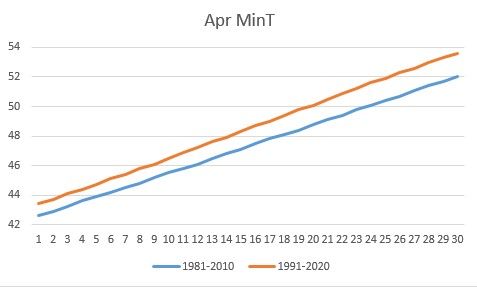
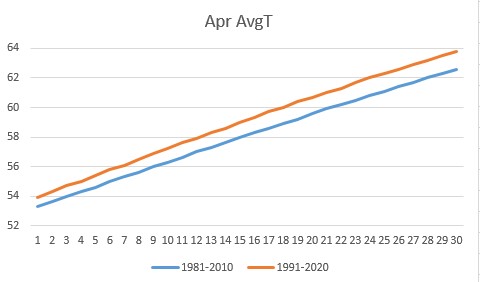
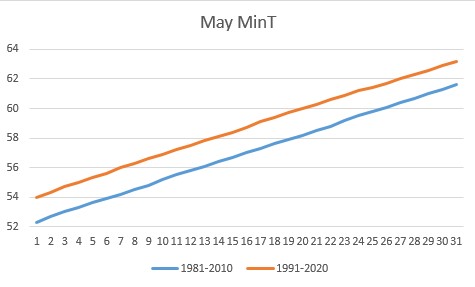
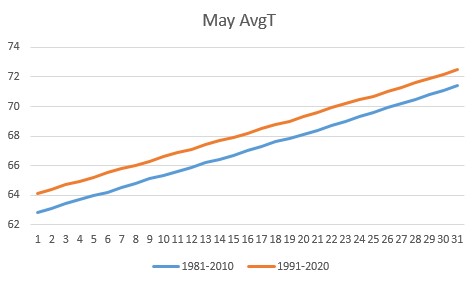
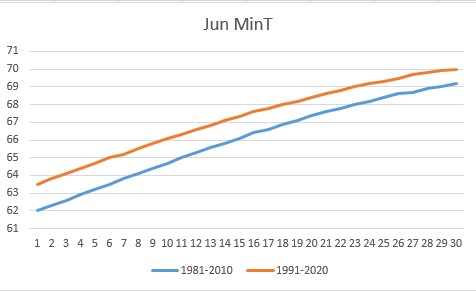
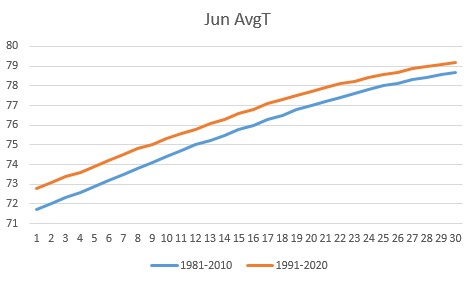
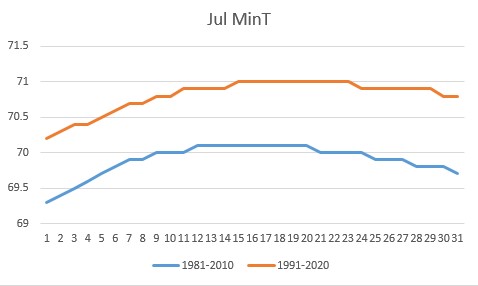
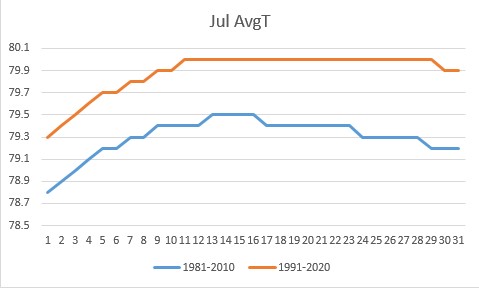
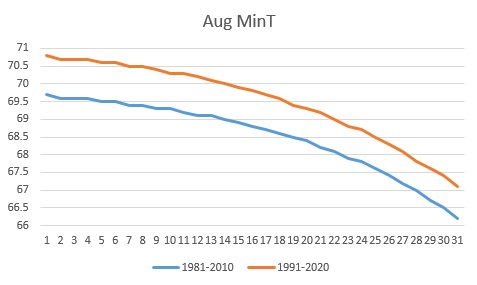
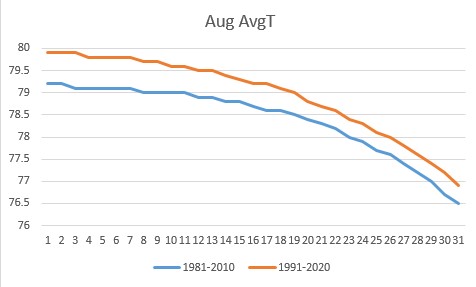
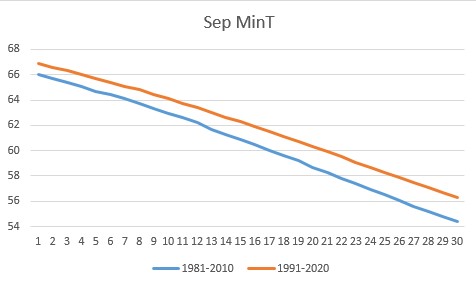
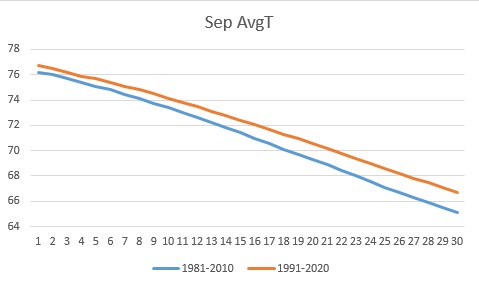
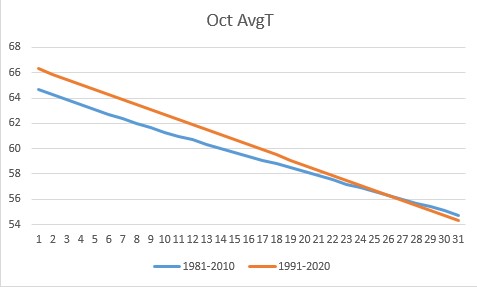
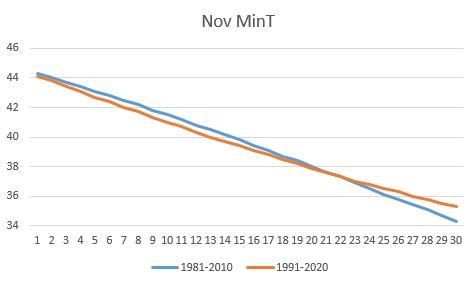
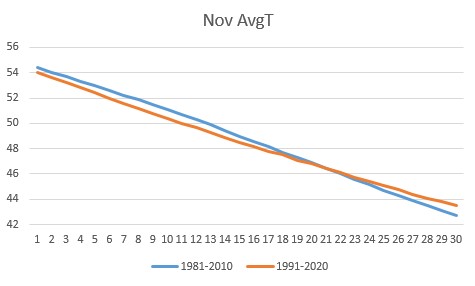
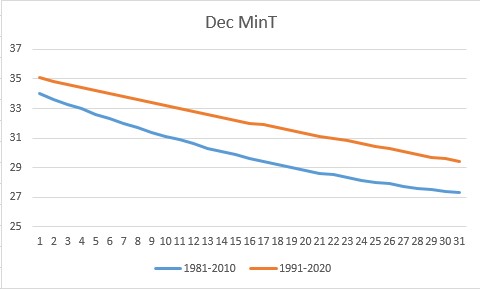
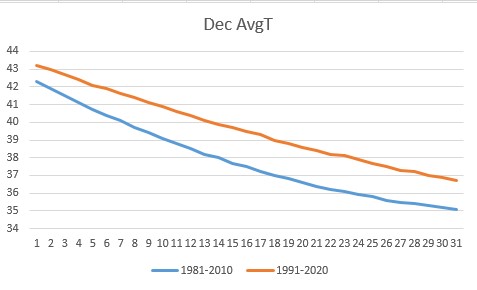
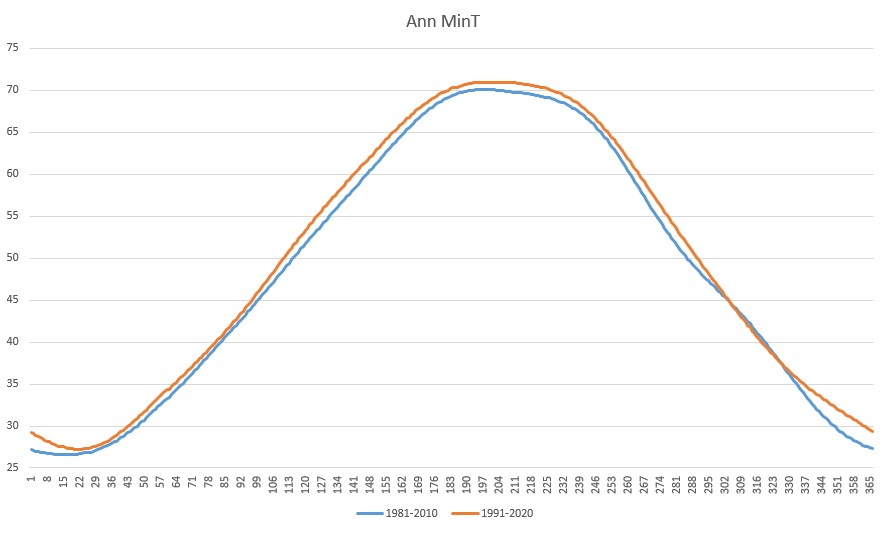
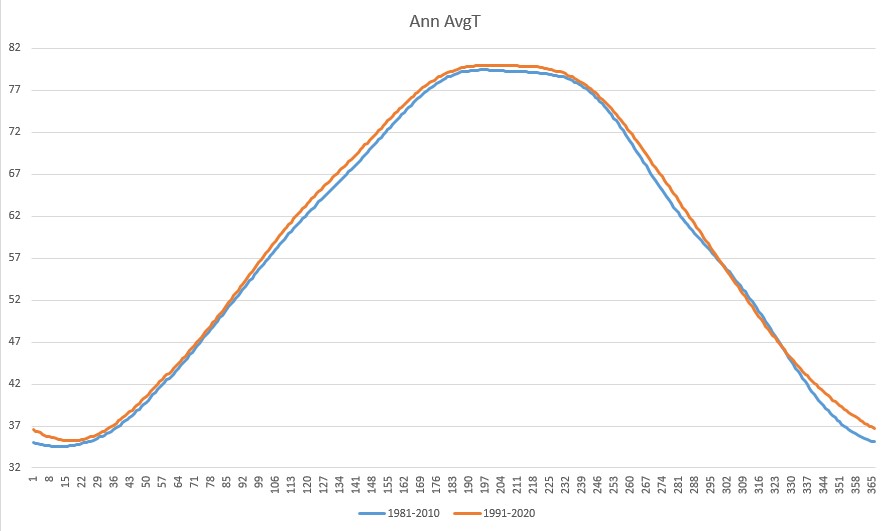
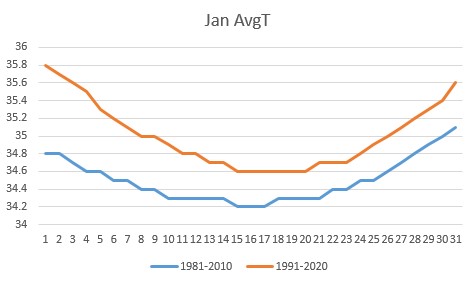
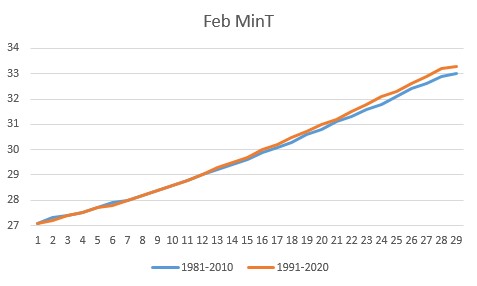
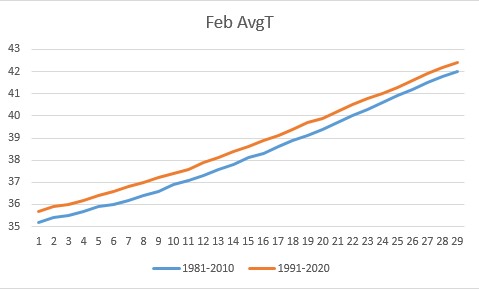
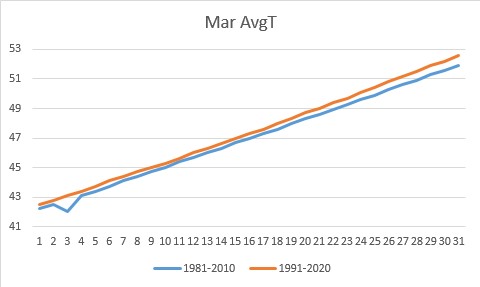
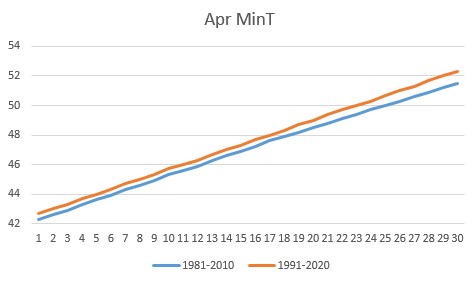
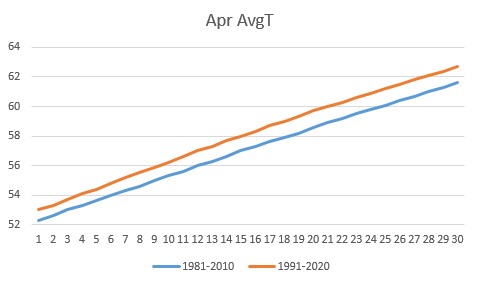
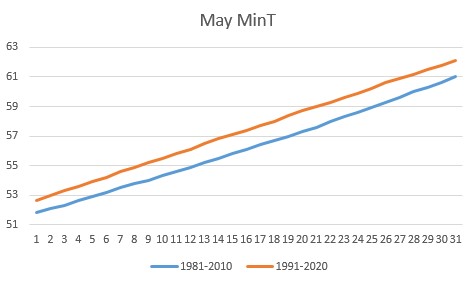
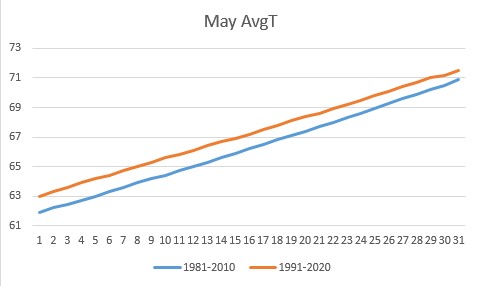
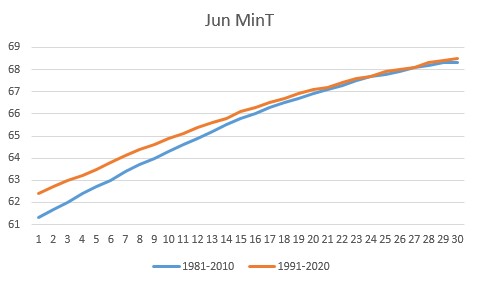
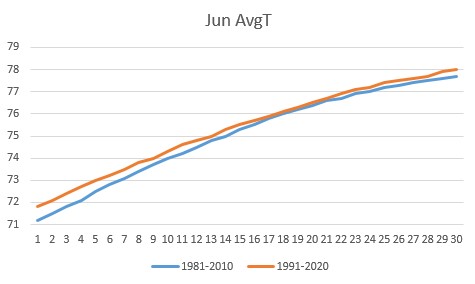
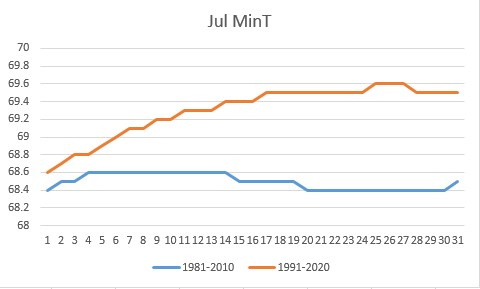
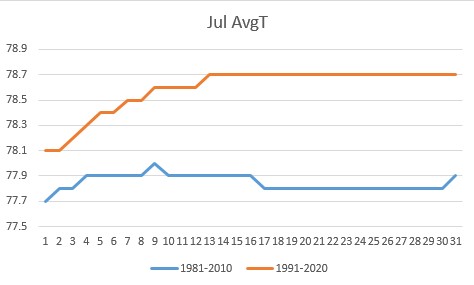
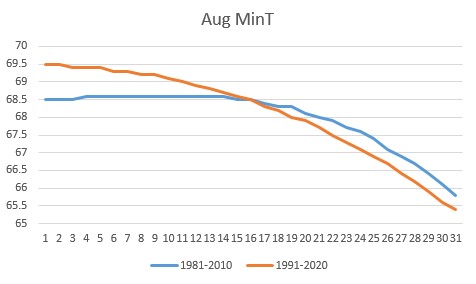
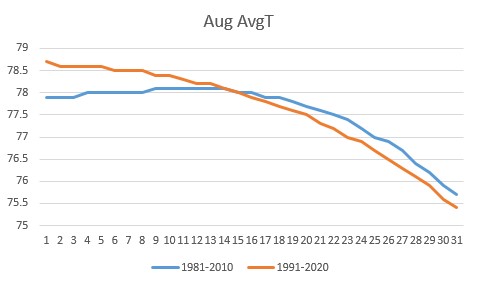
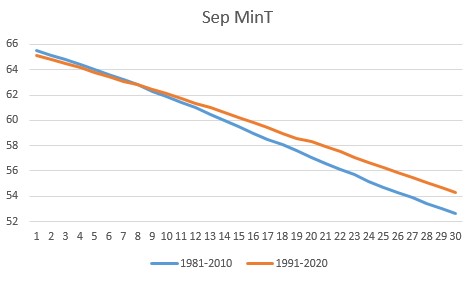
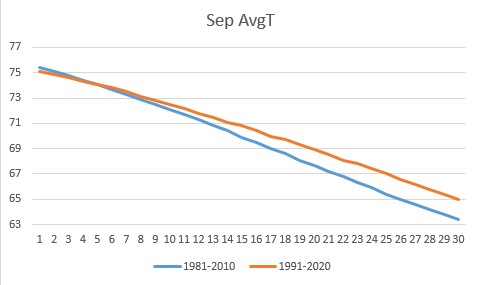
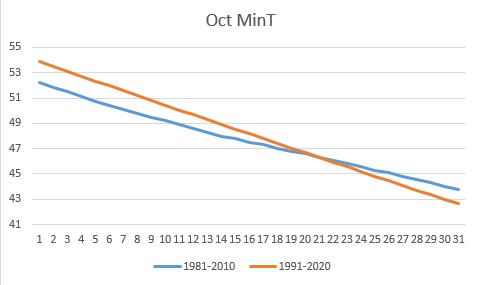
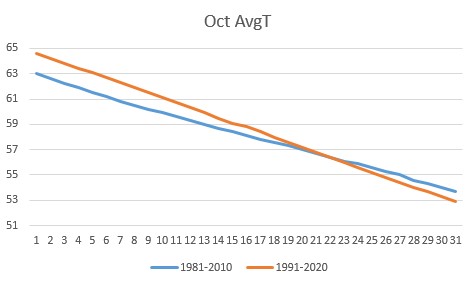
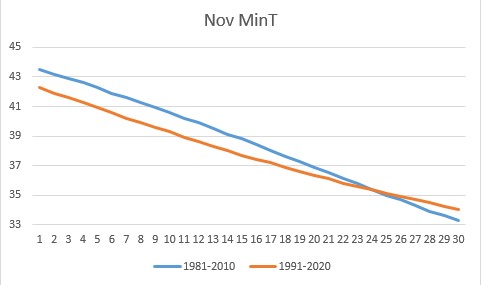
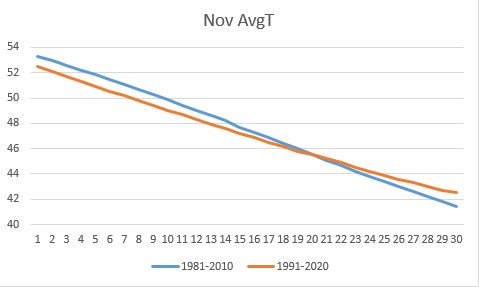
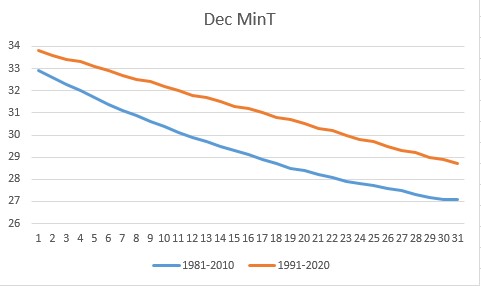
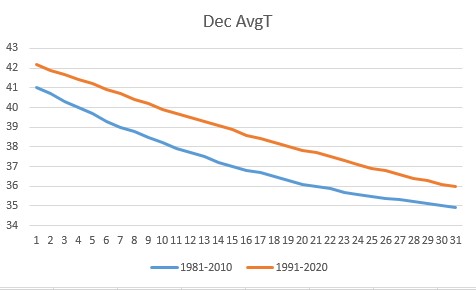
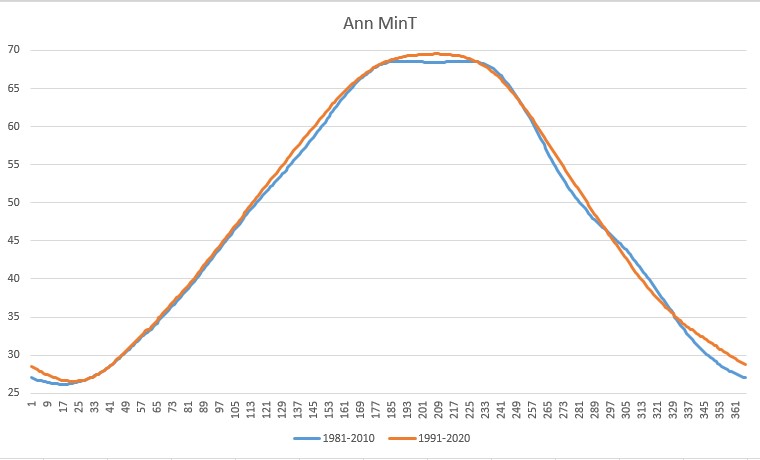
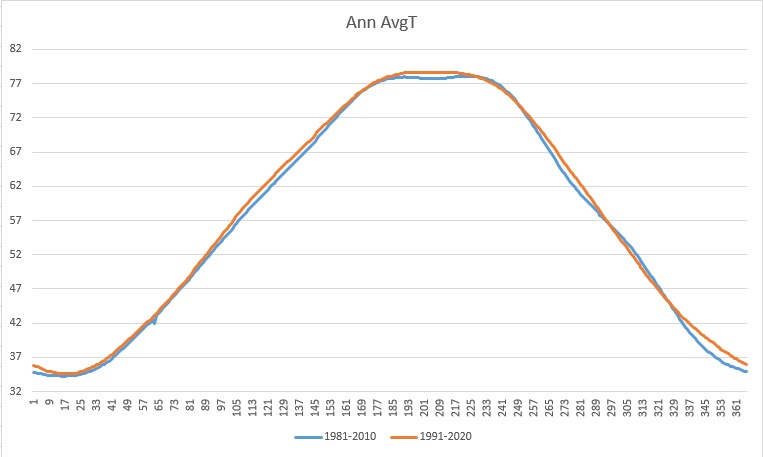
These graphs show approximately how the previous package of normals (1981-2010, in blue) compares to the current one (1991-2020, in orange). These graphs directly compare the two datasets. To create a truly equal basis for comparison, one would need to recalculate the old normals with the data management and computation strategies that were used for the new normals. However, according to a spokesperson from the National Centers for Environmental Information (NCEI), the results from using the recalculation technique should not vary significantly from the results of a direct comparison. Once NCEI makes those recalculated normals available, a new comparison can be developed. In the meantime, the direct comparison shown in the following graphs should still give a general impression of how the normals changed from the old package to the new.
Jump to:
| Bowling Green | Frankfort | Lexington | Louisville Ali | Louisville Bowman |
| Daily High Temperature | Daily Low Temperature | Daily Average Temperature | |
| January | 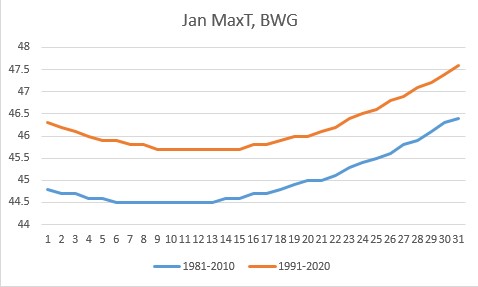 |
 |
 |
| February | 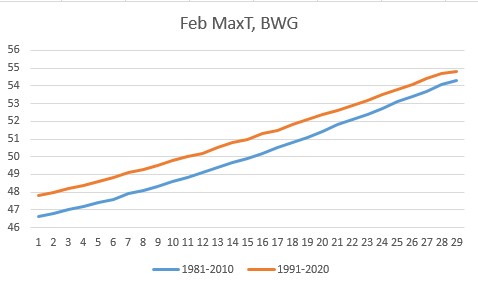 |
 |
 |
| March | 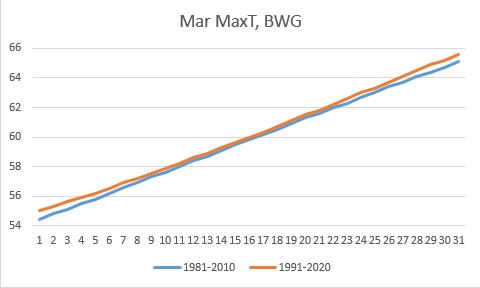 |
 |
 |
| April | 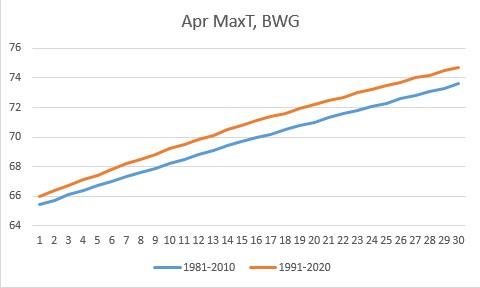 |
 |
 |
| May | 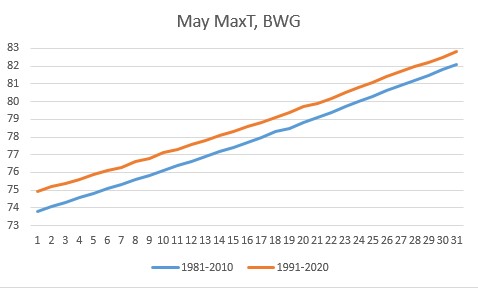 |
 |
 |
| June | 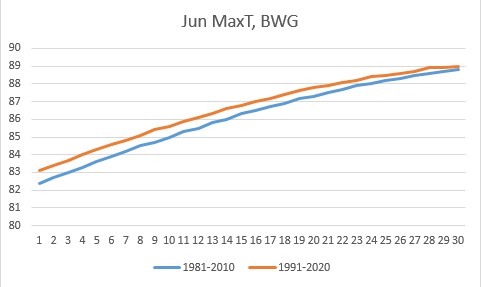 |
 |
 |
| July | 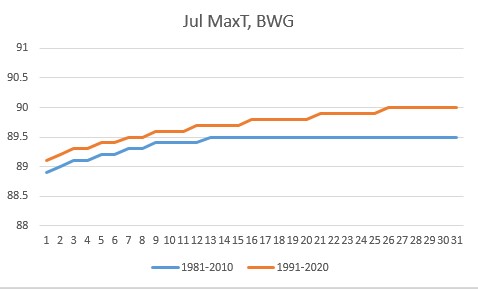 |
 |
 |
| August | 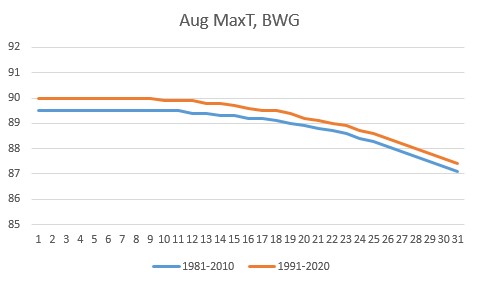 |
 |
 |
| September | 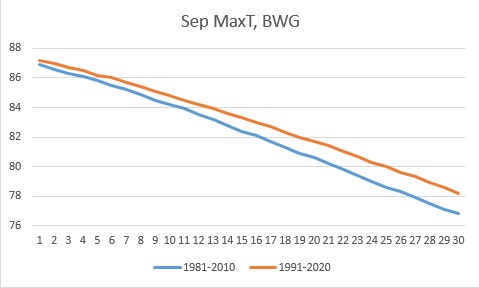 |
 |
 |
| October | 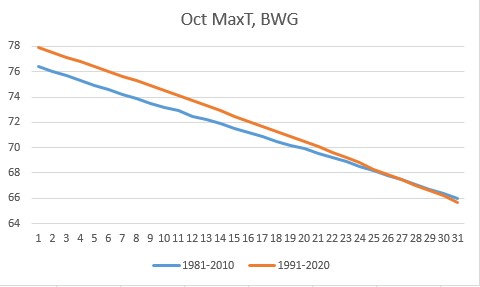 |
 |
 |
| November | 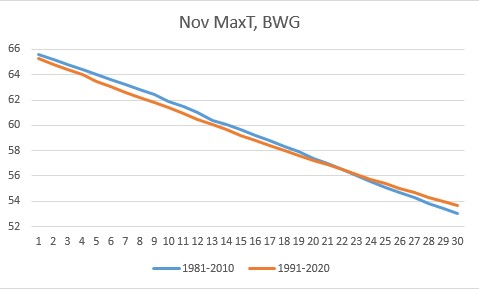 |
 |
 |
| December | 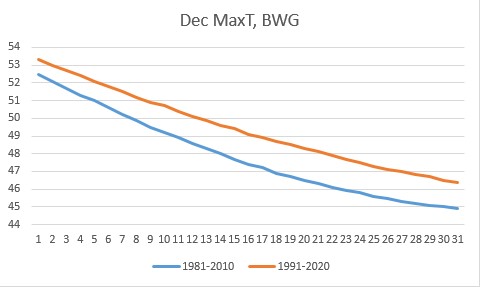 |
 |
 |
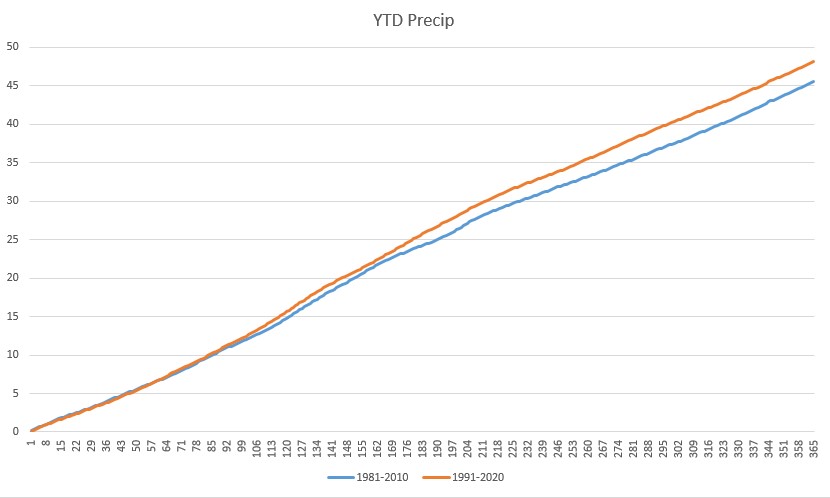
| Annual | 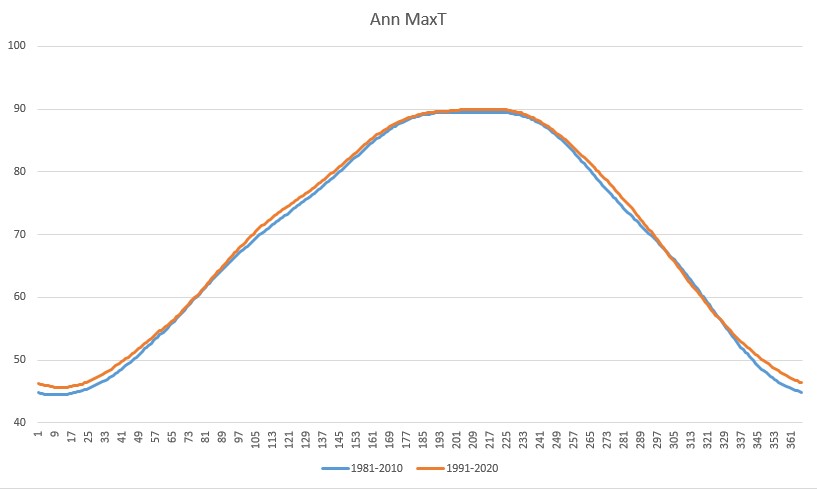 |
 |
 |
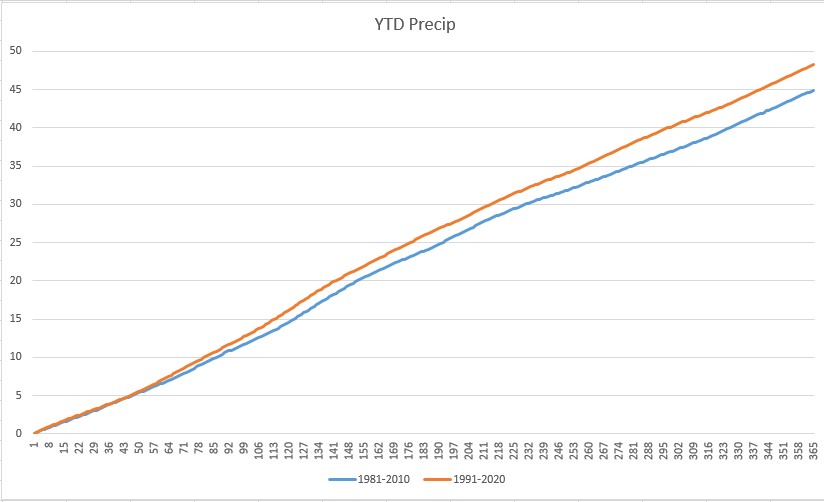
Annual Precipitation
| Daily High Temperature | Daily Low Temperature | Daily Average Temperature | |
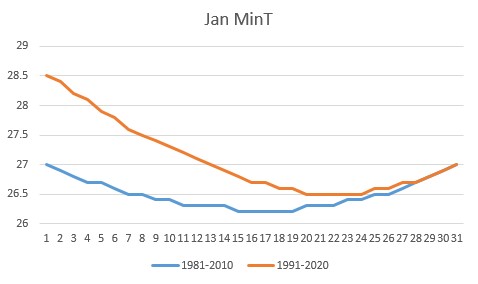
| January | 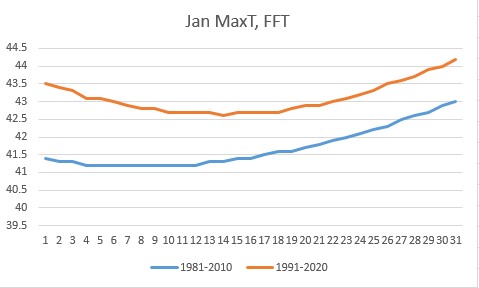 |
 |
 |
| February | 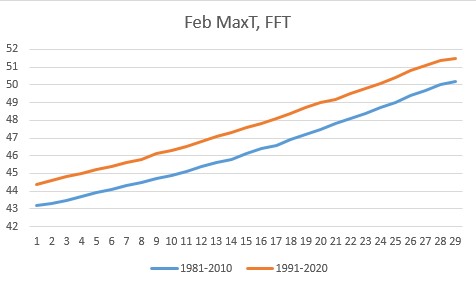 |
 |
 |
| March | 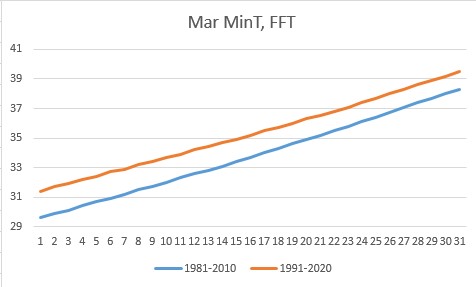 |
|
 |
| April | 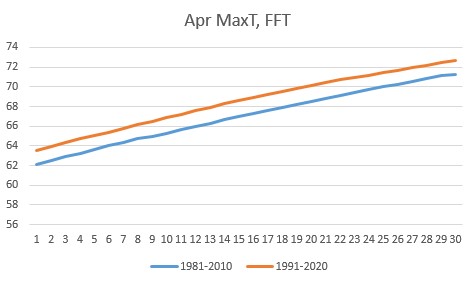 |
 |
 |
| May |  |
 |
 |
| June | 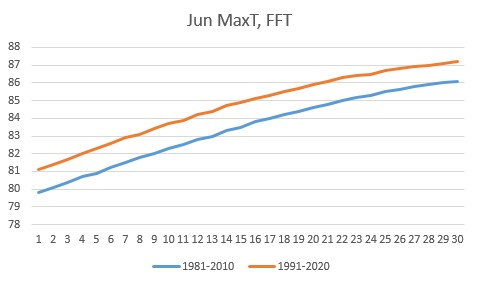 |
 |
 |
| July | 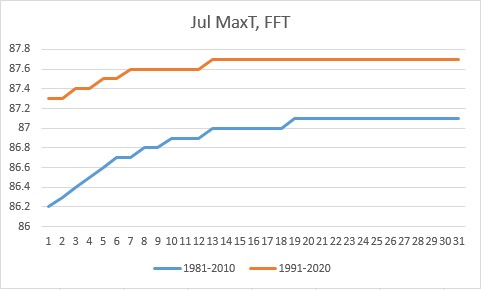 |
 |
 |
| August | 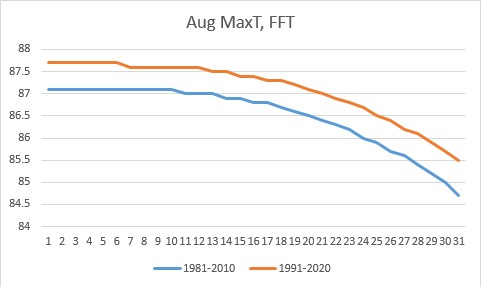 |
 |
 |
| September | 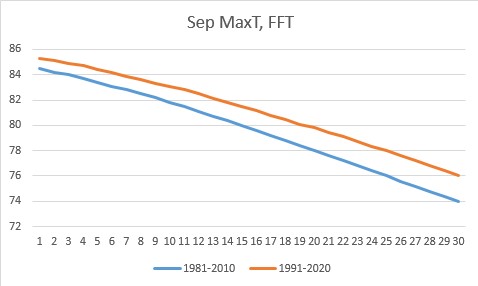 |
 |
 |
| October | 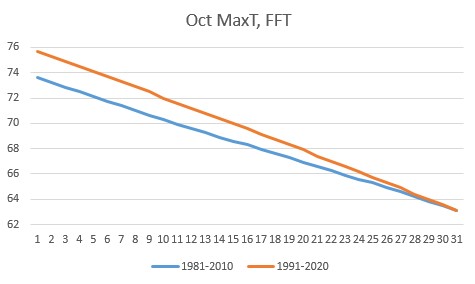 |
 |
 |
| November | 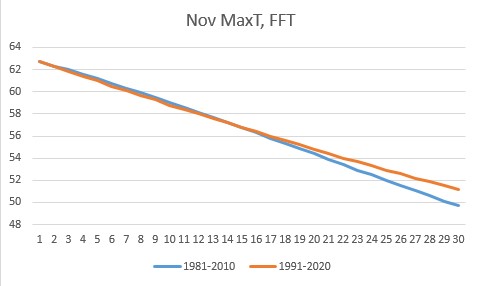 |
 |
 |
| December | 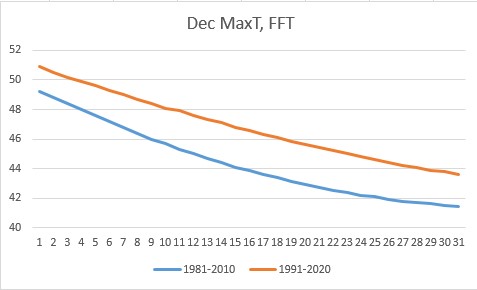 |
 |
 |
| Annual | 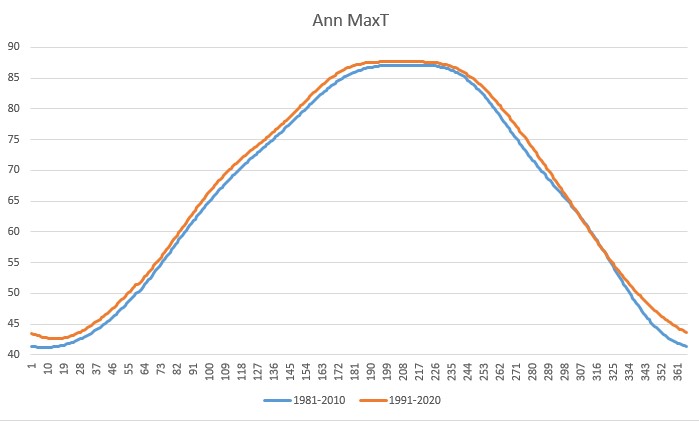 |
 |
 |
Annual Precipitation
| Daily High Temperature | Daily Low Temperature | Daily Average Temperature | |
| January | 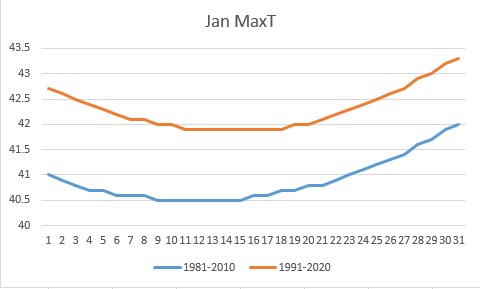 |
 |
 |
| February | 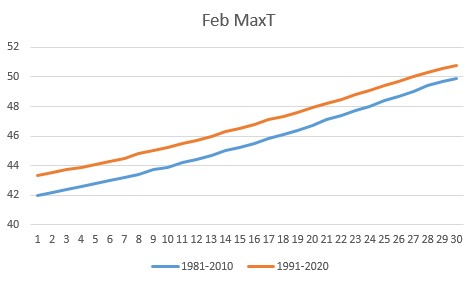 |
 |
 |
| March | 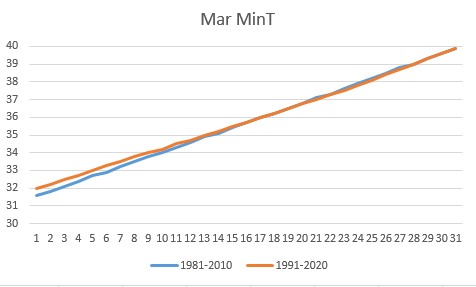 |
|
 |
| April | 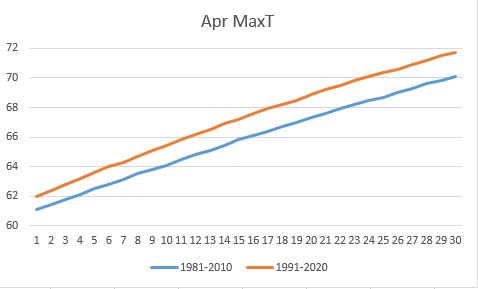 |
 |
 |
| May | 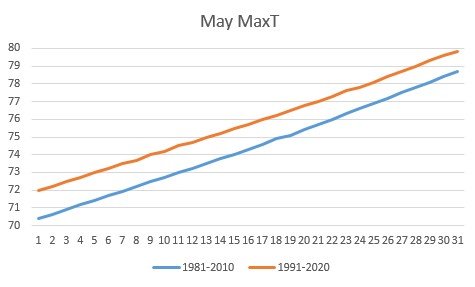 |
 |
 |
| June | 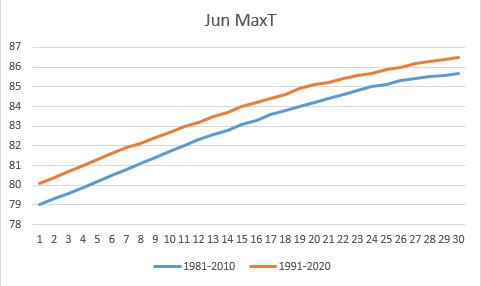 |
 |
 |
| July | 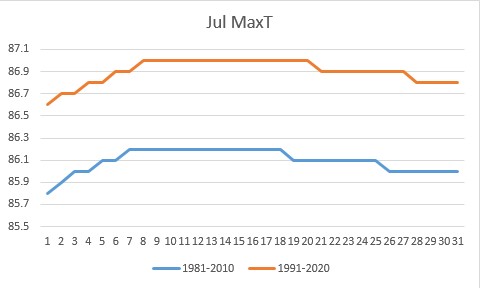 |
 |
 |
| August | 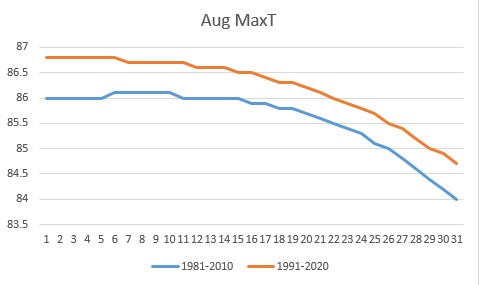 |
 |
 |
| September | 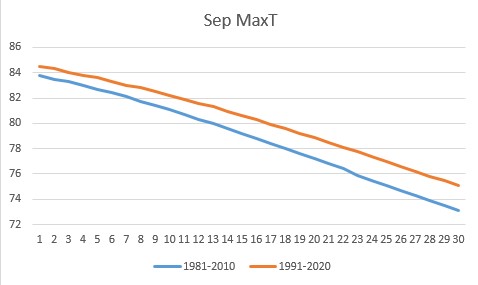 |
 |
 |
| October | 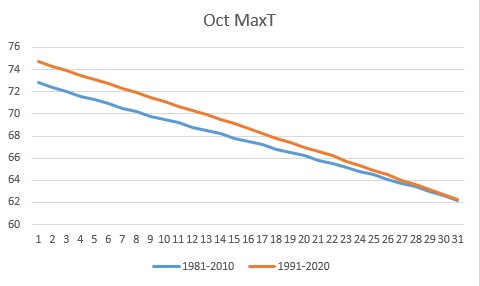 |
 |
 |
| November | 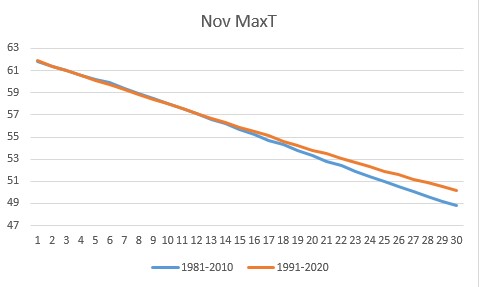 |
 |
 |
| December | 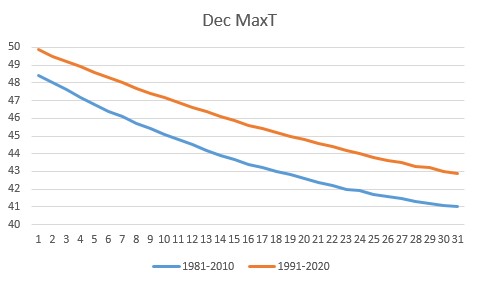 |
 |
 |
| Annual | 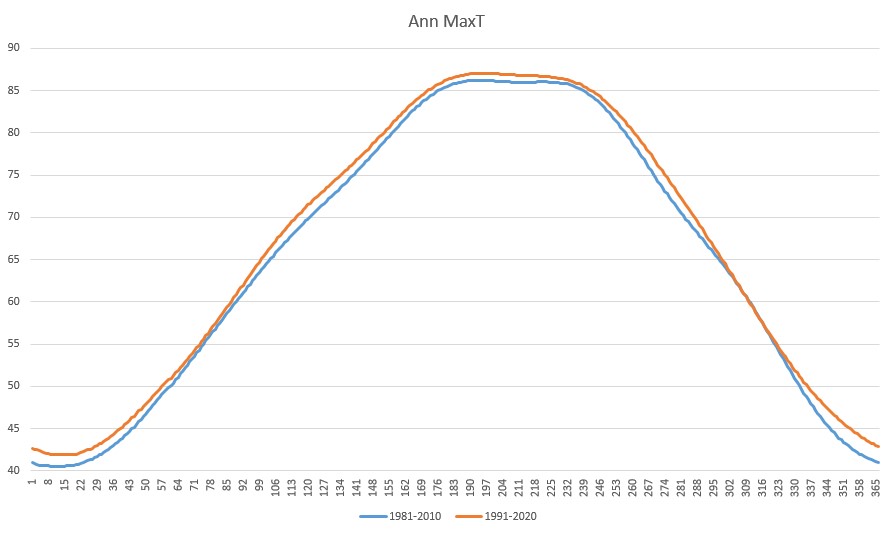 |
 |
 |
Annual Precipitation
| Daily High Temperature | Daily Low Temperature | Daily Average Temperature | |
| January | 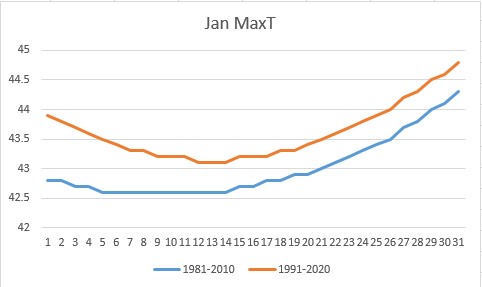 |
 |
 |
| February | 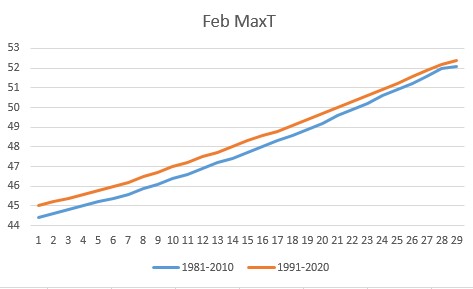 |
 |
 |
| March | 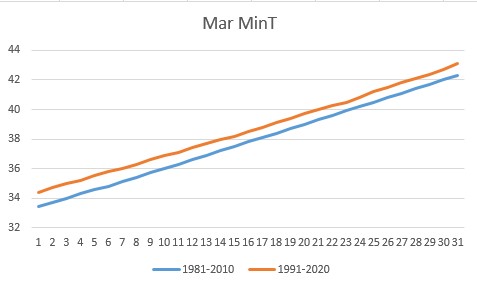 |
|
 |
| April | 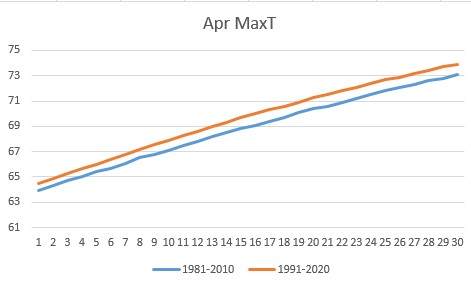 |
 |
 |
| May | 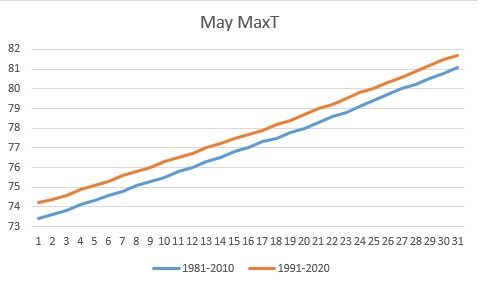 |
 |
 |
| June | 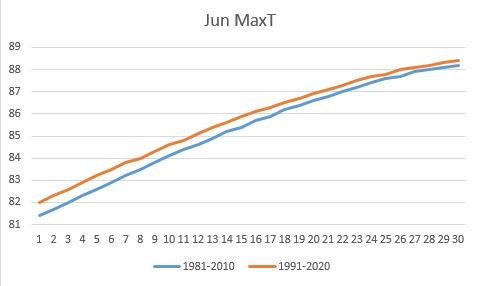 |
 |
 |
| July | 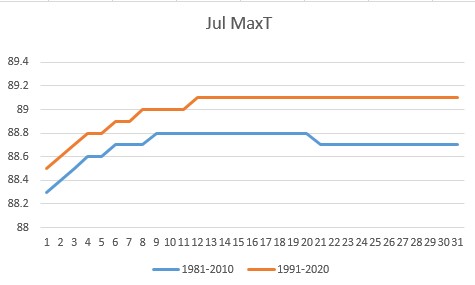 |
 |
 |
| August | 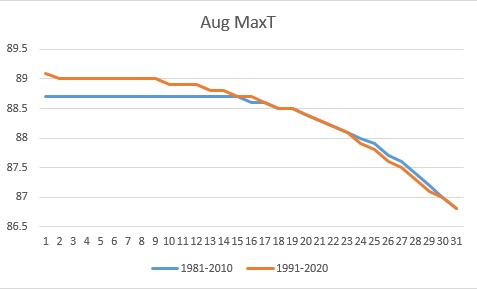 |
 |
 |
| September | 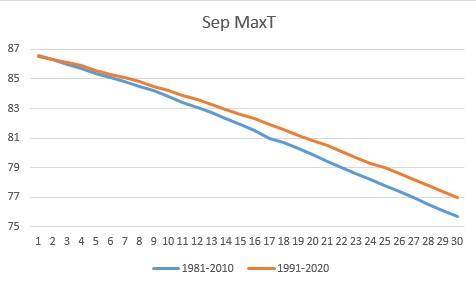 |
 |
 |
| October | 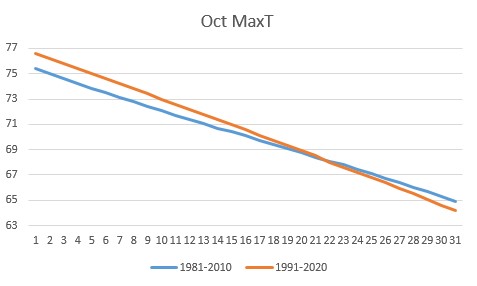 |
 |
 |
| November | 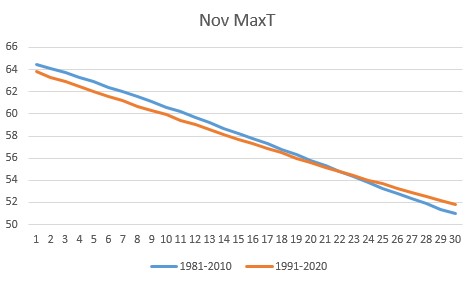 |
 |
 |
| December | 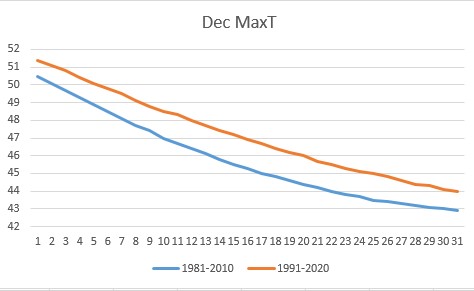 |
 |
 |
| Annual | 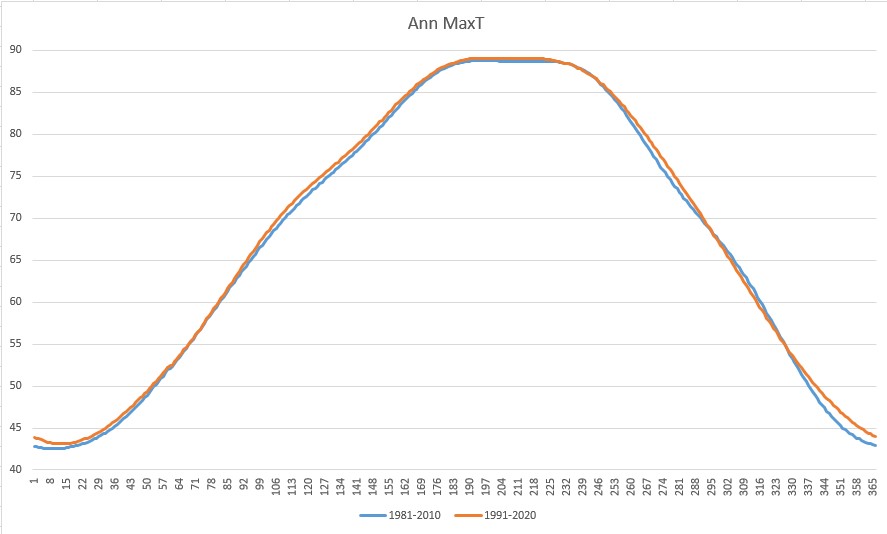 |
 |
 |
Annual Precipitation
| Daily High Temperature | Daily Low Temperature | Daily Average Temperature | |
| January | 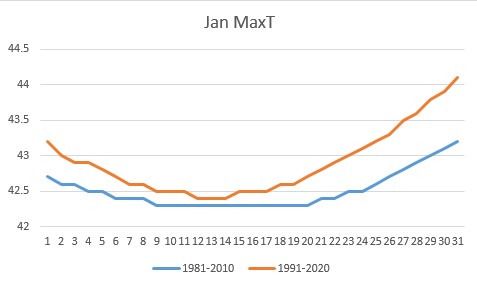 |
 |
 |
| February | 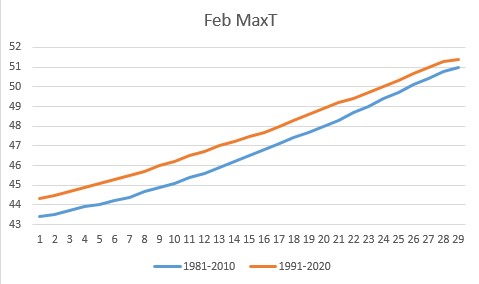 |
 |
 |
| March | 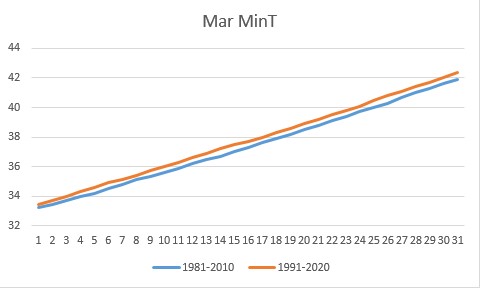 |
|
 |
| April |  |
 |
 |
| May | 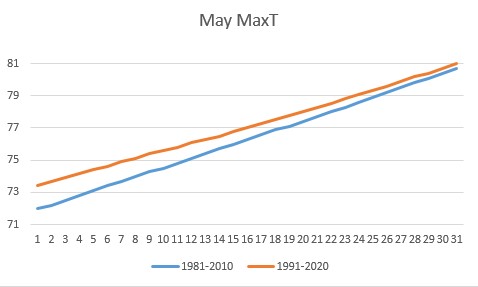 |
 |
 |
| June | 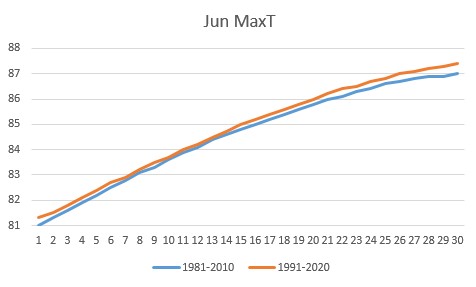 |
 |
 |
| July | 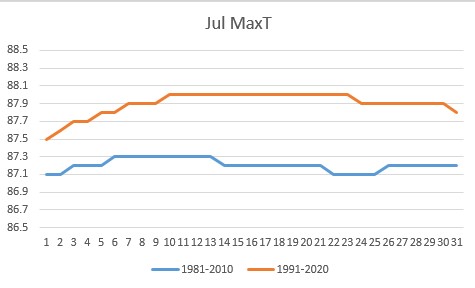 |
 |
 |
| August | 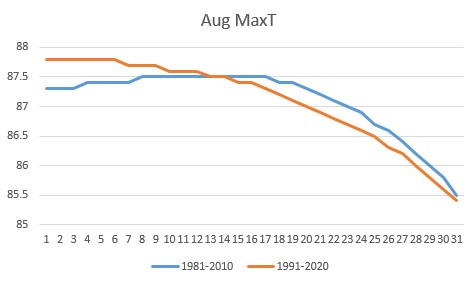 |
 |
 |
| September | 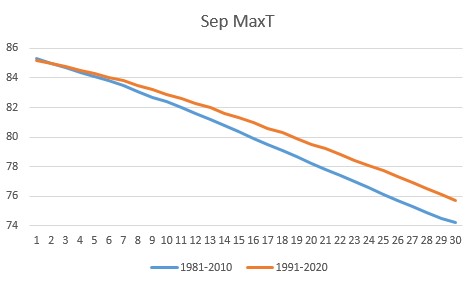 |
 |
 |
| October | 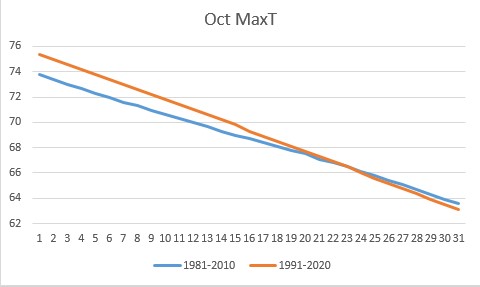 |
 |
 |
| November | 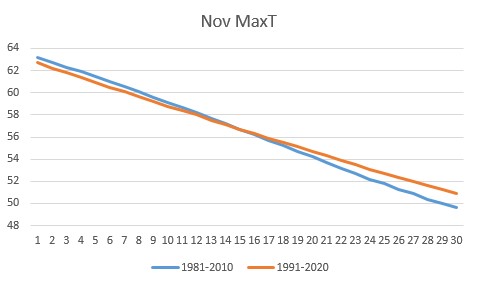 |
 |
 |
| December | 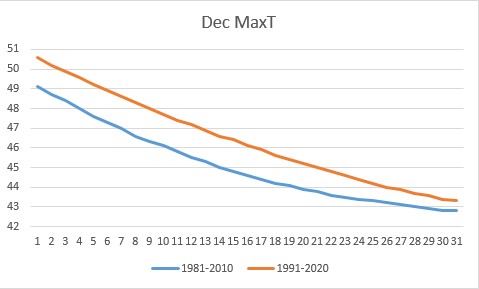 |
 |
 |
| Annual | 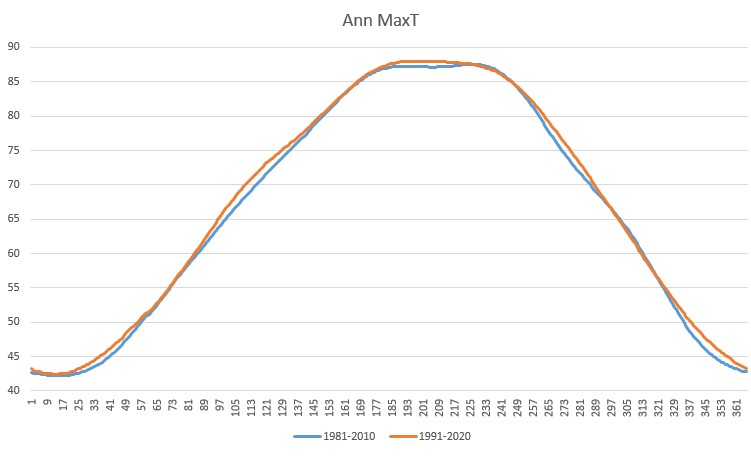 |
 |
 |
Annual Precipitation


 Weather Story
 Weather Map
 Local Radar