Overview
Disclamer: Disregard the tornado ratings below. The F scale was used in this investigation instead of the EF scale.Tornadoes:
|
|
||||||||||
|
||||||||||
|
Disclamer: Disregard the EF ratings in the interactive map. The F scale was used instead of the EF scale. |
||||||||||
Tornadoes:
|
Salvisa Tornado (Northern Track)
Track Map 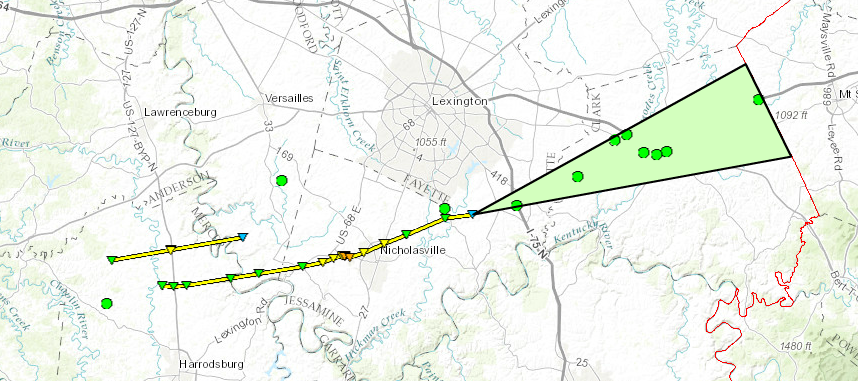 
Downloadable KMZ File |
||||||||||||||||
|
Jessamine Tornado (Southern Track)
Track Map
Downloadable KMZ File |
||||||||||||||||
 |
Media use of NWS Web News Stories is encouraged! Please acknowledge the NWS as the source of any news information accessed from this site. |
|
The Fujita (F) Scale classifies tornadoes into the following categories:
| F0 Gale 40-72 mph |
F1 Weak 73-112 mph |
F2 Strong 113-157 mph |
F3 Severe 158-206 mph |
F4 Devastating 207-260 mph |
F5 Incredible 261+ mph |
 |
|||||
Photos & Video:
Header
 |
 |
 |
 |
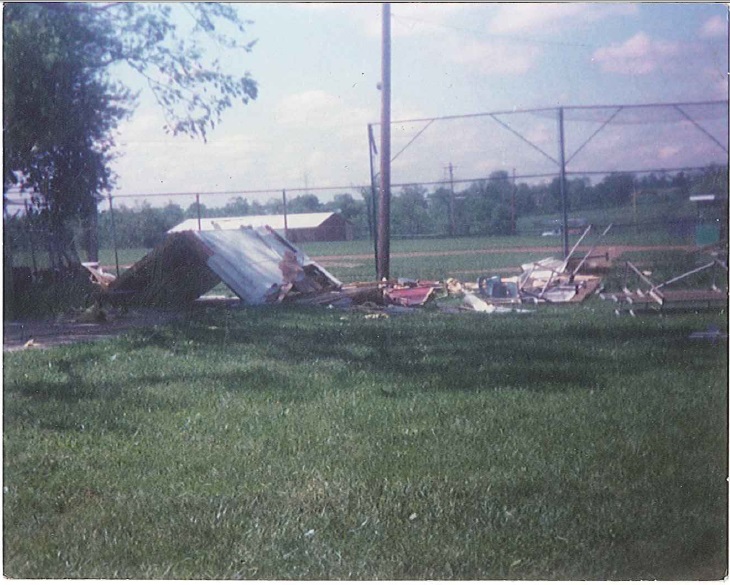
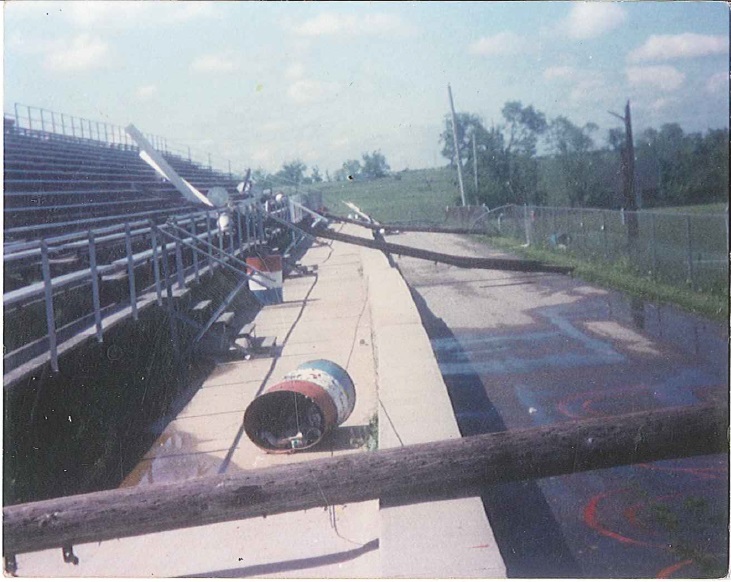
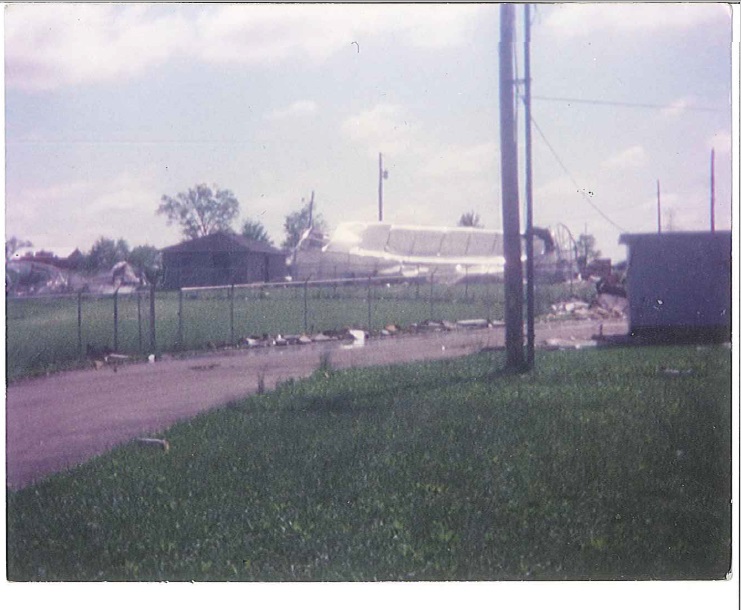
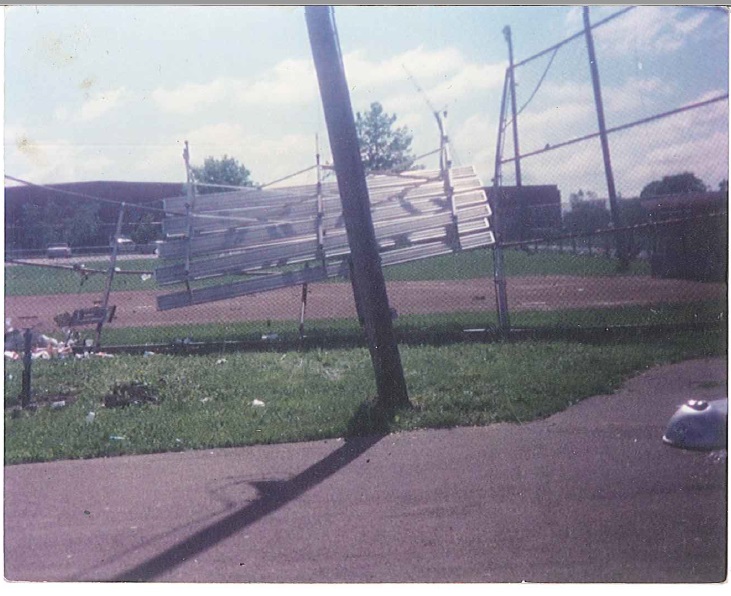
| Damage to bleachers on football field (courtesy of Jessamine Co. EMA) |
Damage to bleachers (courtesy of Jessamine Co. EMA) |
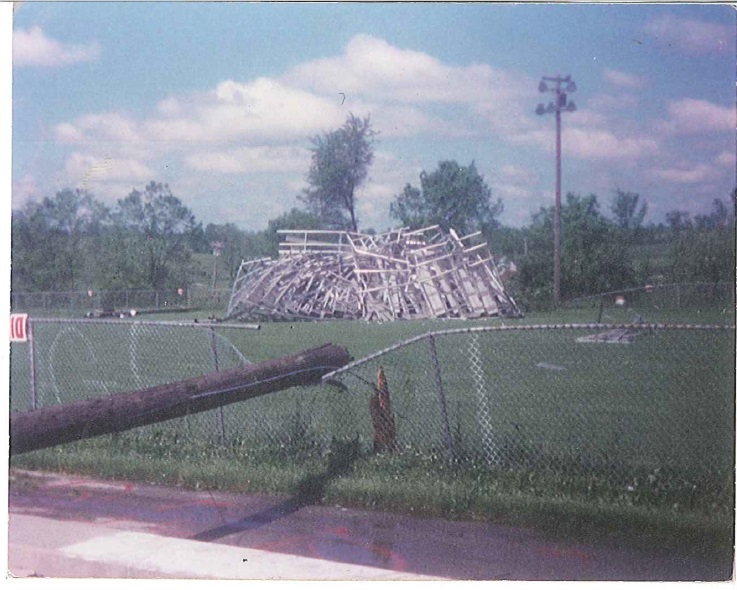
Extensive damage to tobacco barn (courtesy of Jessamine Co. EMA) |
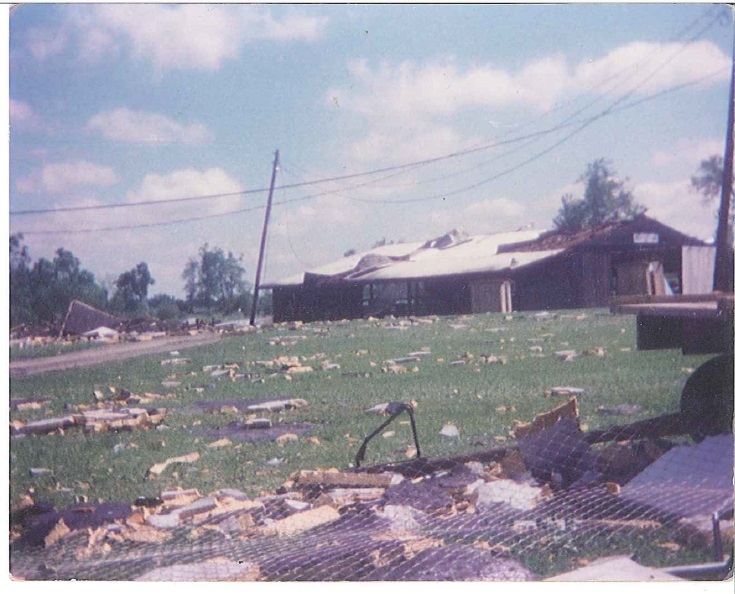
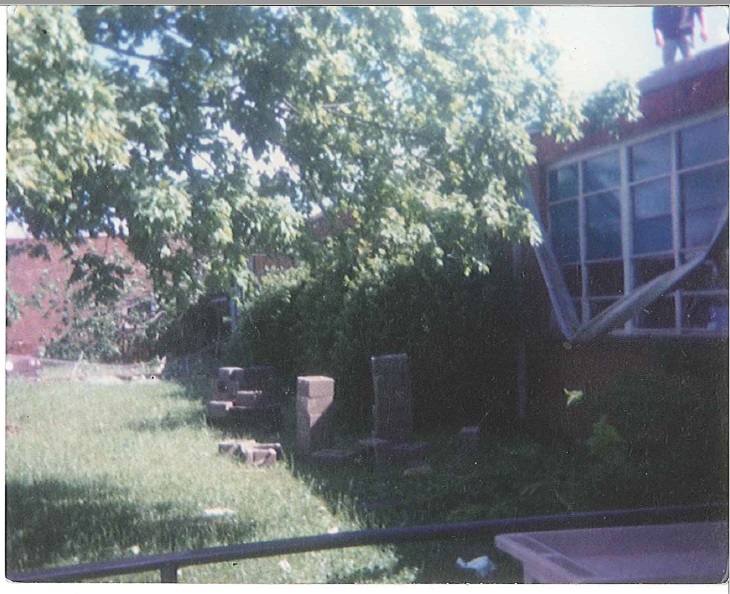
Structural damage to school (courtesy of Jessamine Co. EMA) |
 |
 |
 |
 |
| Damaged bleachers and debri (courtesy of Jessamine Co. EMA) |
Bleachers twisted and thrown (courtesy of Jessamine Co. EMA) |
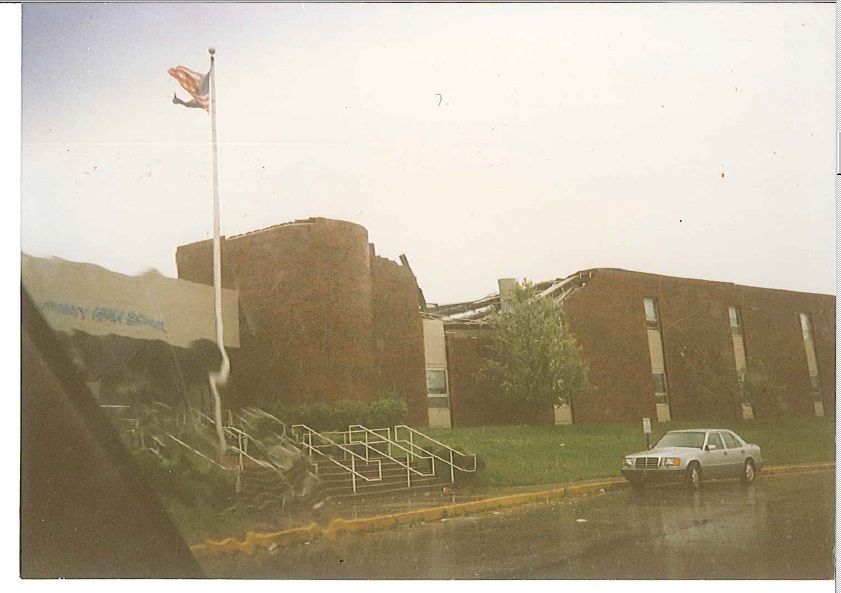
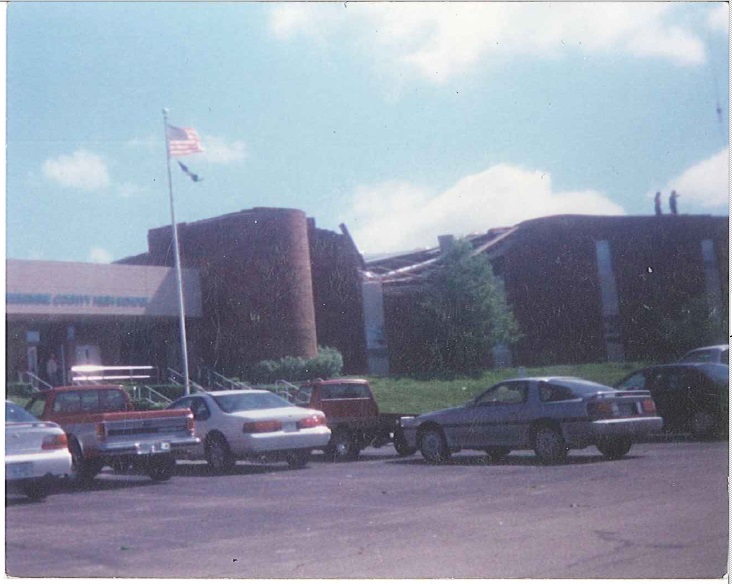
Roof damage at West Jessamine High School (courtesy of Jessamine Co. EMA) |
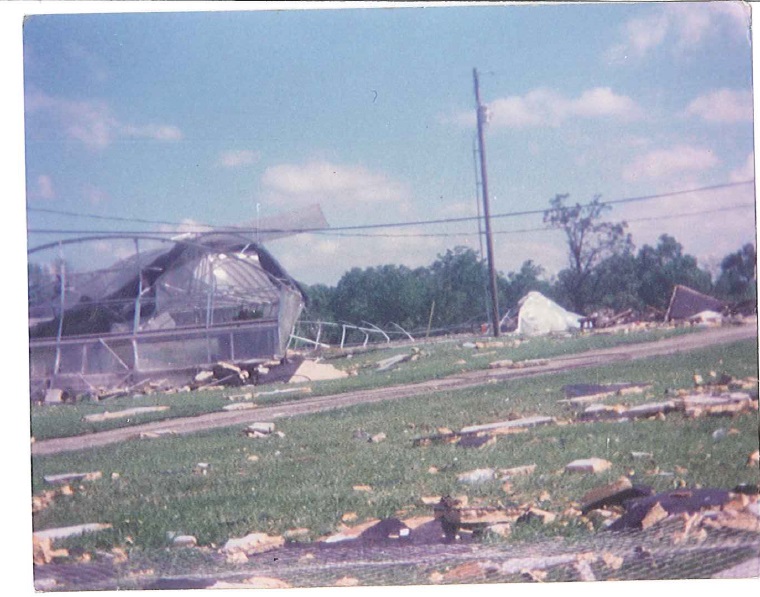
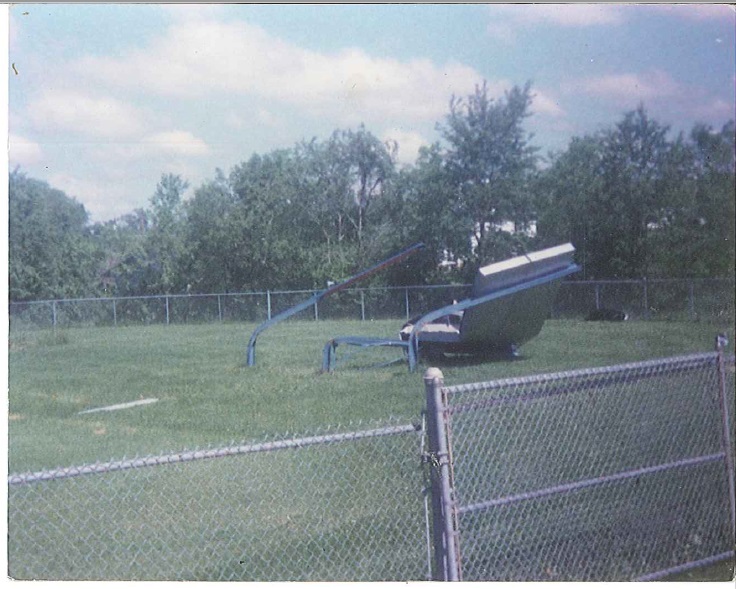
Greenhouse destroyed (courtesy of Jessamine Co. EMA) |
 |
 |
 |
 |
| Roof collapse at high school (courtesy of Jessamine Co. EMA) |
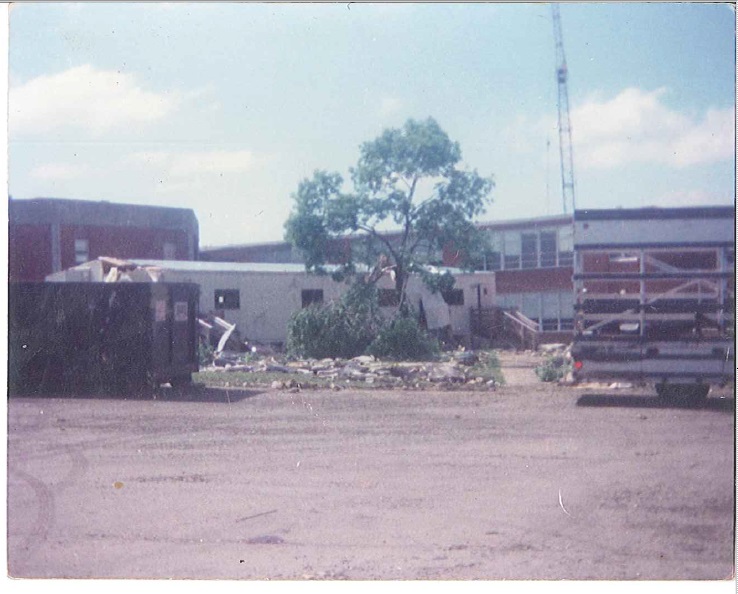
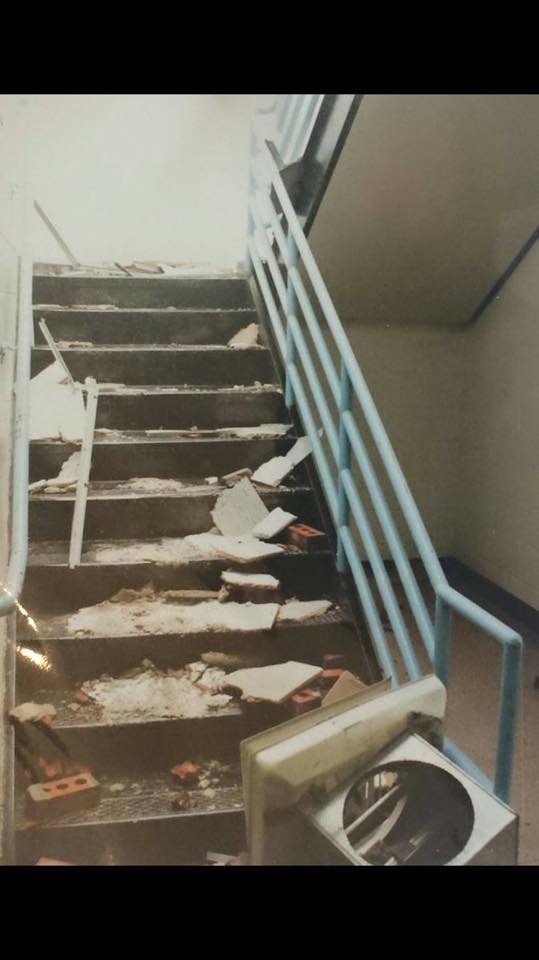
Extensive damage to school (courtesy of Jessamine Co. EMA) |
Damage to school (courtesy of Jessamine Co. EMA) |
More bleachers thrown and twisted (courtesy of Jessamine Co. EMA) |
 |
 |
 |
 |
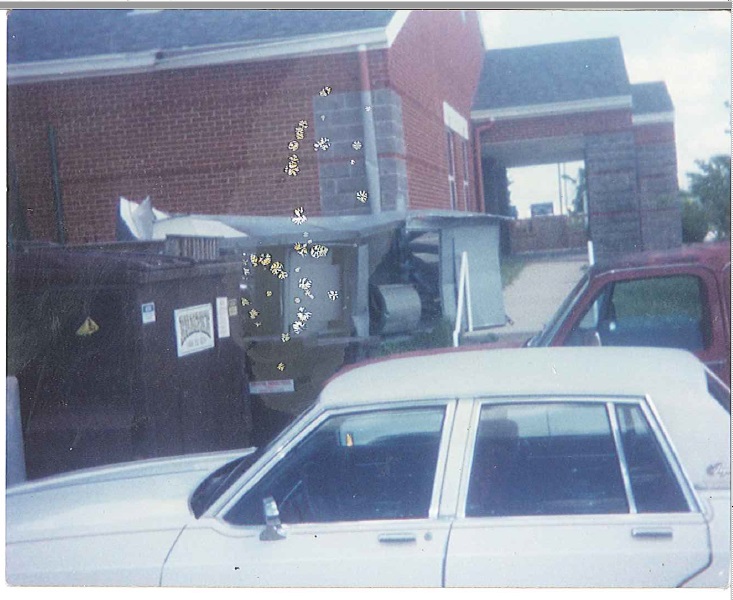
| Metal signs knocked over and twisted (courtesy of Jessamine Co. EMA) |
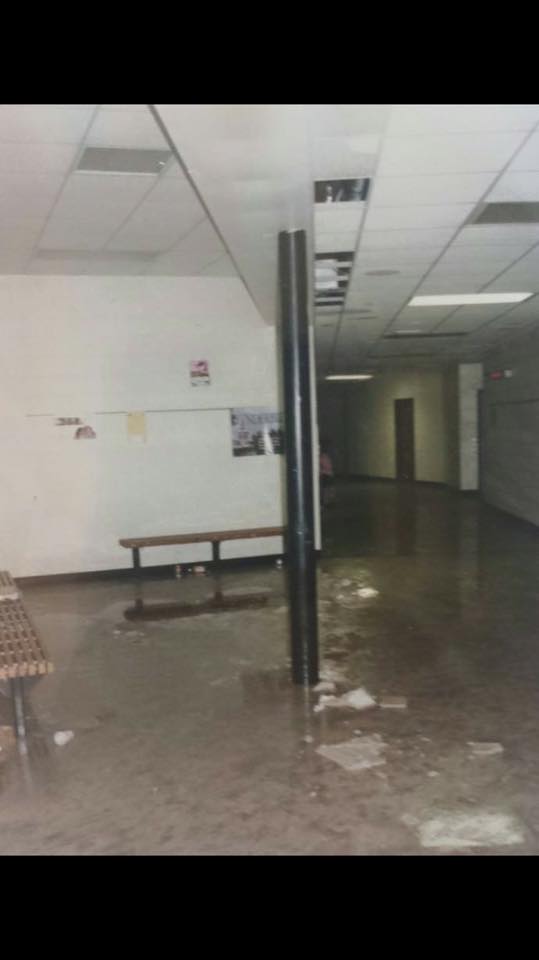
Debri inside the high school (Sherry Reed) |
Debri inside the high school (Sherry Reed) |
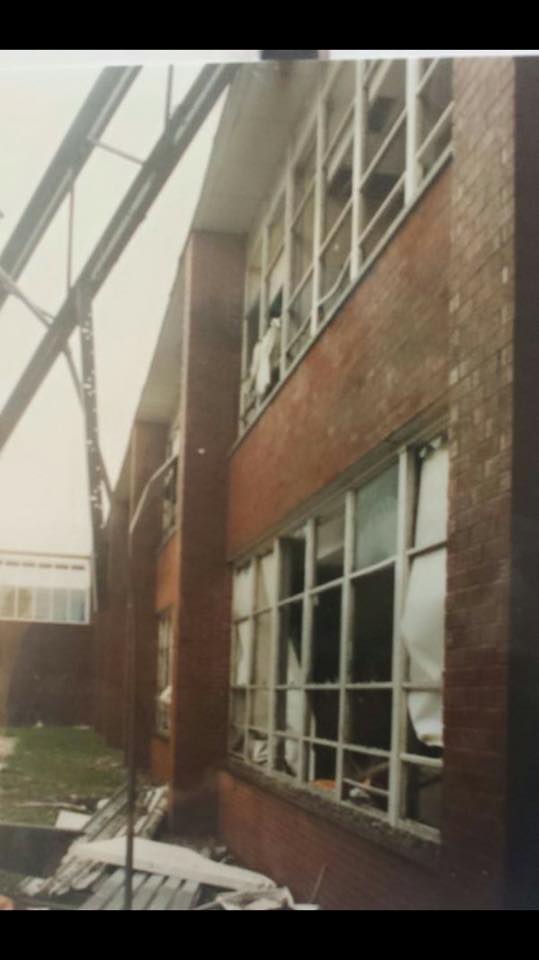
Windows busted out (Sherry Reed) |
 |
|||
| Windows busted out all over the school (Sherry Reed) |
Radar:
Header
 |
 |
|
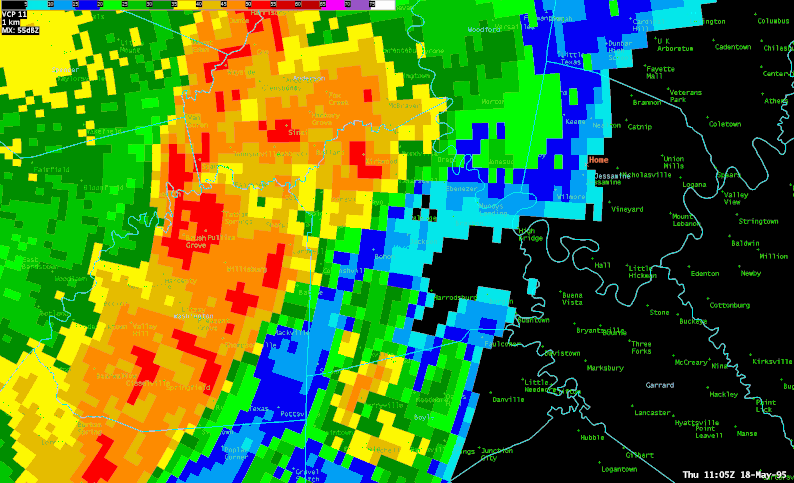
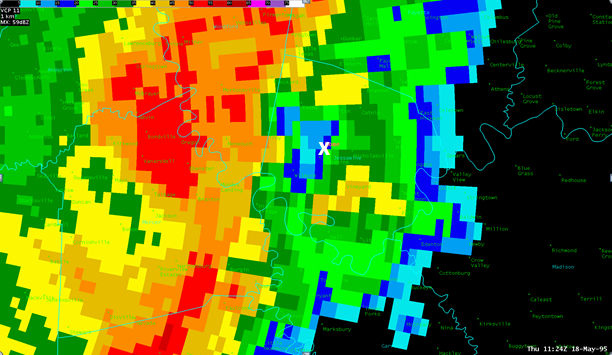
Base Reflectivity Loop |
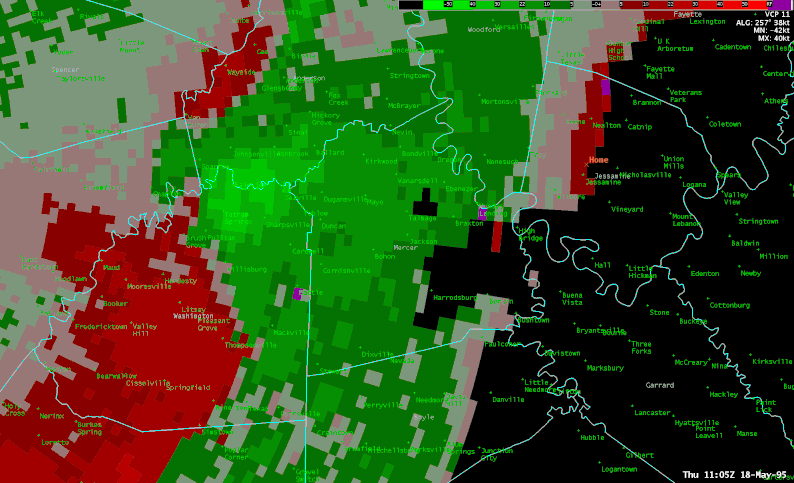
Storm Relative Motion Loop |
 |
 |
|
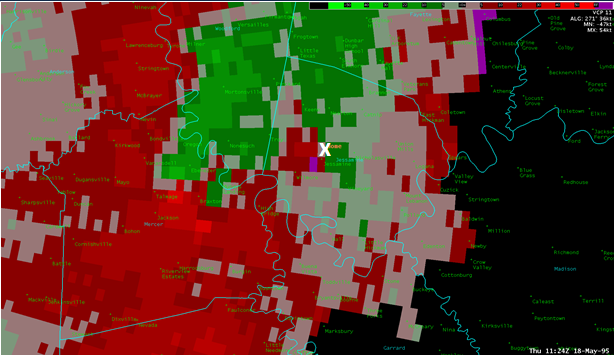
Base Reflectivity Image |
Storm Relative Motion Image |
Storm Reports
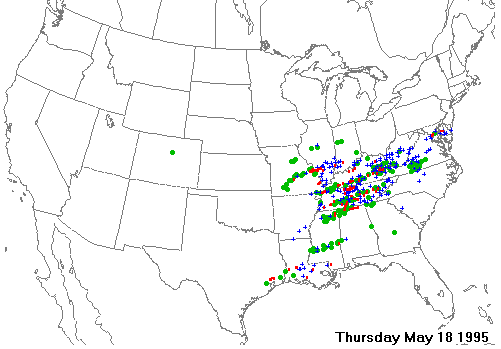
Storm reports from the Storm Prediction Center
Environment
.
 |
|
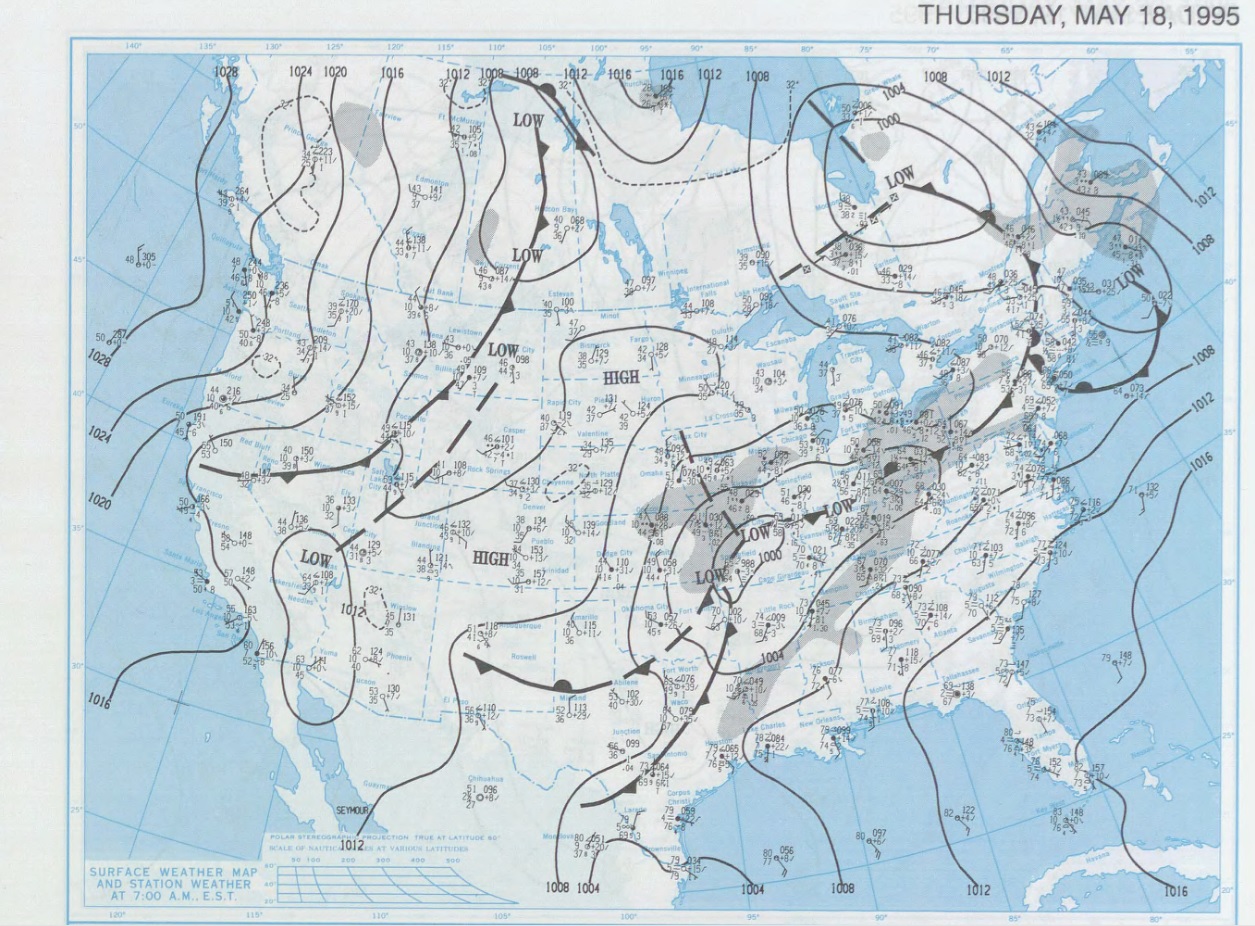
Figure 1: Surface Map from 7am on May 18, 1995. |
 |
|
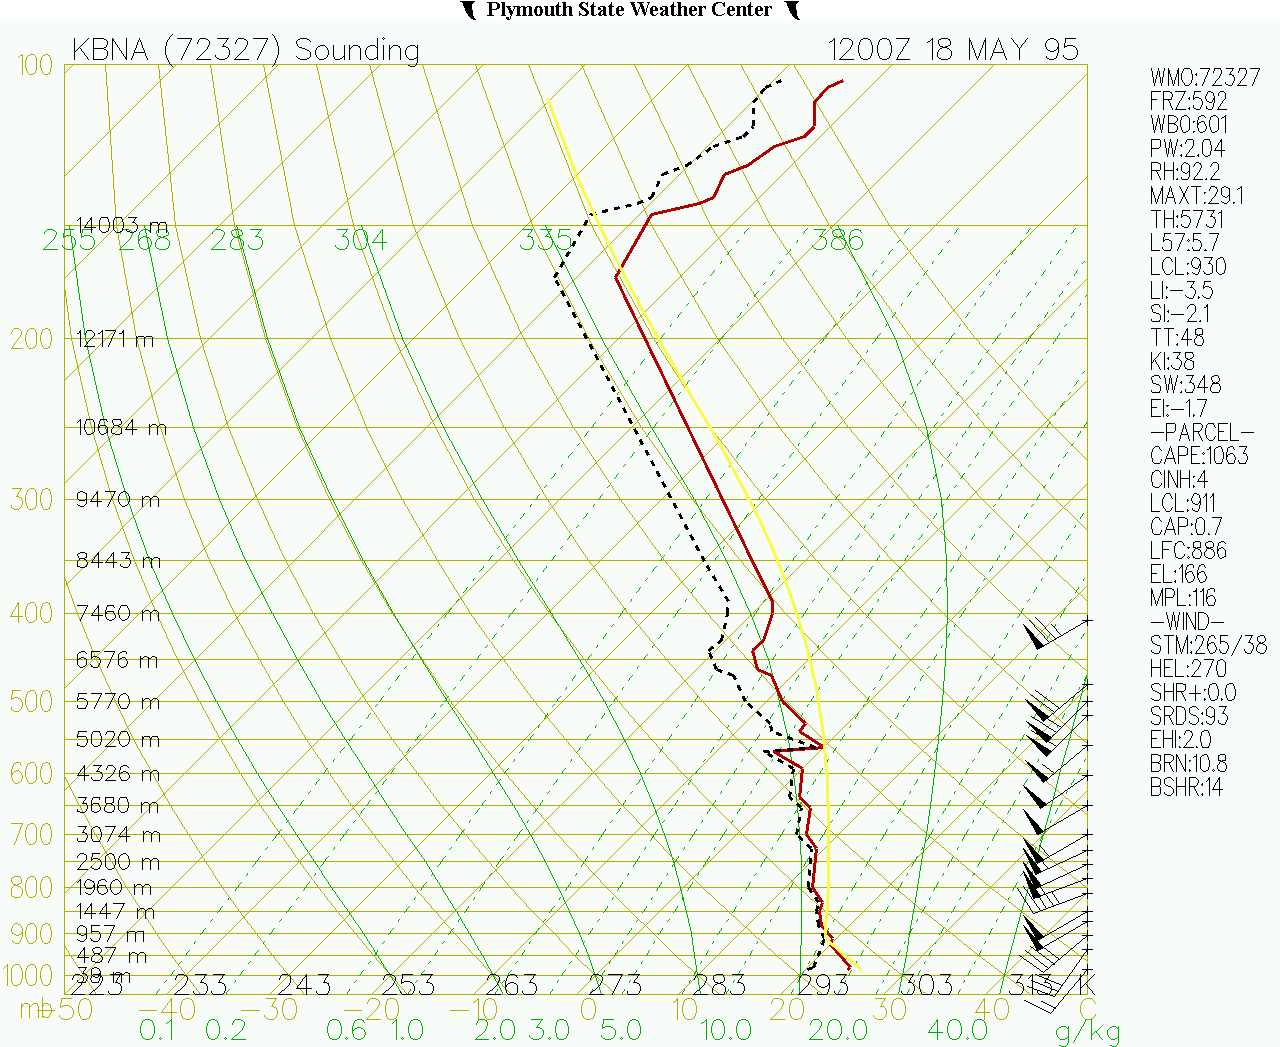
Figure 2: Skew-T from Nashville, TN showing environmental conditions during the morning of May 18, 1995. Moderate instability and moderate to strong low level wind shear was conducive for severe thunderstorm formation.
|
|
Media use of NWS Web News Stories is encouraged! Please acknowledge the NWS as the source of any news information accessed from this site. |
|


 Weather Story
 Weather Map
 Local Radar