 |
|
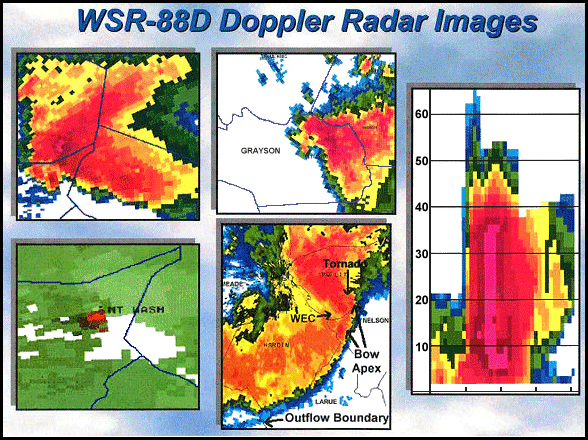
Upper Left: Low-level base reflectivity image of a large supercell thunderstorm that produced a damaging tornado (in the hook echo area) in northeast Bullitt County (just south of Louisville) on May 28, 1996. After this time, the storm and its tornado moved east into Spencer County. Lower Left: Low-level storm-relative velocity image of a mesocyclone (red outbound-green inbound couplet; radar located to the west/left of the area shown) in northeast Bullitt County (just southeast of Louisville) that produced a damaging tornado on May 28, 1996. Note the enhanced storm-relative inflow (area of light green color) in extreme northeast Bullitt and western Spencer Counties, along the forward flank downdraft boundary. This inflow funneled into the hook echo area and increased the strength of the low-level mesocyclone resulting in generation and maintenance of the tornado. This image corresponds to the reflectivity image in the upper left corner. Upper Center: Low-level base reflectivity image of a supercell thunderstorm that produced a damaging tornado (in the hook echo area) in Leitchfield (Grayson County), Kentucky on May 23, 2000. Lower Center: Squall line (quasi-linear convective system; QLCS) and embedded intense bow echo across north-central Kentucky on May 14, 1995. Damaging straight-line winds occurred along the bow apex (labeled), which often is positioned on the leading edge of a weak echo channel (WEC; labeled). The WEC often denotes the location of a channeled axis of higher speed winds called a rear inflow jet (RIJ) that can be responsible for producing wind damage along the leading gust front of the bow echo. Tornadoes can spin-up rapidly along and just north of the bow apex associated with small-scale mesovortices. Such vortices also concentrate a narrow swath of the most intense damage within the overall area of damage along the bow apex. The heaviest rainfall (red and orange colors) often display as an "S" shape or line echo wave pattern in organized, severe bow echoes. |