Louisville, KY
Weather Forecast Office
 |
|
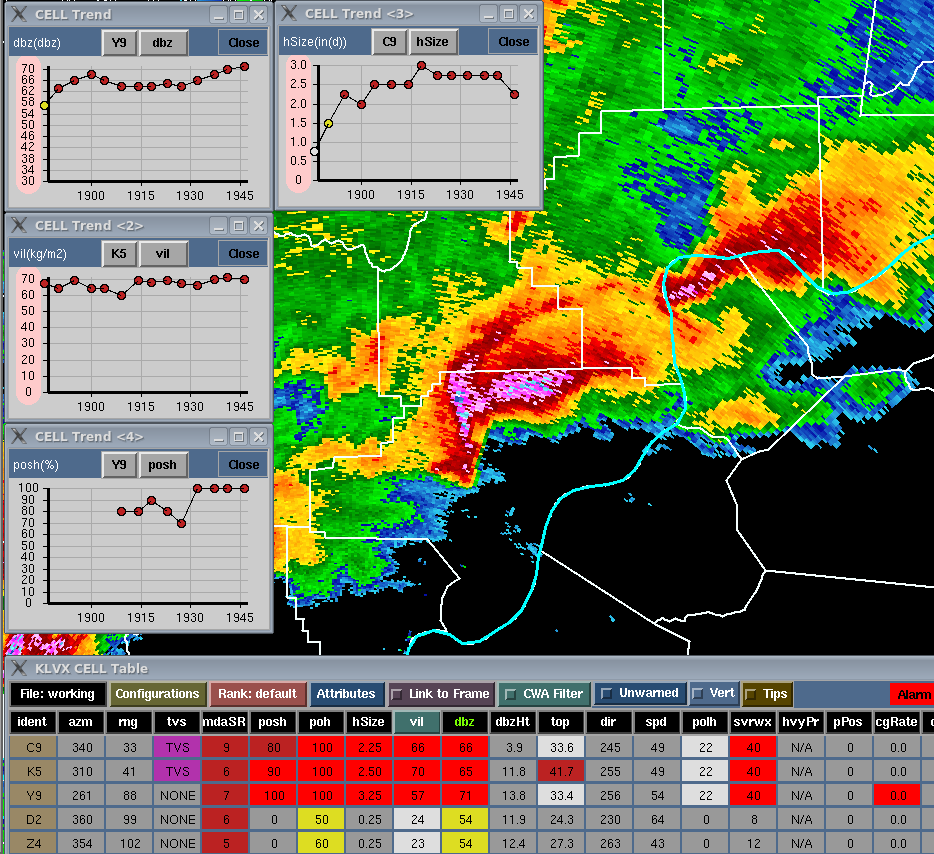
NWS Doppler radar has various software algorithms which derive temporal and spatial trends in thunderstorms and other precipitating entities. Such algorithms help identify trends that may support and provide guidance into severe weather warning decision process. In the image, supercells on March 2, 2012 are shown over Clark County, IN and northern Trimble County, KY. At the bottom is a cell trend table with statistics on a number of storms across central Kentucky and southern Indiana. Statistics are color coded depending on values and thresholds. Clicking on any statistic pops up a trend graph for a selected storm. Shown are graphs for 1) reflectivity values (upper left) where values increase to 70 dBZ (very high), 2) digital VIL (middle left) where values are high around 70, 3) probability of severe hail (POSH; lower left) where values increase to 100 pct, and 4) maximum estimated hail size (middle top) where values are around 2.5 inches (which can be a slight overestimate). Similar graphs are available for other storm elements. |
Current Hazards
Hazardous Weather Outlook
Storm Prediction Center
Submit a Storm Report
Advisory/Warning Criteria
Radar
Fort Knox
Evansville
Fort Campbell
Nashville
Jackson
Wilmington
Latest Forecasts
El Nino and La Nina
Climate Prediction
Central U.S. Weather Stories
1-Stop Winter Forecast
Aviation
IDSS Forecast Points
Air Quality
Fire Weather
Recreation Forecasts
1-Stop Drought
Event Ready
1-Stop Severe Forecast
Past Weather
Climate Graphs
1-Stop Climate
CoCoRaHS
Local Climate Pages
Tornado History
Past Derby/Oaks/Thunder Weather
Football Weather
Local Information
About the NWS
Forecast Discussion
Items of Interest
Spotter Training
Regional Weather Map
Decision Support Page
Text Products
Science and Technology
Outreach
LMK Warning Area
About Our Office
Station History
Hazardous Weather Outlook
Local Climate Page
Tornado Machine Plans
Weather Enterprise Resources
US Dept of Commerce
National Oceanic and Atmospheric Administration
National Weather Service
Louisville, KY
6201 Theiler Lane
Louisville, KY 40229-1476
502-969-8842
Comments? Questions? Please Contact Us.


 Weather Story
 Weather Map
 Local Radar