Louisville, KY
Weather Forecast Office
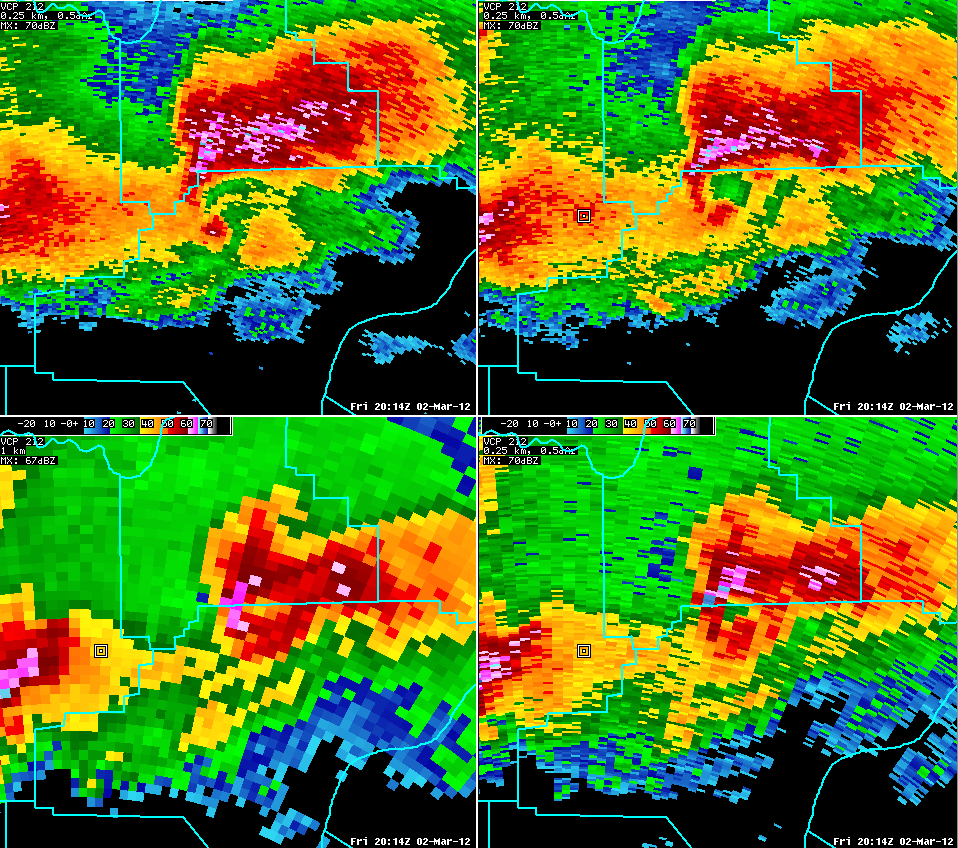 |
A 4-panel of base reflectivity data at 4 different elevation angles from the KLVX WSR-88D Doppler Radar. Reflectivity shows where and how hard it is raining or snowing, as well as precipitation intensity trends and movement. Blue and green colors represent light-to-moderate rainfall. Yellow and orange colors show moderate-to-heavy precipitation, while red is very heavy rainfall and pink colors inside the red color represent hail of different sizes. At left is a close-up of a devastating supercell thunderstorm over south-central Indiana on March 2, 2012. The storm produced an EF-4 tornado in parts of Washington and Clark counties. In the upper left panel, a classic supercell is shown at 0.5 degree elevation, with very heavy rain and hail in the storm's core, and a hook echo and "debris ball" on the southwest side of the storm in northwest Clark County. A tornado was on the ground at this time. Higher up in the storm, a "bounded weak echo region" (BWER), or small area of lower reflectivity values inside (surrounded by) an area of higher reflectivity is shown in the bottom 2 panels. This represents the location of the rotating updraft, i.e., mesocyclone in the supercell. Four-panel displays help meteorologists analyze the vertical structure of thunderstorms. |
Current Hazards
Hazardous Weather Outlook
Storm Prediction Center
Submit a Storm Report
Advisory/Warning Criteria
Radar
Fort Knox
Evansville
Fort Campbell
Nashville
Jackson
Wilmington
Latest Forecasts
El Nino and La Nina
Climate Prediction
Central U.S. Weather Stories
1-Stop Winter Forecast
Aviation
IDSS Forecast Points
Air Quality
Fire Weather
Recreation Forecasts
1-Stop Drought
Event Ready
1-Stop Severe Forecast
Past Weather
Climate Graphs
1-Stop Climate
CoCoRaHS
Local Climate Pages
Tornado History
Past Derby/Oaks/Thunder Weather
Football Weather
Local Information
About the NWS
Forecast Discussion
Items of Interest
Spotter Training
Regional Weather Map
Decision Support Page
Text Products
Science and Technology
Outreach
LMK Warning Area
About Our Office
Station History
Hazardous Weather Outlook
Local Climate Page
Tornado Machine Plans
Weather Enterprise Resources
US Dept of Commerce
National Oceanic and Atmospheric Administration
National Weather Service
Louisville, KY
6201 Theiler Lane
Louisville, KY 40229-1476
502-969-8842
Comments? Questions? Please Contact Us.


 Weather Story
 Weather Map
 Local Radar