Louisville, KY
Weather Forecast Office
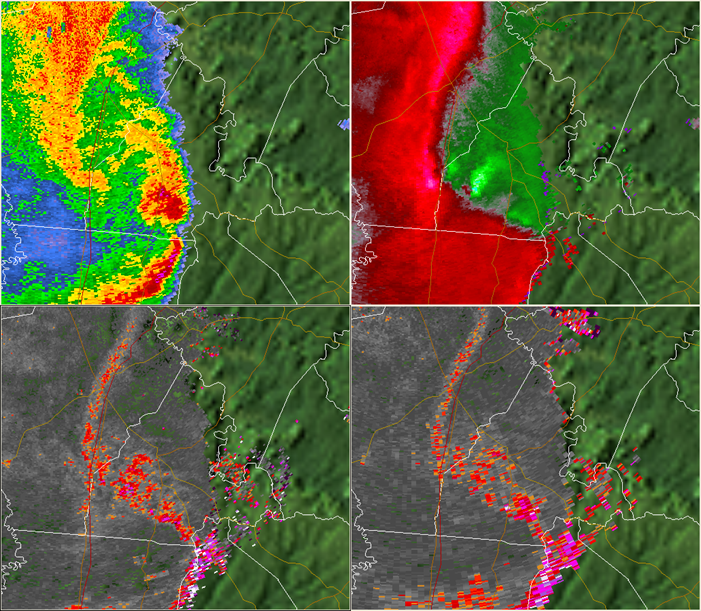 |
The image shows a 4-panel display of reflectivity (upper left), storm-relative velocity (upper right), and spectrum width data (bottom 2 panels) from the NWS Louisville radar on April 24, 2010. Spectrum width (SW) depicts a measure of the variability of the radial velocity estimates due to the presence of wind shear, turbulence, and/or the quality of velocity samples. It is used to estimate turbulence associated with boundaries, thunderstorms, mesocyclones in supercells, mesovortices in convective lines, etc. Low values (gray shades at left) indicate smooth or uniform flow, while high values (red, pink, and white colors) denote turbulent or variable flow. In this case, a bow echo was moving east over central Kentucky. Velocity (upper right) showed a low-level boundary (red-green interface) with mesovortices (red-green couplets) over southwest Larue County (center of image). Spectrum width clearly identified the boundary location ("S" shaped line), while the mesovortices showed up as small clusters of high SW values (especially lower left panel). SW is another tool available to NWS forecasters to enhance the severe weather warning decision process. |
Current Hazards
Hazardous Weather Outlook
Storm Prediction Center
Submit a Storm Report
Advisory/Warning Criteria
Radar
Fort Knox
Evansville
Fort Campbell
Nashville
Jackson
Wilmington
Latest Forecasts
El Nino and La Nina
Climate Prediction
Central U.S. Weather Stories
1-Stop Winter Forecast
Aviation
IDSS Forecast Points
Air Quality
Fire Weather
Recreation Forecasts
1-Stop Drought
Event Ready
1-Stop Severe Forecast
Past Weather
Climate Graphs
1-Stop Climate
CoCoRaHS
Local Climate Pages
Tornado History
Past Derby/Oaks/Thunder Weather
Football Weather
Local Information
About the NWS
Forecast Discussion
Items of Interest
Spotter Training
Regional Weather Map
Decision Support Page
Text Products
Science and Technology
Outreach
LMK Warning Area
About Our Office
Station History
Hazardous Weather Outlook
Local Climate Page
Tornado Machine Plans
Weather Enterprise Resources
US Dept of Commerce
National Oceanic and Atmospheric Administration
National Weather Service
Louisville, KY
6201 Theiler Lane
Louisville, KY 40229-1476
502-969-8842
Comments? Questions? Please Contact Us.


 Weather Story
 Weather Map
 Local Radar