Louisville, KY
Weather Forecast Office
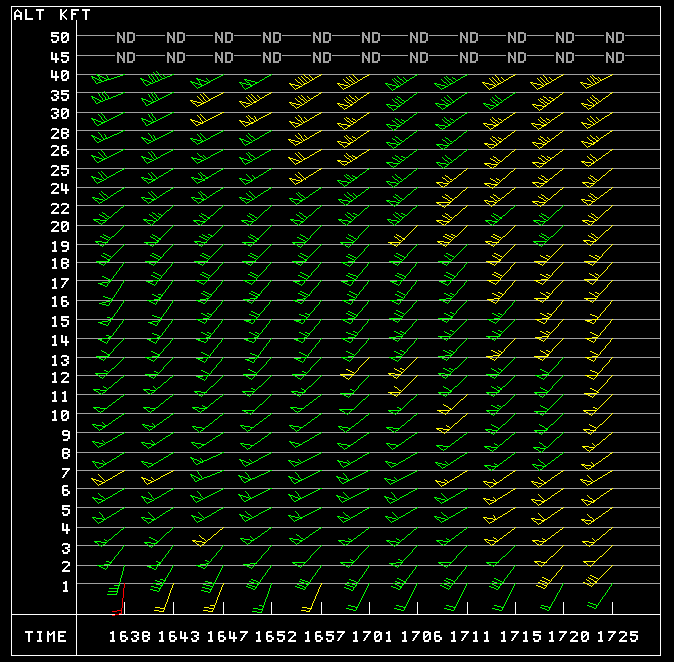 |
A NWS Doppler radar software algorithm calculates wind direction and speed at various atmospheric levels based on cloud and precipitation movement. The resulting product is called the Velocity Azimuth Display (VAD) Wind Profile (VWP), as shown at left. The x-axis is time in UTC (e.g., 1638 UTC is 1238 PM EDT); the y-axis is thousands of feet altitude (e.g., 5 is 5000 ft). Green color indicates the least potential error in estimated winds. VWP provides an estimate of the vertical wind profile at the radar site. Vertical wind shear (change in wind speed and/or direction with height) is crucial to potential thunderstorm organization and severity. The greater the shear, the greater the potential for organized severe weather, assuming storm development. In this image, winds show excellent low-level (surface to 5000 ft) speed and directional shear at 1638 UTC, with slowly increasing winds aloft to 40,000 ft. By 1725 UTC, low level winds had "veered" from south to southwest, while winds continued to increase slowly aloft. The VWP indicates very good winds and wind shear. |
Current Hazards
Hazardous Weather Outlook
Storm Prediction Center
Submit a Storm Report
Advisory/Warning Criteria
Radar
Fort Knox
Evansville
Fort Campbell
Nashville
Jackson
Wilmington
Latest Forecasts
El Nino and La Nina
Climate Prediction
Central U.S. Weather Stories
1-Stop Winter Forecast
Aviation
IDSS Forecast Points
Air Quality
Fire Weather
Recreation Forecasts
1-Stop Drought
Event Ready
1-Stop Severe Forecast
Past Weather
Climate Graphs
1-Stop Climate
CoCoRaHS
Local Climate Pages
Tornado History
Past Derby/Oaks/Thunder Weather
Football Weather
Local Information
About the NWS
Forecast Discussion
Items of Interest
Spotter Training
Regional Weather Map
Decision Support Page
Text Products
Science and Technology
Outreach
LMK Warning Area
About Our Office
Station History
Hazardous Weather Outlook
Local Climate Page
Tornado Machine Plans
Weather Enterprise Resources
US Dept of Commerce
National Oceanic and Atmospheric Administration
National Weather Service
Louisville, KY
6201 Theiler Lane
Louisville, KY 40229-1476
502-969-8842
Comments? Questions? Please Contact Us.


 Weather Story
 Weather Map
 Local Radar