|
Mid-Altitude Radial Convergence (MARC) Velocity Signature (Preliminary Findings) (Updated January 2009) Under construction Gary Schmocker and Ron Przybylinski (WFO St. Louis) |
||||||||
|
Introduction Our initial thoughts in tackling this problem keyed upon studies associated with the isolated pulse microbursts storms. Eilts et al. (1996) from the National Severe Storms Laboratory examined Doppler data from 85 microburst / downburst cases across Oklahoma. They discovered that one of the three most important precursors in forecasting damaging winds included strong and deep radial convergence at the storm's mid-altitudes (11 - 14 km). We fully understood that the dynamics between a pulse 'isolated' storm and a linear convective line segment comprised of a collection of storms which are radically different. However, we wanted to observe how effective this radial velocity signature might be with a linear convective line. Thus, we tested the first time along with Vertical Integrated Liquid (VIL) on the June 8, 1994 linear MCS which produced damaging winds over parts of the St. Louis metro area and adjacent counties. After this initial case, we surveyed the MARC raidal velocity signature on 14 other linear MCSs which evolved across the Mid-Mississippi Valley Region during the period from 1992 through 2004. We initially surveyed the reflectivity and storm-relative velocity fields of each MCS which did or did not produce damaging wind swaths. Archived level 2 data data was used in the study starting with the 2 July 1992 derecho which formed over parts of northeast Missouri and moved through east-central sections of the state into south-central Illinois. In each of these events, the linear convective line eventually evolved into bowing segment or larger bow echo. Swaths of damaging winds occurred with 12 of the 16 events. The overall length of the linear MCSs ranged from 30 to as long as 120 km. We discovered that a 25 m s-1 velocity difference along three to five (maybe six) radials between the area of oubound to inbound velocities was an initial signal or starting point for damaging winds to occur. When calculating MARC you add the magnitude of the maximum outbound value and the maximuim inbound value. In some of the cases, pockets or small areas of MARC have magnitudes > 40 m s-1 differences were embedded within the larger ribbon of the MARC velocity signature which may extend 80 to 140 km in length. Preliminary results suggest that enhanced wind damage is possible under a local area of enhanced radial convergence (SRM velocity differential of 35 to 40 m s-1) within the larger ribbon of MARC. |
||||||||
|
|
||||||||
|
|
||||||||
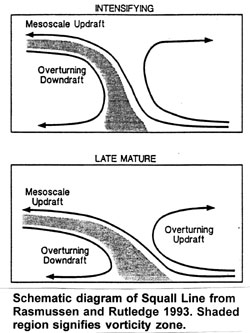
Strong convective cells forming along the leading edge of the line segment will often enhance the transport of higher theta-e air into the mid and upper levels of the MCS. The rearward transport of higher theta-e air will in turn enhance horizontal vorticity and further strengthen the mesoscale Rear Inflow Jet. The mesoscale RIJ often forms near the rear of the stronger mature convective towers and develops rearward with time. Thus during the "Intensifying Stage" we often observe tall erect convective towers suggesting a balance between the system's cold pool and the environmental shear (Weisman 1993). The 'close-coupling' of the inbound and outbound velocity maximums reflects where 'radial convergence is strongest' and signifies the strength of the mid-level, hydrostatic Le'mone Low' in that part of the linear convective MCS. These enhanced velocity differentials or areas of strong radial convergence are usually located in or just downwind from the high reflectivity cores embedded within the linear convective line segment. |
||||||||
|
The information below is based on 15 QLCSs and bow echo events during the warm season (May - September). There were 8 afternoon - early evening cases, 5 late night-early moning events and 2 mid morning cases.
1) Horizontal extent of the MARC velocity signature varied from 30 to as large as 120 km in length. Local enhanced velocity maximums were embedded within the sheet of inbound (outbound) velocities. We continue to investigate the relationship between these enhanced velocity maximums and the degree of surface damage. These local velocity maximums are often co-located with a high-rellectivity core immediately to the west (up-shear flank). 3) Width of the zone of radial convergence varied from 2 to 6 km. Be alert for strong velocity gradients between the inbound and outbound velocities. Aliased velocities may be mistaken for the magnitudes of Inbound and Outbound Velocities. 4) Once radial velocity differences within 6 km along one or several radials reach 25 m s-1 or greater, the potential for severe straight-line winds increases..Actual magnitudes of convergence is 2.54 x 10⁻² ro 5.6 x10⁻³. Average lead time from the initial identification of this magnitude (25 m s-1) to the first reports of severe wind damage was 20 minutes. In a few cases, the lead time was 25 - 30 minutes. 6) The viewing angle is extremely important when viewing the MARC velocity signature. The convective line must be nearly perpendicular to the radial which you are calculating MARC - Personal discussions (Jim Wilson - NCAR).
The first example of how MARC is identified was published in the AMS 15th Conf. on Weather Analysis and Forecasting (Vienna Virginia). The 02 July 1992 Derecho case which formed east of Kansas City and moved across east-central Missouri and into south-central sections of Illinois was one of the first cases used in the MARC study. |
||||||||
|
|
|
|||||||
|
Figure 2. Reflectivity (left); storm-relative velocity (right image) at the 0.5 degree slice from KLSX at 2331 UTC. (Click on image for a larger image). |
||||||||
At 2321 UTC the strongest MARC velocity signature (SRM - right image) was located just down stream from a 50 dBZ core region. The ribbon of outbound velocities on SRM velocity image represent the storm's ascending (updraft) branch while the light to medium blue colors embedded in the higher reflectivity core region signify the region of convective-scale downdrafts and the early stages of the system's mesoscale rear inflow jet (RIJ). This velocity signature lasted for over 40 minutes. A mesovortex is identified along the cyclonic shear side of the bowing segment. As this bow echo grew upscale other mesovortices formed north of the apex of the bow along the cyclonic shear. Mesovortex A (Circ A) rapidly ascending within 15 minutes and spawned two weak tornadoes north and northeast of the city of Columbia MO. |
||||||||
|
|
|
|||||||
Figure 3. Map (left image) shows wind damage reports, convective line positions every 30 minutes and two paths where a persistent MARC velocity signature was identified during the 02 July 1992 derecho. Time-height cross-section (right image) of MARC velocity values in m s-1 and output from the vertical integral liquid (VIL) algorithm. (Click on image for a larger image) |
||||||||
The time-height cross-section of MARC along path C-D along northern Cooper thorugh southern Boone counties in central Missouri is shown in the right image. During the early part of the time-height cross-section MARC magnitudes significantly increased between 5 - 6 km from 22 to 35 m s-1 between from 2246 - 2252 UTC (0.5° slice). The first reports of damaging winds occurred around 2309 UTC or about a 20 minutes after MARC exceeded 25 m s-1. VIL did not show any trends but values persisted between 45 to 50 kg m-2. In the northern time-height trace (A-B) (not shown) the first reports of damaging winds occurred about 20 minutes after MARC exceeded 25 m s-1. VIl values significantly increased 6 mintues preceding the initial onset of damaging winds. Persistent areas of locally enhanced MARC values embedded within the larger ribbon of MARC located along the convective line's forward link appears to associated with the greatest degree of damaging winds. MARC values exceeding 35 - 40 m s-1 within these "hot spots" should be monitored closely for areas of enhanced damaging winds. Gamma-scale vortices (mesovortices) may form at low-levels within the zone or interface between the ascending and descending branches along and just behind the leading edge of the gust front. More detailed info on mesovortex evolution can be found in a number of published papers from (Atkins, Trapp, Weisman and Przybylinski). The second example below is from a recent MARC case which occurred during the evening of 24 May 2004. The 0259 UTC reflectivity image shows an intensifying line segment upshear of the small bow echo over northeast Missouri. This bow echo becomes a large bow echo during the next 60 minutes as it moves to the east-southeast. The SRM velocity image (0259 UTC) (right side) shows a MARC velocity signature along the leading side of this reflectivity segment. MARC velocity signature is meant to be used as a pre-cursor for the onset of damaging winds. The altitude of MARC at this time was at 11.5 KFT (AGL). |
||||||||
 |
 |
|||||||
|
Figure 4. Base reflectivity (left); storm-relative veloctiy (right) from KLSX at 0259 UTC 25 May 2004 bow echo event. Viewing reflectivity - SRM velocity data at 0.5° slice. Using 8 bit WSR-88D data (Click on image for a larger image). |
||||||||
|
|
|
|||||||
|
Figure 5. Plot of the MARC velocity signature over parts of northeast Missouri (left); MARC velocity trace (mgnitudes are in m s-1. Note the lead time between the initial identification of MARC and the time of the first damage report. |
||||||||
|
|
||||||||
 |
 |
|||||||
Figure 6. Reflectivity Image (2.4 degree slice) (left); Storm-Relative Velocity (SRM) image (right) from KLSX for 2231 UTC 22 September 1993. On the SRM image, outbounds (warm colors - red) represent the MCS's updraft current while inbounds (cool colors - green) signify convective-scale downdrafts. MARC is detected along the leading edge of the Quasi-Linear Convective System (QLCS) at approximately 6.1 km (20 Kft). Magnitudes of MARC exceeded 25 m s-1 over each area. |
||||||||
 |
||||||||
Figure 7. Map showing wind damage (W) and tornado (T) tracks for the 22 September 1993 bowing convective line. Tornado tracks are dashed with nearby F-scale damage intensity scale. Squall Line positions are denoted every 30 minutes with times in UTC. See Heinlein et al (1998) (AMS - 19th Conf SLS) for more details about the 22 September 1993 case. |
||||||||
|
Table 1: Pre-convective environments, MARC characteristics and lead times from the initial identification of MARC to first reports of damaging winds are summarized. |
||||||||
|
Additional Examples Identifying MARC:
Major advantages in using MARC as a precursor and tool to forecast damaging winds: 1) potentially longer lead times (10 - to as much as 25 minutes) before the first report of damaging winds. 2) one can detect MARC at relatively large distances (150 - 220 km) away from the WSR-88D. During the 1998 and 2000 convective seasons, a number of bowing MCSs which produced swaths of damaging winds occurred during the late night and early morning hours. Preliminary results showed that the MARC velocity signature was not as identifiable with the late night noctural convection compared to convection occurring during the afternoon through evening hours. We continue to test the MARCsignature on these cases. More will be forth-coming concerning the utility of MARC with nocturnal MCS events. If you have questions, please e-mail Gary Schmocker or Ron Przybylinski. Back to the COMET - Damaging Wind Studies Page
|
||||||||


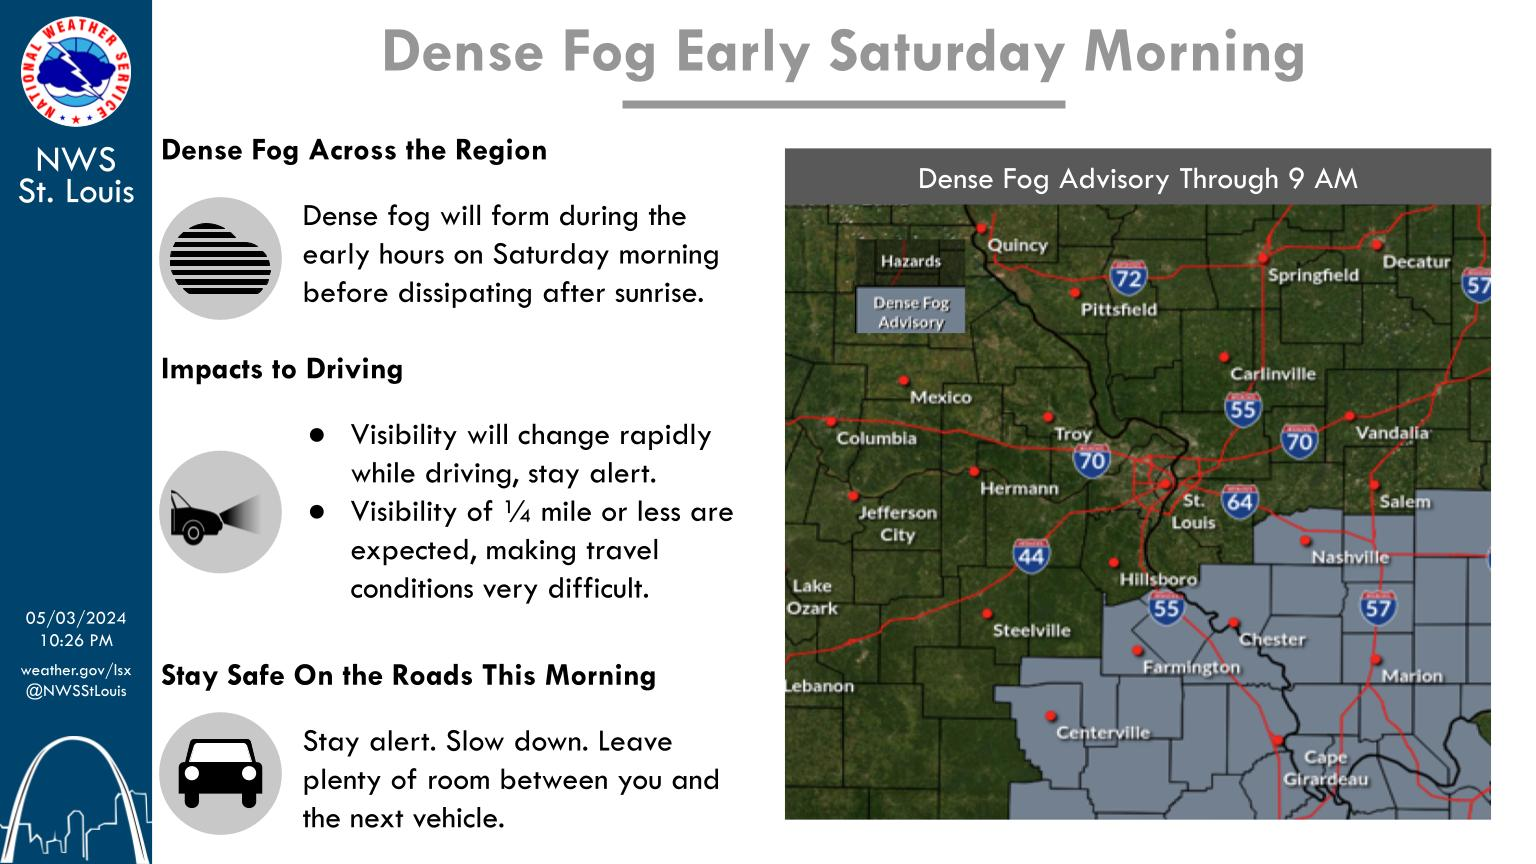 Weather Story
 Weather Map
 Local Radar